



- In 2001, Rivers and colleagues studied patients with severe sepsis or septic shock in one urban emergency department.
- They found that mortality was significantly lower with a 6-hour early goal-directed therapy (EGDT) protocol than with standard treatment:
- EGDT: 30.5% mortality
- Standard therapy: 46.5% mortality
- The idea was that usual treatment was not aggressive or early enough.
- EGDT therefore used a central venous catheter to monitor:
- Central venous pressure
- Central venous oxygen saturation
- These measurements were used to guide:
- IV fluids
- Vasopressors
- Packed red blood cell (PRBC) transfusions
- Dobutamine
- The aim was to reach specific predefined physiologic targets.
- Based on this type of research, the Surviving Sepsis Campaign guidelines were first published in 2004 and later updated in 2008, 2014, and 2016.
- Different treatment methods were graded by an international expert panel.
- A later randomized prospective study showed that protocol-based treatment for early septic shock did not improve outcomes.
- This newer study was not identical to the original Rivers study because survival rates were already much higher.
- Therefore, the newer findings may mean that usual treatment had already adopted many principles of EGDT, making the difference very small.
- The study also found no significant benefit from routinely using central venous catheterization and central hemodynamic monitoring in every patient.
- In the 2016 update of the Surviving Sepsis Campaign guidelines, there was a major change in how sepsis was defined.
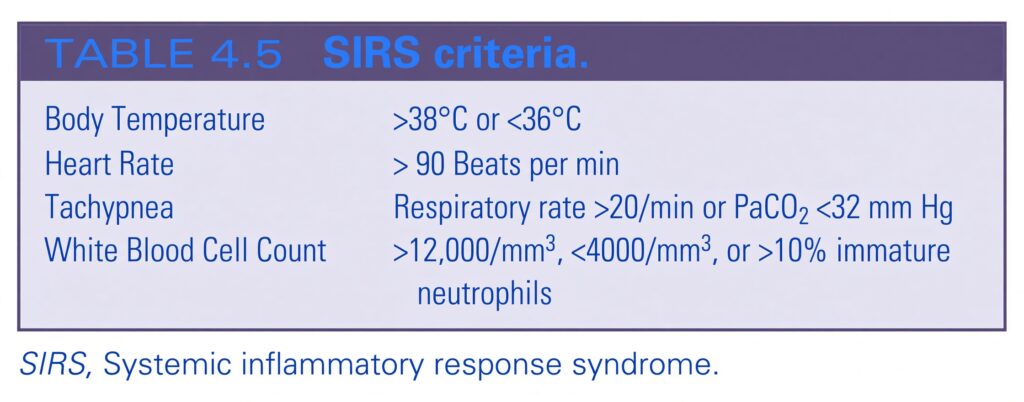
- Earlier versions used SIRS criteria (Table 4.5).
- Under the older definition, a patient needed:
- At least 2 of 4 SIRS criteria
- Plus a source of infection
- This definition had problems because noninfectious conditions that activate inflammation could produce a similar physiologic picture.
- Instead of SIRS, sepsis was then defined as:
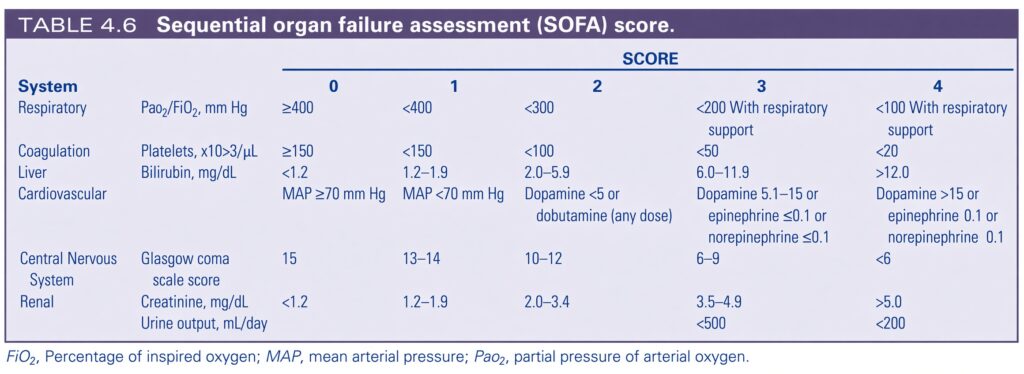
- An increase of 2 points in the Sequential Organ Failure Assessment (SOFA) score from baseline (Table 4.6).
- However, SOFA can be difficult to calculate at the bedside and requires laboratory results.
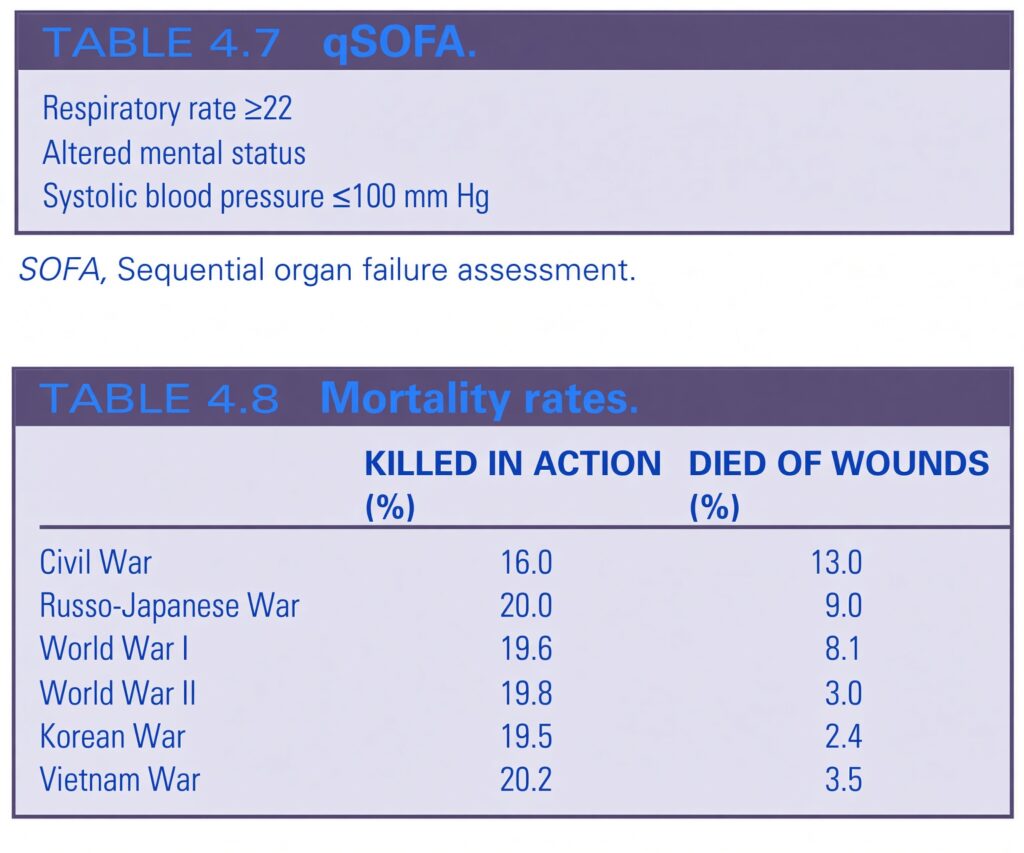
- Therefore, a simpler version called qSOFA (Table 4.7) was developed.
- qSOFA can be assessed at the bedside using:
- Tachypnea
- Altered mental status
- Hypotension
- If a patient meets 2 of these criteria and is at risk for sepsis, further investigation for an infectious source should be performed.
KEY CONCEPT
- Early EGDT: aggressive early treatment using central hemodynamic measurements to guide fluids, vasopressors, PRBCs, and dobutamine.
- Later evidence: routine protocol-based EGDT and mandatory central venous monitoring did not improve outcomes.
- Old sepsis definition: infection + ≥2 SIRS criteria (Table 4.5).
- Newer definition: infection-associated organ dysfunction represented by SOFA increase ≥2 points (Table 4.6).
- qSOFA: simpler bedside assessment using:
- Tachypnea
- Altered mental status
- Hypotension
- Conceptual example: If a patient at risk for sepsis has 2 qSOFA features, further investigation for an infectious source is indicated.
PROBLEMS WITH RESUSCITATION
- Lessons from the Korean War showed that resuscitation with blood and blood products was useful.
- During that war, the accepted approach was to give patients only a limited amount of salt and water after injury.
- By the Vietnam War, giving more fluid than the amount of blood lost had become acceptable.
- This practice may have been influenced by Tom Shires’ studies of hemorrhagic shock.
- In his classic experiment, Shires used the Wiggers model and bled 30 dogs to a mean BP of 50 mm Hg for 90 minutes.
- He then divided the dogs into three groups:
- 10 dogs: LR solution equal to 5% of body weight, followed by blood.
- 10 dogs: Plasma 10 mL/kg, followed by blood.
- 10 dogs: Shed blood alone.
- The dogs receiving LR solution had the best survival.
- Shires concluded that:
- Replacing lost blood with whole blood remained the main treatment for shock.
- Replacing the additional functional volume deficit in the interstitium with a balanced salt solution could also be helpful.
- Therefore, Shires recommended starting LR resuscitation while whole-blood transfusions were being prepared.
- Soon, surgeons changed from using crystalloids carefully to using them aggressively.
- Surgeons returning from the Vietnam War promoted crystalloids as a cheap and easy way to resuscitate patients and believed they saved lives.
- This approach was followed by a condition called “Da Nang lung,” also called shock lung and later ARDS.
- The proposed explanation was that aggressive resuscitation and improved critical care kept battlefield patients alive long enough to develop ARDS.
- Better treatment of renal failure was also thought to contribute to this increased survival.
- However, there was no supporting evidence for this explanation.
- The killed-in-action rate—wounded patients who died before reaching a facility with a surgeon—had not changed for more than a century (Table 4.8).
- The died-of-wounds rate—wounded patients who died after reaching a facility with a physician—had decreased during World War II because of antibiotics.
- However, this rate was slightly higher during the Vietnam War.
- The slightly higher Vietnam War rate was thought to be because helicopters transported wounded patients to medical facilities much faster.
- Average transport time decreased from about 4 hours to 40 minutes.
- But if very sick patients who would normally have died in the field were transported quickly and then died at the medical facility, the killed-in-action rate should have decreased.
- It did not decrease.
- The rate and cause of renal failure also did not significantly change between the Korean and Vietnam Wars.
- Another proposed explanation was that Vietnam War wounds were more severe because the enemy used high-velocity AK-47 rifles.
- However, the bullets used by the AK-47 were similar to those used by enemies in the Russo-Japanese War, World War I, and World War II.
- The 7.62-mm round used by the AK-47 had actually been invented by the Japanese in the 1890s.
- In the early 1970s, the U.S. prehospital system began to develop.
- Previously, ambulances were often hearses driven by morticians, which explains why early ambulances had a station-wagon design.
- As emergency medical technicians and paramedics became established professions, they began resuscitation in the field and continued it during transport to the hospital.
- In 1978, the first ATLS course was given.
- To prevent shock, ATLS recommended:
- Two large-bore IV lines for trauma patients.
- 2 L of LR solution.
- The ATLS text specifically recommended that patients with class III shock receive 2 L of LR followed by blood products.
- Clinicians learned that crystalloids appeared harmless and increased BP in patients with hypotension.
- During the 1980s and early 1990s, aggressive resuscitation became widely taught and accepted.
- The two large-bore IV lines started in the field were sometimes exchanged for even larger IV lines using a wire-guided system.
- Central venous lines were inserted early to allow aggressive fluid administration.
- Some trauma centers even routinely performed saphenous vein cut-downs at the ankle to place IV tubing directly into the vein and maximize flow during resuscitation.
- Technology then produced machines capable of rapidly infusing large amounts of crystalloid.
- Research showed that tissue ischemia caused many different disturbances.
- Therefore, the goal became optimization of oxygen delivery.
- As a result, patients received massive volumes of crystalloids.
- Residents were encouraged to aggressively “pound” patients with fluids.
- It was even taught that if trauma patients did not develop ARDS, they had not been adequately resuscitated.
- However, many clinical trials eventually showed that prehospital fluids did not improve outcomes (Table 4.9).
KEY CONCEPT
- Korean War: limited salt and water + blood/blood products.
- Vietnam War: increasingly aggressive crystalloid resuscitation.
- Shires’ study: LR + blood produced the best survival in his dog model.
- This led to the belief that LR should be started while blood was being prepared.
- Aggressive crystalloid use eventually became associated with Da Nang lung → shock lung → ARDS.
- The explanation that aggressive resuscitation simply kept patients alive long enough to develop ARDS was not supported by the evidence described.
- 1980s–1990s: very aggressive fluid resuscitation became standard teaching.
- Later clinical trials showed that prehospital fluid administration did not improve outcomes (Table 4.9).
Conceptual Example
Old approach:
Injury → give large amounts of crystalloid → increase BP → assume better resuscitation.
What later evidence showed:
Large amounts of crystalloid → did not necessarily improve outcome → excessive resuscitation could contribute to complications such as ARDS.
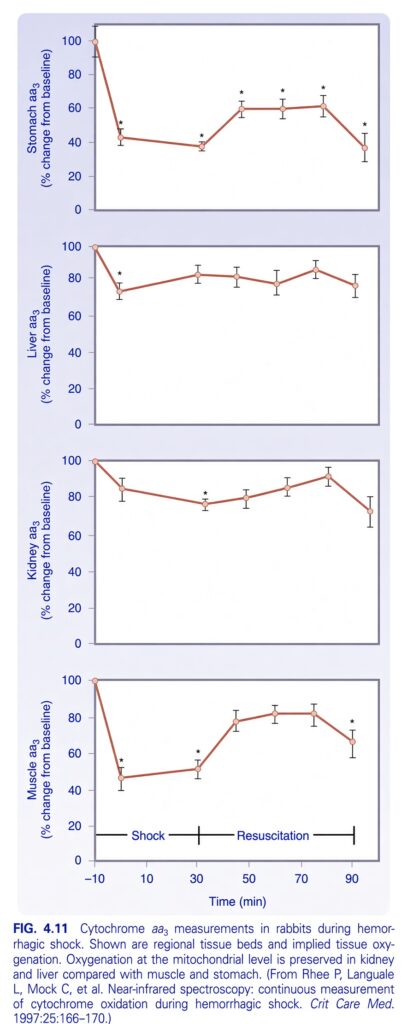
FIG. 4.11 — Cytochrome aa₃ During Hemorrhagic Shock
🧠 The BIG IDEA
This figure shows what happens to oxygen use inside different organs during hemorrhagic shock and after resuscitation.
The marker being measured is cytochrome aa₃.
What is cytochrome aa₃?
Cytochrome aa₃ is part of the mitochondrial electron transport chain.
Think of mitochondria as the cell’s power plants.
Cytochrome aa₃ helps show whether oxygen is reaching the mitochondria and being used for energy production.
So this graph gives us an idea about tissue oxygenation at the mitochondrial level.
🔑 FIRST: Understand the Y-axis
All four graphs have the same basic vertical scale:
Cytochrome aa₃ (% change from baseline)
The starting value at −10 minutes is:
100% = baseline
So:
- 100% → normal baseline level
- 80% → about 20% below baseline
- 60% → about 40% below baseline
- 40% → about 60% below baseline
Very important:
Lower cytochrome aa₃ value = greater reduction in mitochondrial oxygenation/oxidation.
Higher value = better preserved mitochondrial oxygenation.
⏱️ Understand the X-axis
The horizontal axis shows:
Time (minutes)
The experiment begins at:
−10 minutes
Then:
0 → 30 → 50 → 60 → 75 → 90 minutes
The bottom labels divide the experiment into two major periods:
🔴 Shock
The animal is experiencing hemorrhagic shock.
🟢 Resuscitation
Treatment is given to restore circulation and oxygen delivery.
❤️ NOW UNDERSTAND EACH GRAPH
There are four tissue beds:
- Stomach
- Liver
- Kidney
- Muscle
The key comparison is:
Stomach and muscle show a much larger fall in cytochrome aa₃, whereas kidney and liver maintain much more of their mitochondrial oxygenation.
This is the major message of the figure.
1. 🟠 STOMACH
Look at the top graph.
Baseline
At −10 minutes:
100%
Then hemorrhagic shock occurs.
At about 0 minutes:
The value falls to approximately:
43%
That’s a very large decrease.
So:
100 → 43
What does that mean?
The stomach is experiencing a major reduction in mitochondrial oxygenation during shock.
Then around 30 minutes
It remains low:
≈ 37%
So the stomach continues to show poor oxygenation.
🚑 Resuscitation begins
Now look at what happens after resuscitation.
The value rises:
≈ 37% → 59% → 59% → 61%
So the stomach improves substantially.
But it does not return completely to the original 100% baseline during the period shown. about 90 minutes
It falls again to approximately:
36%
So the stomach remains particularly vulnerable to the effects of hemorrhagic shock.
2. 🟢 LIVER
Now look at the second graph.
Baseline:
100%
After hemorrhagic shock:
≈ 72%
So the liver decreases, but only moderately.
Compare this with stomach:
Stomach ≈ 43%
Liver ≈ 72%
Therefore:
The liver maintains much better mitochondrial oxygenation than the stomach.
During resuscitation
The liver stays relatively high:
≈ 80% → 80% → 77% → 85% → 75%
There are fluctuations, but the values remain substantially higher than those seen in stomach and muscle during shock.
Key point:
Liver mitochondrial oxygenation is relatively preserved during hemorrhagic shock.
3. 🔵 KIDNEY
Now look at the third graph.
Baseline:
100%
After shock:
≈ 84%
Then around 30 minutes:
≈ 76%
So there is a decrease, but it is much smaller than in:
- Stomach
- Muscle
During resuscitation
The kidney improves:
≈ 79% → 84% → 90%
Then at approximately 90 minutes:
≈ 72%
Again, there are fluctuations.
But overall:
Kidney mitochondrial oxygenation remains relatively well preserved compared with stomach and muscle.
4. 🔴 MUSCLE
Now look at the bottom graph.
This is another tissue that is strongly affected.
Baseline:
100%
During hemorrhagic shock:
≈ 46%
That’s a very large decrease.
So:
100 → 46
Meaning:
Muscle mitochondrial oxygenation falls substantially during hemorrhagic shock.
At around 30 minutes
It is still low:
≈ 51%
Then resuscitation begins.
After resuscitation
The value rises dramatically:
≈ 78% → 82% → 82%
This indicates substantial recovery of mitochondrial oxygenation.
At around 90 minutes:
≈ 66%
It decreases again but remains above the lowest values during shock.
⭐ THE MOST IMPORTANT COMPARISON
Put the four tissues side by side:
| Tissue | Effect during hemorrhagic shock | Overall mitochondrial oxygenation |
|---|---|---|
| 🟠 Stomach | Large decrease | Poorly preserved |
| 🟢 Liver | Smaller decrease | Relatively preserved |
| 🔵 Kidney | Smaller decrease | Relatively preserved |
| 🔴 Muscle | Large decrease | Poorly preserved |
The central message:
Kidney and liver preserve mitochondrial oxygenation better than muscle and stomach during hemorrhagic shock.
🧠 WHY IS THIS IMPORTANT?
This figure demonstrates that:
Shock does NOT affect every organ equally.
When blood is lost:
↓ Blood volume
↓
↓ Cardiac output
↓
↓ Oxygen delivery
↓
The body preferentially maintains blood flow to important organs.
As a result, some tissues experience a greater reduction in oxygenation than others.
🚨 STOMACH vs KIDNEY/LIVER
This is probably the most important comparison in the figure.
Stomach:
100% → ~40%
Huge fall.
Kidney:
100% → ~75–85%
Much smaller fall.
Liver:
100% → ~70–80%
Much smaller fall.
Therefore:
During hemorrhagic shock, mitochondrial oxygenation is relatively preserved in the kidney and liver compared with the stomach.
🔥 MUSCLE vs STOMACH
Both show substantial decreases.
Muscle:
100% → ~46%
Stomach:
100% → ~43%
So both are strongly affected during shock.
After resuscitation, both show substantial improvement.
🚑 WHAT DOES RESUSCITATION DO?
The vertical line at approximately 30 minutes marks the transition to the resuscitation period.
Think of resuscitation as:
Putting fluid/blood back into the circulation → improving circulation and oxygen delivery.
After resuscitation:
Stomach
⬆️ improves
Liver
↔️ remains relatively preserved
Kidney
⬆️ improves/mostly preserved
Muscle
⬆️ markedly improves
⚠️ BUT NOTICE SOMETHING IMPORTANT
Even after resuscitation, the curves do not simply return to 100% and stay there.
There are fluctuations.
For example:
- Stomach improves but later falls again.
- Muscle improves but later falls.
- Kidney remains relatively preserved but fluctuates.
- Liver also fluctuates.
Meaning:
Restoring circulation does not necessarily mean that every tissue immediately returns to normal mitochondrial oxygenation.
⭐ WHAT DO THE ASTERISKS (*) MEAN?
You can see asterisks above several data points.
These indicate that those measurements are statistically significantly different from the baseline/reference condition, according to the study’s statistical analysis.
So:
Asterisk = statistically significant difference, not simply “the value looks different.”
📏 WHAT DO THE VERTICAL ERROR BARS MEAN?
Each point has a vertical line around it.
These are error bars.
They show the variability/uncertainty around the measured value.
So don’t interpret the point as an absolutely exact number.
Think:
Dot = measured average
Error bar = how much variation exists around that measurement
🧩 NOW READ THE FOUR GRAPHS AS ONE STORY
BASELINE
All tissues ≈ 100%
        ↓
HEMORRHAGIC SHOCK
        ↓
Oxygen delivery falls
        ↓
BUT different tissues respond differently
        ↓
STOMACH ↓↓↓
MUSCLE  ↓↓↓
LIVER   ↓
KIDNEY  ↓
        ↓
RESUSCITATION
        ↓
Oxygen delivery improves
        ↓
STOMACH ↑
MUSCLE  ↑↑
KIDNEY  remains relatively preserved / improves
LIVER   remains relatively preserved
        ↓
Mitochondrial oxygenation partially recovers
🎯 THE SINGLE MOST IMPORTANT CONCEPT
Hemorrhagic shock causes tissue hypoxia, but the degree of mitochondrial oxygenation loss is organ-specific.
Stomach + muscle → greater reduction
Kidney + liver → relatively preserved
After resuscitation, mitochondrial oxygenation generally improves, particularly in tissues that were severely affected.
🧠 SUPER-EASY MEMORY
“S & M suffer more; K & L are protected.”
S = Stomach ↓↓↓
M = Muscle ↓↓↓
K = Kidney ↓
L = Liver ↓
So remember:
Stomach and Muscle show the greatest fall in cytochrome aa₃, while Kidney and Liver maintain relatively preserved mitochondrial oxygenation during hemorrhagic shock.
Final takeaway
Hemorrhage → ↓ oxygen delivery → tissue mitochondrial oxygenation falls, but not equally in every organ → resuscitation improves oxygenation.
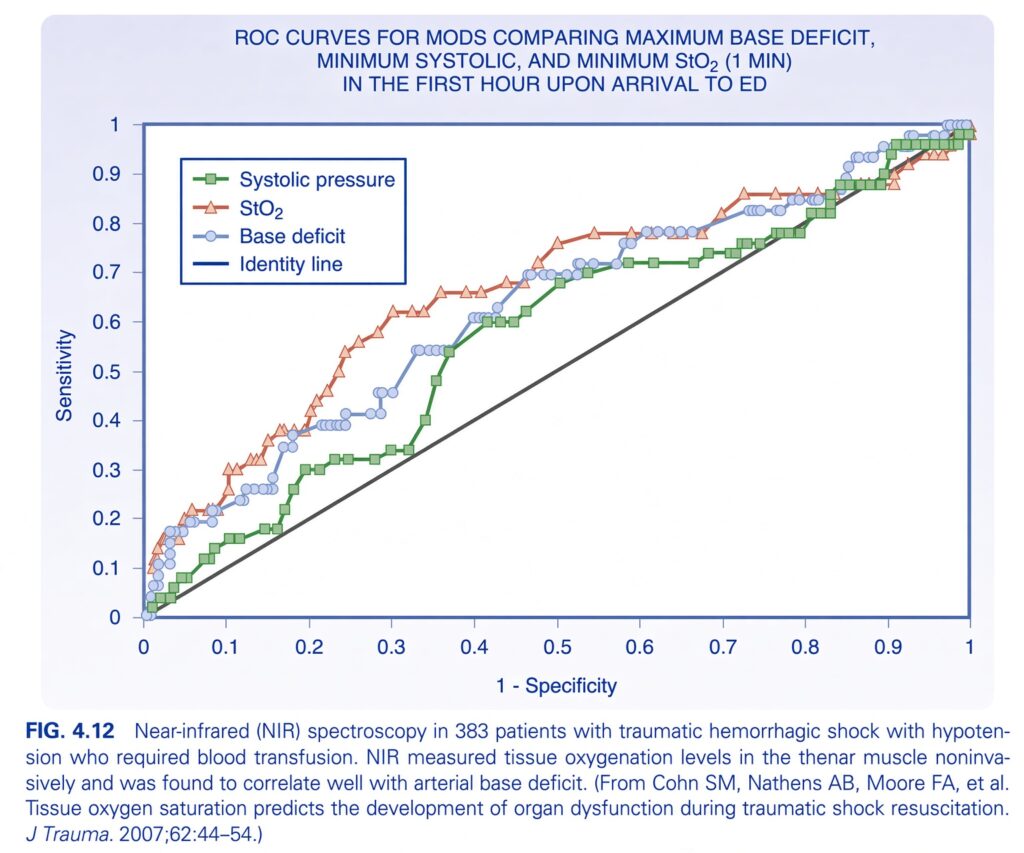
FIG. 4.12 — ROC Curves for Predicting Multiple Organ Dysfunction Syndrome (MODS)
🧠 First understand what this graph is asking
This graph compares three measurements to see how well each one can identify patients at risk of multiple organ dysfunction syndrome (MODS) after traumatic hemorrhagic shock.
The three measurements are:
- 🟢 Minimum systolic pressure
- 🔴 Minimum StO₂
- 🔵 Maximum base deficit
The study included 383 patients with traumatic hemorrhagic shock and hypotension who required blood transfusion.
The important message from the figure:
Near-infrared spectroscopy (NIRS)-measured StO₂ correlated well with arterial base deficit and could help identify tissue hypoxia and predict organ dysfunction.
1. What is an ROC curve?
Before looking at the colored lines, understand ROC.
ROC = Receiver Operating Characteristic curve
It answers:
How good is a test at separating patients who develop MODS from those who do not?
Imagine a test that gives a number to every patient.
We need to decide:
“At what value should we call the patient high-risk?”
Changing that cutoff changes:
- Sensitivity
- Specificity
The ROC curve shows what happens as we change that cutoff.
2. X-axis — 1 − Specificity
The horizontal axis says:
1 − Specificity
This is also called the false-positive rate.
So:
1 − specificity = false-positive rate
Moving right means:
We are accepting more false-positive results.
3. Y-axis — Sensitivity
The vertical axis is:
Sensitivity
Sensitivity means:
Among patients who actually develop MODS, how many does the test correctly identify?
For example:
If 100 patients eventually develop MODS and the test correctly identifies 80:
Sensitivity = 80%
So moving upward means:
The test is correctly identifying more patients who will develop MODS.
4. ⚫ Identity line
The diagonal black line is called the:
Identity line
It runs approximately from:
(0,0) → (1,1)
This represents a test with essentially no useful discrimination.
In simple terms:
The test is performing about as well as random guessing.
Therefore:
ROC curve close to the diagonal → poor test
ROC curve farther above the diagonal → better test
5. 🟢 GREEN = Systolic Pressure
The green curve represents:
Minimum systolic blood pressure
The curve is above the identity line, so systolic pressure has some ability to distinguish patients at risk of MODS.
But notice:
The green curve is generally lower than the red and blue curves over much of the graph.
That means its overall discriminatory performance is less impressive than the other two measurements.
6. 🔴 RED = StO₂
The red curve represents:
Minimum StO₂
What is StO₂?
StO₂ = tissue oxygen saturation
It was measured using:
Near-infrared spectroscopy (NIRS)
The study measured tissue oxygenation noninvasively in the thenar muscle.
Think of StO₂ as:
“How well oxygenated is the tissue?”
This is particularly useful because blood pressure can sometimes look acceptable while the tissues are still suffering from inadequate oxygen delivery.
Look at the red curve
The red curve generally lies above the green curve and is often above the blue curve.
That means:
StO₂ has good ability to discriminate patients at risk of MODS.
The curve rises relatively quickly toward high sensitivity.
7. 🔵 BLUE = Base Deficit
The blue curve represents:
Maximum base deficit
Base deficit is obtained from arterial blood measurements.
It gives information about the patient’s metabolic state and can increase when tissues have inadequate oxygen delivery and metabolism becomes disturbed.
Think:
Base deficit = an indirect marker of the body’s oxygen-delivery/metabolic problem.
The blue curve is also substantially above the identity line.
Therefore:
Base deficit has good predictive/discriminatory ability for MODS.
⭐ 8. Compare the three curves
Look at their positions.
🔴 StO₂
Generally higher → good discrimination
🔵 Base deficit
Also high → good discrimination
🟢 Systolic pressure
Generally lower → less discriminatory
So the figure supports the idea that:
Tissue oxygenation measured by StO₂ provides useful information beyond simply looking at blood pressure.
9. Why is this clinically important?
This is the key concept behind the figure.
A patient can have:
🩸 Blood pressure problem
but blood pressure alone does not necessarily tell us exactly how well the tissues are being oxygenated.
The tissue may still be experiencing:
↓ Oxygen delivery
↓
Tissue hypoxia
↓
Cellular dysfunction
↓
Organ dysfunction
Therefore, measuring tissue oxygenation can provide additional information.
10. 🧠 What does NIRS actually do?
NIRS = Near-infrared spectroscopy
It uses near-infrared light to estimate tissue oxygen saturation.
In this study:
NIRS measured StO₂ in the thenar muscle.
The thenar muscle is the fleshy part of the palm at the base of the thumb.
So imagine placing a small sensor on the thenar muscle:
Sensor → measures tissue oxygen saturation → gives StO₂
11. Why compare StO₂ with base deficit?
Because they provide different types of information.
🔵 Base deficit
Obtained from arterial blood.
It reflects a systemic metabolic disturbance associated with inadequate oxygen delivery.
🔴 StO₂
Measures tissue oxygenation directly/noninvasively at the monitored site.
Therefore:
Base deficit tells us about the metabolic consequence; StO₂ gives information about tissue oxygenation.
12. What does “correlate well with arterial base deficit” mean?
The caption says NIR spectroscopy:
measured tissue oxygenation levels and was found to correlate well with arterial base deficit.
In simple terms:
When the patient’s oxygen-delivery problem became worse:
StO₂ tended to change in a way that corresponded with worsening base deficit.
So the tissue measurement provided useful information about the patient’s systemic shock state.
13. What does “predicts development of organ dysfunction” mean?
The study was interested in whether these measurements could help identify patients who would later develop:
MODS = Multiple Organ Dysfunction Syndrome
That means:
Several organs become dysfunctional because of severe systemic illness/injury.
The ROC curves show how well the measurements discriminate between patients who do and do not develop MODS.
🔍 How to actually READ an ROC curve
Don’t just look at which line is highest at one particular point.
Instead, look at the overall position of the curve.
Good ROC curve:
Sensitivity
1 |             ______
  |          __/
  |       __/
  |    __/
  | __/
0 |____________________
  0                   1
      1 - Specificity
The curve bows strongly toward the upper-left corner.
Poor ROC curve:
Sensitivity
1 |              /
  |            /
  |          /
  |        /
  |      /
0 |____/_______________
  0                   1
It stays close to the diagonal identity line.
⭐ Upper-left corner = ideal
The ideal test would reach:
Sensitivity = 1.0
and
1 − specificity = 0
That means:
100% sensitivity
and
100% specificity
So the closer a curve gets to the upper-left corner, the better its discrimination generally is.
🧩 Understand the graph from bottom-left → top-right
At the beginning:
Sensitivity is low.
↓
As the cutoff changes:
Sensitivity increases.
↓
But false positives also increase.
↓
Eventually:
Sensitivity approaches 1.0
and
1 − specificity also approaches 1.0.
That produces the ROC curve.
🧠 What the three lines are REALLY telling you
| Curve | Measurement | What it represents | Overall message |
|---|---|---|---|
| 🔴 StO₂ | Tissue oxygen saturation | Tissue oxygenation | Good discrimination |
| 🔵 Base deficit | Arterial blood measurement | Systemic metabolic/oxygen-delivery disturbance | Good discrimination |
| 🟢 Systolic pressure | Blood pressure | Hemodynamic status | Less discriminatory than the other two in this graph |
| ⚫ Identity line | Reference | Random/no discrimination | Poor performance |
🎯 MOST IMPORTANT CONCEPT
Don’t confuse these three measurements:
Systolic pressure
→ “How is the circulation/hemodynamic pressure?”
Base deficit
→ “Is there evidence of a systemic metabolic disturbance associated with inadequate oxygen delivery?”
StO₂
→ “How well oxygenated is the measured tissue?”
🔥 Final picture to memorize
TRAUMATIC HEMORRHAGIC SHOCK
            ↓
     ↓ Oxygen delivery
            ↓
      Tissue hypoxia
            ↓
       Organ injury
            ↓
           MODS
To assess this risk, the study compared:
🟢 Blood pressure
       vs
🔵 Base deficit
       vs
🔴 Tissue StO₂
The ROC curves show that StO₂ and base deficit provide useful discrimination for MODS, while systolic pressure alone is less discriminative in this study.
One-line exam takeaway:
NIRS-derived tissue StO₂ is a useful noninvasive indicator of tissue oxygenation and showed good ability to predict organ dysfunction in patients with traumatic hemorrhagic shock.
SUPERFASR MADE BY CEO AND FOUNDER DR SHEEN
