



Bleeding
- Research and clinical experience have taught us a lot about how the body responds to bleeding.
- The ATLS course describes four classes of shock (Table 4.1).
- This classification helps explain the body’s responses to hemorrhagic shock, identify blood loss, and guide treatment.
- Conceptually, shock can occur at three levels of the cardiovascular system (Fig. 4.5):
- Heart level: The heart cannot pump properly because of:
- External problems: tension pneumothorax, hemothorax, or cardiac tamponade.
- Internal problems: myocardial infarction, cardiac injury, or cardiac failure.
- Large/medium vessel level: Bleeding causes loss of blood volume and leads to shock.
- Small vessel level: Neurologic dysfunction or sepsis causes vasodilation and abnormal distribution of blood, leading to shock.
- Heart level: The heart cannot pump properly because of:
- The four ATLS classes of shock have limitations because they were not rigorously tested and were partly created arbitrarily.
- Patients do not always show all the expected changes, especially at the extremes of age.
- Children have more water in their bodies and can compensate for large blood losses.
- Children may show only tachycardia until they suddenly reach a point where compensation fails.
- After that point, their condition can deteriorate rapidly.
- Elderly patients have less ability to compensate for blood loss.
- Therefore, they may show severe shock after losing a smaller amount of blood.
- This is because their ability to increase cardiac compensation and recruit fluid reserves is reduced.
- The signs traditionally taught in ATLS can be difficult to interpret, especially in trauma patients.
- For example, altered mental status can result from:
- Blood loss.
- Traumatic brain injury (TBI).
- Pain.
- Illicit drugs.
- Respiratory rate and skin changes can also have several causes.
- For example, abnormal breathing or skin color may be caused by:
- Pneumothorax.
- Rib-fracture pain.
- Inhalation injury.
- Many methods are available to monitor shock.
- However, blood pressure (BP) remains the most useful clinical measurement.
- During resuscitation, treatment goals must be established.
- The patient’s original BP and blood volume are often unknown.
- There is no single endpoint that works for every patient.
- Useful markers include:
- Normalization of serum lactate.
- Improvement of base deficit.
- Normalization of pH.
- Control of hemorrhage when bleeding is present.
- The patient’s overall clinical condition.
- Patients with class I shock usually have few clinical symptoms except anxiety.
- However, anxiety may be caused by:
- Blood loss.
- Pain.
- Trauma.
- Drugs.
- A heart rate above 100 beats/min has traditionally been used as a sign of bleeding.
- However, evidence supporting this is weak.
- Heart rate is not reliable for determining:
- Need for emergency treatment.
- Need for packed red blood cell (PRBC) transfusion during the first 2 hours.
- Severity of injury.
- Heart rate may also remain unchanged even when systolic BP is below 90 mm Hg.
- In class II shock, increased heart rate is traditionally expected.
- However, heart rate is unreliable because pain and nervousness can also increase it.
- Pulse pressure means the difference between systolic and diastolic BP.
- Changes in pulse pressure are difficult to identify because the patient’s normal BP may not be known.
- The change is thought to occur because epinephrine constricts blood vessels, increasing diastolic pressure.
- BP is theoretically expected to fall in class III shock.
- At this stage, the patient has lost about 30–40% of blood volume.
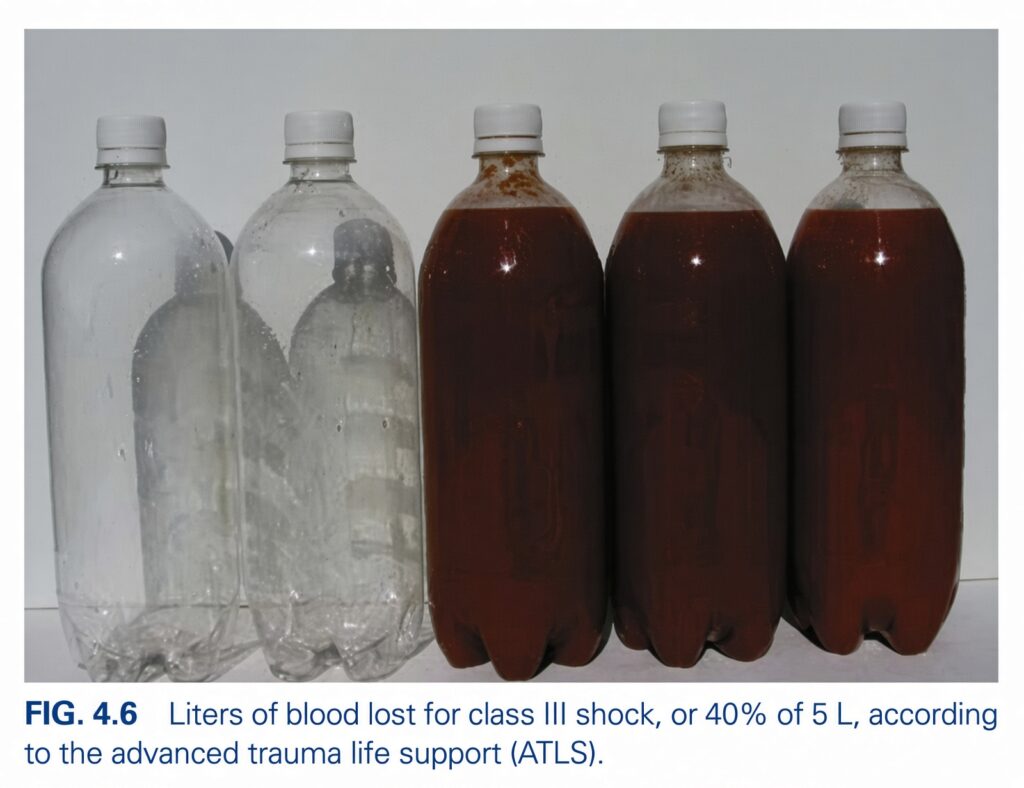
- In an average 75-kg (168-lb) man, this is about 2 L of blood loss (Fig. 4.6).
- A can of soda or beer contains about 355 mL.
- A six-pack contains about 2130 mL.
- Therefore, a hypotensive patient from blood loss has theoretically lost about the amount of blood contained in a six-pack.
- The most important step in hemorrhagic shock is to:
- Recognize that blood loss is causing the shock.
- Find the bleeding source.
- Stop the bleeding.
- Resuscitation is performed at the same time when needed.
- ATLS is designed for physicians who are not necessarily surgeons, so some details of bleeding physiology are not included.
- Surgeons recognize that animals and humans can respond differently to injury.
- With arterial bleeding, animals may not always develop tachycardia first.
- They may actually develop bradycardia.
- This may be a protective response because slower heart rate reduces cardiac output and may reduce uncontrolled blood loss.
- However, this response does not consistently occur in all animals or humans.
- Some evidence shows that relative bradycardia can occur in humans.
- Relative bradycardia means:
- Heart rate <100 beats/min
- At the same time, systolic BP <90 mm Hg
- Bleeding patients with relative bradycardia have a lower mortality rate.
- Up to 44% of hypotensive patients who are not bleeding can also have relative bradycardia.
- However, very slow heart rates are not protective.
- Patients with a heart rate <60 beats/min are usually critically ill.
- Bleeding patients with a heart rate of 60–90 beats/min have the highest survival compared with patients with tachycardia >90 beats/min.
- The body’s response also differs between arterial and venous bleeding.
- Arterial bleeding is obvious but may temporarily stop by itself.
- The body can limit arterial blood loss because:
- Surrounding tissues can trap the blood.
- The cut artery can go into spasm.
- A clot can form.
- A lacerated artery may bleed more than a completely cut artery because arterial spasm can enlarge the opening.
- A clot does not always form in cut or lacerated arteries.
- Arteries do not have valves.
- Therefore, BP can fall early, even before a large amount of blood is lost.
- In arterial bleeding, hypotension may occur early.
- However, tissue ischemia may not have developed yet.
- Therefore, lactate and base deficit can still be normal.
- Venous bleeding is usually slower.
- This gives the body more time to compensate.
- Water can move from:
- Intracellular space.
- Interstitial space.
into the circulation.
- Therefore, a large amount of blood can be lost before hypotension develops.
- Because venous or capillary bleeding is slower, tissue ischemia can develop during the process.
- Therefore, lactate and base deficit may become abnormal.
- Massive venous blood loss can occur before hypotension appears.
- Hemoglobin (Hgb) and hematocrit are traditionally considered unreliable for estimating blood loss.
- This is particularly true in patients who have not received resuscitation.
- After giving crystalloids, however, hemoglobin and hematocrit can fall rapidly.
- Studies have shown that hemoglobin can already be low within 30 minutes of arriving at a trauma center.
- Therefore, a normal or high hemoglobin level does not rule out major bleeding.
- A low hemoglobin level, because it can appear rapidly, generally indicates severe blood loss.
- Because there are no perfect signs for identifying bleeding, researchers have studied heart rate variability or complexity as a possible new vital sign.
- Many studies show that abnormal heart rate variability or complexity is associated with poor outcomes.
- It would need to be calculated by software and converted into an index.
- It cannot simply be determined by examining the patient.
- The exact physiologic reason for its association with poor outcomes is still unknown.
- It could potentially be added to existing monitors.
- However, its usefulness has not yet been confirmed.
- Traditionally, hypotension has been defined as BP of 90 mm Hg or lower.
- However, this value can differ between patients, especially with age.
- Eastridge and colleagues suggested redefining hypotension as below 110 mm Hg.
- In 2008, Bruns and colleagues found that a prehospital BP below 110 mm Hg was associated with a sharp increase in mortality.
- About 15% of patients with BP below 110 mm Hg eventually died in the hospital.
- They therefore recommended changing prehospital trauma triage criteria.
- In older patients, normal vital signs may fail to detect hidden (occult) poor tissue perfusion.
- Older patients may already have increased lactate and base deficit despite apparently normal vital signs.
KEY CONCEPT
- Shock = inadequate tissue perfusion.
- Shock can occur at:
- Heart level → Pump failure.
- Large/medium vessels → Blood loss.
- Small vessels → Vasodilation and abnormal blood distribution.
- BP is the most useful clinical measurement, but no single measurement completely identifies shock.
- In hemorrhagic shock, the most important action is find the bleeding source and control it while resuscitating.
- Arterial bleeding → Faster → BP may fall early, while lactate may still be normal.
- Venous bleeding → Slower → Large blood loss may occur before hypotension, allowing lactate/base deficit to become abnormal.
- Normal/high Hgb does not rule out major bleeding, while a low Hgb can indicate severe blood loss.
- Older patients may have occult hypoperfusion despite apparently normal vital signs.
Conceptual Examples
- Arterial injury → Rapid blood loss → Early hypotension → Lactate may initially remain normal.
- Slow venous bleeding → Body compensates by recruiting fluid → Large blood loss can occur before BP falls.
- Elderly trauma patient with “normal” BP but increased lactate/base deficit → Hidden tissue hypoperfusion may already be present.
- Hemorrhagic shock → Recognize blood loss → Find and stop bleeding → Resuscitate simultaneously.
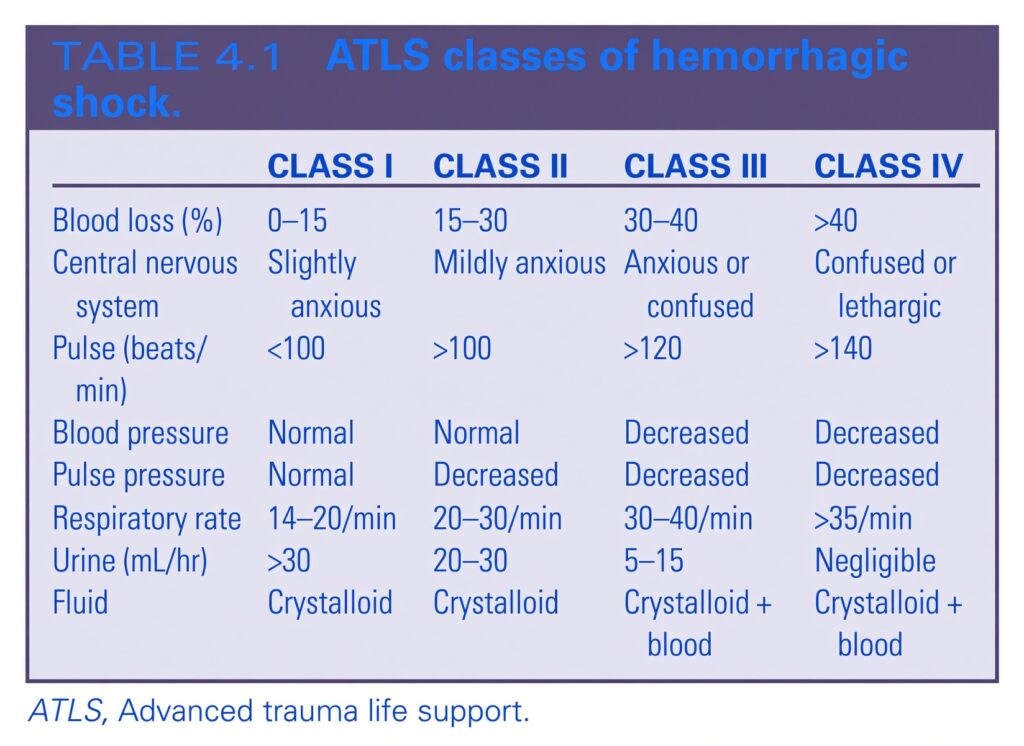
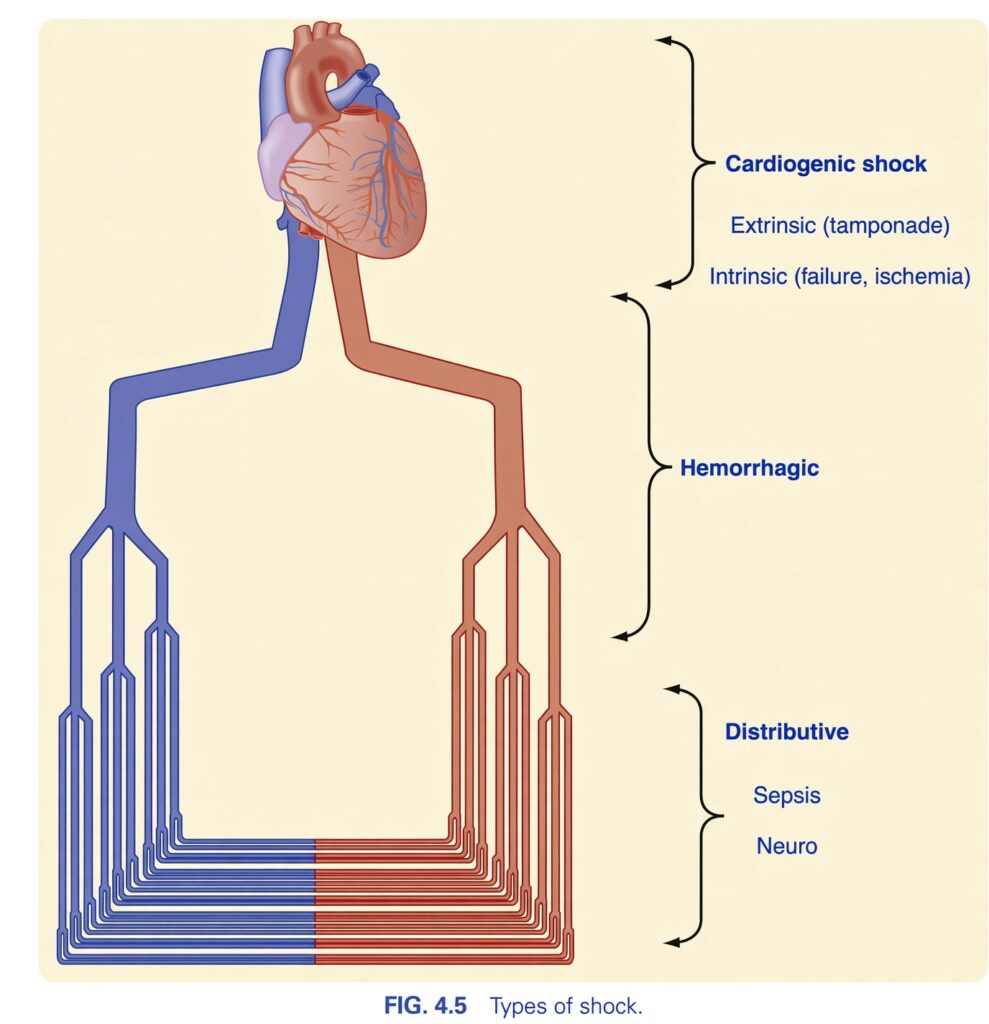
FIG. 4.5 — Types of Shock
🧠 First understand the big idea
Shock = the body’s tissues are not getting enough effective blood flow/oxygen.
This figure groups shock into 3 major types according to where the main problem occurs:
- Cardiogenic shock → problem with the heart
- Hemorrhagic shock → problem with blood volume
- Distributive shock → problem with distribution of blood
1. ❤️ Cardiogenic Shock
Simple idea:
The heart is unable to pump blood effectively.
Think of the heart as a water pump:
If the pump fails, blood cannot be pumped forward properly → shock.
The figure shows two causes:
A. Extrinsic — Tamponade
- Extrinsic means the problem is outside the heart itself.
- Tamponade puts pressure around the heart.
- The heart cannot fill/pump normally.
- → Cardiac output falls
- → Shock
B. Intrinsic — Failure, Ischemia
- Intrinsic means the problem is within the heart.
- Failure → the heart cannot pump effectively.
- Ischemia → inadequate blood supply to heart muscle → impaired pumping.
- → Cardiac output falls
- → Shock
🧠 Remember:
CARDIOgenic = CARDIO = HEART
Heart pump problem → Cardiogenic shock
2. 🩸 Hemorrhagic Shock
Simple idea:
Too much blood is lost.
Think of the circulation as a closed water-pipe system.
If a large amount of water leaks out:
Less fluid remains in the pipes → less flow reaches the tissues.
Similarly:
Bleeding → ↓ circulating blood volume → ↓ blood flow to tissues → shock
Key point from the figure:
The problem is mainly loss of blood from the circulation.
🧠 Remember:
Hemorrhage = blood loss → Hemorrhagic shock
3. 🔄 Distributive Shock
Simple idea:
The blood is present, but it is distributed abnormally.
Think of the circulation as a network of pipes supplying different areas.
If the blood vessels become abnormally dilated or the distribution becomes abnormal:
Blood does not reach the tissues effectively → shock.
The figure shows two causes:
A. Sepsis
- Sepsis → Distributive shock
B. Neuro
- Neuro → Distributive shock
So the figure groups both sepsis and neurogenic causes under distributive shock.
🧠 Remember:
Distributive = blood-flow distribution problem
🔥 THE WHOLE FIGURE IN ONE VIEW
| Type of shock | Main problem | Examples shown |
|---|---|---|
| ❤️ Cardiogenic | Heart cannot pump effectively | Extrinsic: tamponade; Intrinsic: failure, ischemia |
| 🩸 Hemorrhagic | Blood is lost | Hemorrhage |
| 🔄 Distributive | Blood is abnormally distributed | Sepsis, neuro |
🧠 EASIEST WAY TO MEMORIZE
3 questions:
1. Is the PUMP failing?
→ ❤️ Cardiogenic
2. Is the BLOOD missing?
→ 🩸 Hemorrhagic
3. Is the BLOOD DISTRIBUTION abnormal?
→ 🔄 Distributive
One-line memory:
Pump problem = Cardiogenic
Blood-loss problem = Hemorrhagic
Distribution problem = Distributive
🔍 Understanding the drawing itself
- The heart at the top represents the central pump.
- Red vessels represent the arterial side of circulation.
- Blue vessels represent the venous side.
- The vessels branch repeatedly to represent the circulation supplying tissues.
- The arrows/brackets on the right organize the causes into the three major shock categories.
- Cardiogenic shock is divided into:
- Extrinsic → tamponade
- Intrinsic → failure, ischemia
- Distributive shock is divided into:
- Sepsis
- Neuro
- Hemorrhagic shock is shown as its own major category.
🎯 Final exam concept
Shock can occur because the heart cannot pump, because blood has been lost, or because blood is distributed abnormally.
❤️ Pump → Cardiogenic | 🩸 Loss → Hemorrhagic | 🔄 Distribution → Distributive
Shock Index
- Heart rate and systolic blood pressure (SBP) alone are not very accurate for identifying hemorrhagic shock.
- The usual combination of fast heart rate + low SBP does not always occur together.
- Therefore, the Shock Index (SI) was developed to use both measurements together.
- SI = Heart rate ÷ Systolic BP
- SI is a better marker of shock severity than heart rate or BP alone.
- SI can be useful in:
- Trauma and hemorrhagic shock.
- Sepsis.
- Obstetric shock.
- Myocardial infarction.
- Stroke.
- Other acute illnesses.
- In trauma patients, SI is more useful than heart rate or BP alone.
- SI is also useful specifically in:
- Children.
- Older adults.
- SI has been associated with the need for:
- Blood transfusion.
- Invasive procedures.
- Operations.
- SI is therefore considered an indicator of hemodynamic stability.
- SI does not include diastolic BP.
- Therefore, the Modified Shock Index (MSI) was developed.
- MSI = Heart rate ÷ Mean arterial pressure (MAP)
- As MSI increases, it indicates:
- Low stroke volume.
- Low systemic vascular resistance.
- A hypodynamic circulation.
- In contrast, a low MSI indicates a hyperdynamic state.
- MSI may be better than SI for predicting mortality.
- SI and MSI are better than heart rate or SBP alone.
- However, combining these measurements with other patient information is likely to be even more useful.
- More complex calculations using multiple variables can predict outcomes better than using one vital sign.
- Important additional variables include:
- Age.
- Mechanism of injury.
- Glasgow Coma Scale (GCS) score.
- Lactate level.
- Hemoglobin level.
- Other physiologic measurements.
- Using several variables gives a statistically better prediction than using one vital sign alone.
- This makes sense because more patient information gives a better picture of the patient’s condition.
- An experienced surgeon can rapidly consider many factors within seconds, including:
- Gender.
- Age.
- GCS score.
- Mechanism of injury.
- Other clinical parameters.
- Although SI and MSI are statistically more accurate than individual measurements, they cannot replace an experienced clinician at the bedside.
- This may be why SI and MSI have not become widely used.
KEY CONCEPT
- Shock Index (SI) = Heart rate ÷ Systolic BP
- Uses heart rate + SBP together.
- Better than either measurement alone for assessing shock severity.
- Modified Shock Index (MSI) = Heart rate ÷ MAP
- Includes mean arterial pressure instead of SBP.
- High MSI → low stroke volume + low vascular resistance → hypodynamic circulation.
- Low MSI → hyperdynamic state.
- SI and MSI can help predict shock severity, need for intervention, and mortality, but an experienced clinician remains essential.
Conceptual Examples
- HR = 120/min, SBP = 100 mm Hg
→ SI = 120 ÷ 100 = 1.2. - HR = 120/min, SBP = 80 mm Hg
→ SI = 120 ÷ 80 = 1.5
→ Higher SI indicates greater hemodynamic instability. - High MSI → Think low stroke volume + low systemic vascular resistance → hypodynamic circulation.
- SI/MSI + age + GCS + mechanism of injury + lactate + hemoglobin
→ Gives a more complete prediction than using one vital sign alone.
Lactate and Base Deficit
- Lactate has long been used as a marker associated with injury and possibly ischemia.
- However, newer evidence questions why lactate increases and what it actually means.
- This newer information suggests that our understanding of lactate may still be incomplete.
- Lactate was traditionally considered a waste product of anaerobic metabolism.
- It was therefore thought to be completely harmful.
- New research suggests that lactate may actually have useful functions.
- An easy analogy is:
- Firefighters are associated with fires, but that does not mean firefighters are bad or caused the fire.
- Similarly, lactate may be associated with tissue stress without necessarily causing the problem.
- During exercise, lactate increases in:
- Muscles.
- Blood.
- Lactate reaches its highest level at or shortly after exhaustion.
- This helped create the idea that lactate was simply a waste product.
- Lactic acid also appears when muscles contract and continues to be produced when oxygen is absent.
- When tissues receive enough oxygen, accumulated lactate decreases.
- New evidence shows that lactate is an active metabolite.
- Lactate can move between:
- Cells.
- Tissues.
- Organs.
- Other tissues can use lactate as fuel.
- Lactate can also be converted back into:
- Pyruvate.
- Glucose.
- Increased lactate from lack of oxygen may therefore be less common than previously believed.
- Lactate may act as a shuttle for energy.
- This is called the lactate shuttle.
- The final product of glycolysis is pyruvic acid.
- Lack of oxygen was traditionally thought to convert pyruvate into lactate.
- Lactate formation may actually help carbohydrate metabolism continue through glycolysis.
- Lactate may move from the cell where it is produced to nearby cells and organs such as:
- Heart.
- Liver.
- Kidney.
- These tissues can then use lactate through oxidation and further metabolism.
- Lactate is also being studied as a pseudohormone.
- It may help regulate the cell’s redox state by:
- Changing between lactate and pyruvate.
- Affecting the NAD⁺/NADH ratio.
- Lactate enters the bloodstream.
- Other tissues and organs take it up.
- It can also affect the redox state of those cells.
- Lactate may help wound regeneration by promoting:
- Collagen deposition.
- New blood vessel formation.
- Lactate may also:
- Cause vasodilatation.
- Promote catecholamine release.
- Stimulate fat oxidation.
- Stimulate carbohydrate oxidation.
- Blood lactate levels depend on the balance between:
- Lactate production.
- Lactate removal.
- The liver is mainly responsible for removing lactate from the blood.
- Therefore, liver disease can change lactate levels.
- Lactate was traditionally thought to come mainly from tissues without oxygen.
- New evidence suggests that tissues with adequate oxygen can also produce lactate when they receive distress signals.
- In dog muscle, moderate exercise can increase lactate even when oxygen supply is adequate.
- A strong adrenergic stimulus can also increase lactate as the body prepares for or responds to stress.
- Studies of Mount Everest climbers showed that oxygen pressure at the summit was about 28 mm Hg at rest and fell even more during exercise.
- Despite this severe hypoxia, their blood lactate was almost the same as at sea level.
- These findings make us question the traditional understanding of lactate and its role.
- In humans, lactate may be a preferred fuel for the brain and heart.
- In these organs, infused lactate can be used before glucose:
- At rest.
- During exercise.
- Because lactate can spare glucose, it helps maintain glucose and glycogen stores.
- Lactate may also protect brain tissue during traumatic brain injury (TBI).
- It can also provide fuel for the brain during exercise.
- Therefore, whether lactate is a waste product or an energy source, an increased lactate level may indicate tissue distress.
- This distress may occur because of:
- Low oxygen.
- Other factors.
- During stress, epinephrine and other catecholamines are released.
- These hormones can also increase lactate release.
- Base deficit measures the amount of base needed to bring 1 liter of whole blood to a pH of 7.4.
- Base deficit generally correlates well with lactate, especially during the first 24 hours after injury or physiologic stress.
- In 1992, Rutherford showed that a base deficit of 8 was associated with about a 25% mortality rate in:
- Patients older than 55 years without head injury.
- Patients younger than 55 years with head injury.
- When base deficit remains high, clinicians generally consider this a sign of ongoing shock.
- One problem with base deficit is that it can be affected by chloride in resuscitation fluids.
- This can produce hyperchloremic nongap acidosis.
- In patients with renal failure, base deficit may also be a poor predictor of outcome.
- In acute renal failure, a base deficit less than 6 mmol/L has been associated with poor outcome.
- Hypertonic saline (HTS) contains about 3–8 times more sodium chloride than normal saline.
- The hyperchloremic acidosis caused by HTS has been shown to be relatively harmless.
- However, when HTS is used, base deficit should be interpreted carefully.
KEY CONCEPT
- Lactate is not simply a waste product.
- It can:
- Act as an energy fuel.
- Move between tissues through the lactate shuttle.
- Be converted to pyruvate or glucose.
- Increased lactate can indicate tissue distress, but it does not necessarily mean that anaerobic metabolism is the only cause.
- Blood lactate depends on production vs removal, with the liver being the main organ responsible for removal.
- Base deficit is another marker associated with shock and generally correlates with lactate.
- A persistently elevated base deficit can suggest ongoing shock, but resuscitation fluids and renal failure can affect its interpretation.
Conceptual Examples
- Exercise → lactate rises → This does not automatically mean lactate is harmful; lactate can also serve as fuel.
- Stress → epinephrine rises → lactate rises → Increased lactate may occur even when oxygen is available.
- Shock → persistent high lactate + high base deficit → Suggests ongoing tissue distress/shock.
- Hypertonic saline → chloride increases → base deficit changes → Interpret the base deficit with caution.
Compensatory Mechanisms
- When shock occurs, the body moves blood away from less important tissues toward more important tissues.
- The earliest response to decreased intravascular blood volume is increased sympathetic activity.
- This response is controlled by baroreceptors (pressure receptors) in:
- Aortic arch.
- Atria.
- Carotid bodies.
- When blood pressure decreases:
- Parasympathetic activity decreases.
- Norepinephrine and epinephrine are released.
- These activate adrenergic receptors in the heart muscle and blood vessel smooth muscle.
- As a result:
- Heart rate increases.
- Heart contractility increases.
- Peripheral vascular resistance increases.
- Blood pressure increases.
- Blood flow does not decrease equally in all tissues.
- Blood is redirected from less critical organs such as:
- Skin.
- Skeletal muscle.
- Splanchnic circulation.
- Blood is redirected toward more critical organs such as:
- Brain.
- Liver.
- Kidneys.
- When kidney blood flow decreases and blood vessels constrict, the juxtaglomerular apparatus releases renin.
- Renin starts the formation of angiotensin I.
- Angiotensin-converting enzyme (ACE) in the endothelial cells of pulmonary arteries converts angiotensin I into angiotensin II.
- Angiotensin II increases sympathetic activity at nerve endings.
- It also stimulates hormone release from the adrenal medulla.
- The adrenal medulla releases catecholamines:
- Epinephrine.
- Norepinephrine.
- Dopamine.
- These catecholamines are produced from:
- Phenylalanine.
- Tyrosine.
- They are called catecholamines because they contain a catechol group derived from tyrosine.
- Catecholamine release is thought to cause the increased blood glucose level seen in hemorrhagic shock.
- The exact importance of increased glucose in hemorrhagic shock is not fully understood.
- However, increased glucose does not appear to affect the outcome.
- Cortisol, released from the adrenal cortex, also plays an important role in maintaining fluid balance.
- The zona glomerulosa of the adrenal cortex produces aldosterone when stimulated by angiotensin II.
- Aldosterone is a mineralocorticoid that:
- Increases sodium reabsorption by the kidneys.
- Increases potassium excretion.
- Angiotensin II also directly increases sodium reabsorption in the renal tubules.
- Sodium is the main osmotic ion involved in regulating body water.
- When sodium is reabsorbed, water is also reabsorbed.
- This increases the amount of fluid inside blood vessels and helps expand intravascular volume during shock.
- However, hormone release is not unlimited.
- During prolonged shock, these hormonal reserves can eventually become exhausted.
- Regulation of intravascular fluid is also influenced by:
- Carotid baroreceptors.
- Atrial natriuretic peptides.
- Signals are sent to the supraoptic and paraventricular nuclei of the brain.
- Antidiuretic hormone (ADH) is then released from the pituitary.
- ADH causes the kidneys to retain free water.
- At the same time, fluid is recruited from:
- Extravascular spaces.
- Cellular spaces.
- As pressure inside the blood vessels decreases, water shifts into the intravascular space.
- At the capillary level, hydrostatic pressure also decreases.
- This occurs because the precapillary sphincters constrict more than the postcapillary sphincters.
KEY CONCEPT
- Shock → ↓ intravascular volume → body activates compensatory mechanisms to maintain BP and blood flow.
- Sympathetic response:
- ↑ Heart rate.
- ↑ Contractility.
- ↑ Peripheral vascular resistance.
- → Helps maintain BP.
- Blood redistribution:
- ↓ Flow to skin, skeletal muscle, and splanchnic circulation.
- → Preserves flow to brain, liver, and kidneys.
- RAAS:
- ↓ Renal blood flow → Renin → Angiotensin I → Angiotensin II → Aldosterone
- → ↑ Sodium retention → ↑ Water retention → ↑ Intravascular volume.
- ADH → Water retention by kidneys → Helps restore intravascular volume.
- These hormonal responses are limited and may become exhausted during prolonged shock.
Conceptual Examples
- Blood loss → ↓ BP → baroreceptors detect the fall → sympathetic activity increases → ↑ HR + ↑ contractility + vasoconstriction → BP is supported.
- Shock → blood redirected from skin and muscles → brain receives relatively greater blood flow.
- Shock → ↓ renal blood flow → renin → angiotensin II → aldosterone → sodium + water retention → intravascular volume increases.
- Shock → ADH release → kidney retains water → helps restore blood volume.
Lethal Triad
- The lethal triad consists of:
- Acidosis
- Hypothermia
- Coagulopathy
- This triad is common in patients who are bleeding or in shock and have undergone resuscitation.
- The basic understanding is that poor tissue perfusion causes acidosis because lactate is produced.
- During shock, cells are thought to receive inadequate nutrients.
- This causes a decrease in the body’s main energy-storage molecule, adenosine triphosphate (ATP).
- The body needs ATP production to maintain normal body temperature.
- Therefore, if ATP production becomes too low to maintain body temperature, the body temperature moves toward the surrounding temperature.
- For most patients, the surrounding temperature may be about 22°C (72°F), which is typical of hospitals.
- This leads to hypothermia.
- Hypothermia and acidosis then reduce the efficiency of enzymes.
- These enzymes work best at about:
- 37°C
- pH 7.4
- For surgeons, the major problem with hypothermia is that the coagulation cascade depends on enzymes.
- When hypothermia reduces enzyme function, coagulopathy becomes worse.
- Worsening coagulopathy can cause uncontrolled bleeding from:
- Injuries.
- Surgery itself.
- More bleeding then further strengthens the lethal triad.
- Therefore, a vicious circle develops: Bleeding → poor perfusion → acidosis → hypothermia → impaired coagulation → more bleeding
- The best way to break this “vicious circle of death” is to:
- Stop the bleeding.
- Stop the causes of hypothermia.
- In most common situations, hypothermia is not caused directly by ischemia.
- Instead, it is often caused by giving:
- Room-temperature fluids.
- Cold blood products.
KEY CONCEPT
- Lethal triad = Acidosis + Hypothermia + Coagulopathy
- Poor perfusion → acidosis
- Low ATP production → hypothermia
- Hypothermia + acidosis → reduced enzyme function
- Reduced coagulation enzyme function → coagulopathy → more bleeding
- More bleeding then continues the cycle.
- The most important way to break the cycle is to control bleeding and prevent/stop hypothermia.
Conceptual Examples
- Severe bleeding → poor tissue perfusion → acidosis → hypothermia → impaired coagulation → more bleeding.
- Cold fluid/blood given during resuscitation → hypothermia → impaired coagulation → bleeding becomes worse.
- Control bleeding + prevent hypothermia → break the lethal cycle.
Acidosis
- Bleeding causes many changes in the body.
- During resuscitation, the lethal triad of:
- Acidosis.
- Hypothermia.
- Coagulopathy.
is common in patients with severe bleeding.
- This is mainly due to two major factors:
- Decreased tissue perfusion → lactic acidosis + consumptive coagulopathy.
- Room-temperature fluids + large-volume fluid administration → worsening hypothermia + dilutional coagulopathy.
- Together, these changes can produce resuscitation injury.
- Some believe that acidosis is not always harmful because the body tolerates acidosis better than alkalosis.
- In an acidotic environment, oxygen is released from hemoglobin more easily.
- Laboratory studies that preserve tissues outside the body have found that cells can survive longer in an acidotic environment.
- Traditionally, correcting acidosis with sodium bicarbonate has been avoided because it treats the laboratory abnormality rather than the underlying cause.
- The main goal should be to treat the cause of acidosis.
- Treating pH alone has not shown benefit and may give a false feeling that the problem has been corrected.
- Rapid sodium bicarbonate administration may also worsen intracellular acidosis because the generated CO₂ can move into cells.
- The basic treatment for metabolic acidosis caused by shock is to treat the underlying shock.
- In surgical patients, this is usually related to:
- Blood loss.
- Ischemic tissue.
- However, some clinicians believe correcting pH can be useful.
- This is because the enzymes needed for blood clotting work best at an optimal:
- Temperature.
- pH.
- Coagulopathy can cause uncontrolled bleeding.
- Therefore, some clinicians recommend bicarbonate infusion in patients with severe, life-threatening situations.
- Sodium bicarbonate may also increase BP through an effect that is not directly related to correcting pH.
- Rapid bicarbonate infusion is often followed by an increase in BP in hypotensive patients.
- This increase is usually attributed to correction of acidosis.
- However, emergency sodium bicarbonate is commonly given as ampules.
- A 50-mL ampule contains 1 mEq/mL.
- Therefore: 50 mL × 1 mEq/mL = 50 mEq sodium bicarbonate
- This provides a very high sodium concentration, similar to giving a hypertonic sodium solution.
- The high sodium concentration rapidly pulls fluid into the blood vessels.
- According to the text, a 50-mL sodium bicarbonate bolus has a physiologic effect similar to approximately:
- 325 mL normal saline, or
- 385 mL lactated Ringer (LR).
- Therefore, bicarbonate can behave somewhat like giving a small amount of hypertonic saline (HTS).
- Sodium bicarbonate is rapidly converted into CO₂ in the liver.
- If minute ventilation is not increased, this extra CO₂ can cause respiratory acidosis.
- THAM (tromethamine; tris[hydroxymethyl] aminomethane) is a biologically inactive amino alcohol with low toxicity.
- It buffers CO₂ and acids.
- THAM contains no sodium.
- It also produces less CO₂ during the buffering process.
- At 37°C, THAM has a pKa of 7.8.
- Therefore, within the normal blood pH range, it is a more effective buffer than sodium bicarbonate.
- In the body, THAM:
- Supports the blood bicarbonate buffering system.
- Generates sodium bicarbonate.
- Decreases the partial pressure of CO₂.
- THAM rapidly spreads through the extracellular space.
- It enters the intracellular space more slowly, except in:
- Red blood cells.
- Liver cells.
- It is eliminated by the kidneys.
- Unlike sodium bicarbonate, THAM does not require an open system to remove CO₂ in order to work.
- Therefore, THAM can work in a closed or partially closed system.
- THAM also maintains its buffering ability during hypothermia.
- THAM acetate (0.3 M, pH 8.6) is well tolerated.
- It does not cause significant tissue or venous irritation.
- It is the only available THAM formulation in the United States.
- THAM can cause:
- Respiratory depression.
- Hypoglycemia.
- These problems may require:
- Ventilatory support.
- Glucose administration.
- The initial THAM acetate dose can be estimated using: THAM (mL of 0.3-M solution) = Lean body weight (kg) × Base deficit (mmol/L)
- Easy calculation example from the formula:
- If lean body weight = 70 kg
- And base deficit = 10 mmol/L
- THAM dose = 70 × 10 = 700 mL of 0.3-M solution
- The maximum daily dose in an adult is 15 mmol/kg/day.
- For a 70-kg patient, this equals about 3.5 L of 0.3-M solution.
- THAM is used in:
- Respiratory failure, including ARDS and infant respiratory distress syndrome.
- Conditions involving hypothermia and permissive hypercapnia.
- Diabetic acidosis.
- Renal acidosis.
- Salicylate poisoning.
- Barbiturate poisoning.
- Increased intracranial pressure associated with brain trauma.
- It is also used in:
- Cardioplegic solutions.
- Liver transplantation.
- Despite these potential advantages, clinical evidence has not shown THAM to be more effective than sodium bicarbonate.
KEY CONCEPT
- Bleeding → ↓ tissue perfusion → lactic acidosis + coagulopathy.
- Large amounts of room-temperature fluids → hypothermia + dilutional coagulopathy.
- Therefore, severe bleeding can produce the lethal triad: acidosis + hypothermia + coagulopathy.
- The main treatment is to correct the cause of shock, especially blood loss and ischemic tissue.
- Sodium bicarbonate can correct acidosis but may increase CO₂, potentially worsening intracellular or respiratory acidosis.
- THAM buffers acids without adding sodium and produces less CO₂, but it has not been proven clinically superior to sodium bicarbonate.
Conceptual Examples
- Severe bleeding → poor perfusion → lactate ↑ → acidosis → coagulation worsens → bleeding continues.
- Large-volume room-temperature fluids → hypothermia → clotting enzymes work less effectively → coagulopathy worsens.
- 50 mL sodium bicarbonate × 1 mEq/mL = 50 mEq → high sodium concentration can rapidly draw fluid into the vascular space.
- 70-kg patient + base deficit 10 mmol/L → THAM = 70 × 10 = 700 mL of 0.3-M solution.
Hypothermia
- Hypothermia can be either beneficial or harmful.
- Understanding hypothermia is very important when caring for surgical patients.
- The beneficial effects mainly occur because hypothermia decreases metabolism.
- For example, icing an injury site causes:
- Vasoconstriction.
- Decreased metabolism.
- Less inflammation.
- Cooling tissues to slow metabolism is also used to reduce ischemia during:
- Cardiac surgery.
- Transplant surgery.
- Pediatric surgery.
- Neurologic surgery.
- Amputated limbs are also iced before reimplantation.
- Patients who nearly drown in cold water have higher survival rates because cooling helps preserve the brain and other vital organs.
- The Advanced Life Support Task Force of the International Liaison Committee of Resuscitation recommends cooling unconscious adults with spontaneous circulation after out-of-hospital cardiac arrest caused by ventricular fibrillation to 32–34°C for 12–24 hours.
- Induced hypothermia is different from spontaneous hypothermia.
- Spontaneous hypothermia usually occurs because of:
- Shock.
- Inadequate tissue perfusion.
- Infusion of cold fluids.
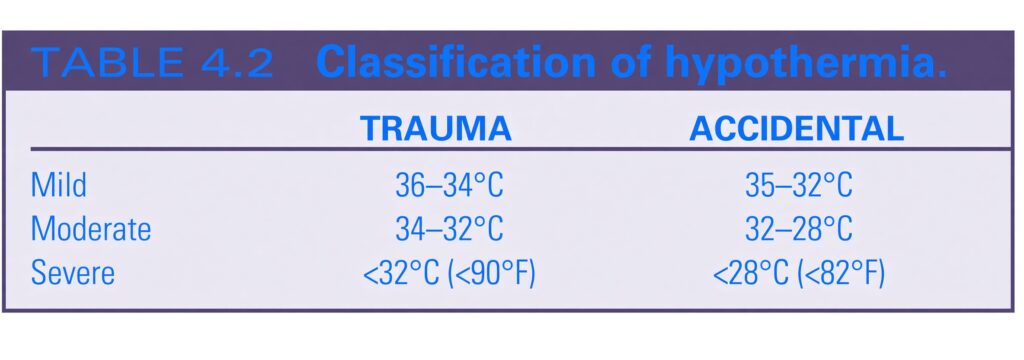
- Medical/accidental hypothermia is different from trauma-associated hypothermia (Table 4.2).
- Survival after accidental hypothermia is about 12%–39%.
- The average body temperature falls to about 30°C, with a reported range of 13.7–35.0°C.
- The lowest recorded temperature in a survivor of accidental hypothermia was 13.7°C (56.7°F) in an extreme skier in Norway who was trapped under ice and later recovered neurologically.
- Trauma-associated hypothermia has different outcomes.
- In trauma patients, survival decreases markedly as core temperature falls.
- The text reports 100% mortality at 32°C, whether this temperature occurs in the emergency department, operating room, or ICU.
- In trauma, hypothermia is related to shock and may worsen uncontrolled bleeding because of coagulopathy.
- A postoperative core temperature below 35°C is associated with a fourfold increase in death.
- Below 33°C, the increase in death is sevenfold.
- Hypothermic trauma patients tend to:
- Have more severe injuries.
- Be older.
- Have greater blood loss.
- Require more transfusions.
- However, National Trauma Data Base research found that hypothermia and poor outcome were not necessarily related to shock.
- Previously, a core temperature below 32°C was thought to be uniformly fatal in trauma patients.
- Some trauma patients have now survived despite recorded temperatures below 32°C.
- Hypothermia has been associated with:
- More severe injuries.
- More bleeding.
- Higher rates of multiple-organ dysfunction in the ICU.
- In multivariable analysis, however, hypothermia itself was not associated with death.
- Humans are homeothermic (warm-blooded) animals, unlike poikilothermic (cold-blooded) animals such as snakes and fish.
- The hypothalamus uses several mechanisms to maintain the core temperature around 37°C.
- Oxygen is the main fuel used by mitochondria to produce ATP and heat.
- When ATP production falls below its minimum level, body temperature can fall toward the surrounding temperature.
- During exercise, increased oxygen use produces more ATP and excess heat.
- The body then uses sweating and evaporation to help control its temperature.
- Although hypothermia can sometimes be beneficial, it is harmful in trauma mainly because it causes coagulopathy.
- Cold impairs coagulation by:
- Decreasing enzyme activity.
- Increasing fibrinolytic activity.
- Causing platelet dysfunction.
- Platelet aggregation decreases because cold inhibits thromboxane B2 production.
- A heparin-like substance may also be released, producing a syndrome similar to disseminated intravascular coagulation.
- Hageman factor and thromboplastin are among the enzymes most affected.
- Even a small decrease in core temperature can make some enzymes 40% less efficient.
- Temperature strongly affects coagulation testing.
- When blood is taken from a cold patient and sent to the laboratory, the sample is warmed to 37°C.
- Even a 1–2°C decrease can delay clotting and make laboratory results inaccurate.
- Therefore, the laboratory coagulation profile shows what the coagulopathy would be if the patient were warmed to 37°C.
- A cold patient may therefore be more coagulopathic than the laboratory result suggests.
- A normal coagulation profile does not necessarily mean that coagulation is normal inside the patient’s body.
- Heat is measured in calories.
- 1 calorie is the energy needed to raise the temperature of 1 mL of water by 1°C.
- 1 kcal raises the temperature of 1 L of water by 1°C.
- If a 75-kg man were made entirely of water, 75 kcal would raise his temperature by 1°C.
- Because the human body is not pure water and has a specific heat coefficient of 0.83, the actual requirement is: 75 kg × 0.83 = 62.25 kcal
- Therefore, about 62.25 kcal are required to raise this 75-kg person’s temperature by 1°C.
- Losing 62.25 kcal would lower the body temperature by approximately 1°C.
- This helps compare different methods used to retain or restore body heat.
- Normal basal metabolic heat production is about 70 kcal/hour.
- Shivering can increase heat production to about 250 kcal/hour.
- Heat moves between the body and surroundings through:
- Conduction — direct contact.
- Convection — movement through air.
- Radiation.
- Evaporation.
- Convection is very inefficient because air molecules are far apart compared with molecules in liquids and solids.
- Conduction and radiation are the most efficient methods.
- Radiation is difficult to apply consistently in clinical practice.
- Therefore, conduction is the most practical efficient method for transferring heat.
- Changing the temperature of IV fluids can warm or cool the patient through conduction.
- The FDA allows IV fluid warmers to reach a maximum of 40°C.
- For a trauma patient at 34°C, the temperature difference from 40°C fluid is only: 40 − 34 = 6°C
- Therefore, 1 L of warmed fluid transfers about 6 kcal to the patient.
- About 62 kcal are needed to raise core temperature by 1°C.
- Therefore: 62 ÷ 6 ≈ 10.4 L
- So about 10.4 L of warmed fluid would be needed to raise a patient from 34°C to 35°C.
- Once the patient reaches 35°C, the temperature difference becomes: 40 − 35 = 5°C
- Therefore, about 12.5 L of warmed fluid is needed to raise the patient from 35°C to 36°C.
- A 75-kg patient at 32°C needs: 75 × 0.83 × 5 = 311.25 kcal
- Therefore, about 311 kcal are needed to warm this patient from 32°C to 37°C.
- IV fluid should be given as rapidly as possible because slow infusion allows the fluid to cool toward room temperature while traveling through the IV line.
- Devices that warm the fluid up to the point where it enters the body can prevent this cooling.
- Warming patients with warmed IV fluids is difficult, but fluid warmers remain important.
- Their main purpose is often to prevent further cooling, rather than to warm the patient significantly.
- Cold fluids can cool patients rapidly.
- Common infused fluids may be:
- 22°C at room temperature.
- 4°C when refrigerated.
- PRBCs are stored at approximately 4°C.
- About 5 L of 22°C fluid or 2 L of cold blood products can lower a patient’s temperature by about 1°C.
- Therefore, the main reason for warming fluids is to prevent additional cooling during resuscitation.
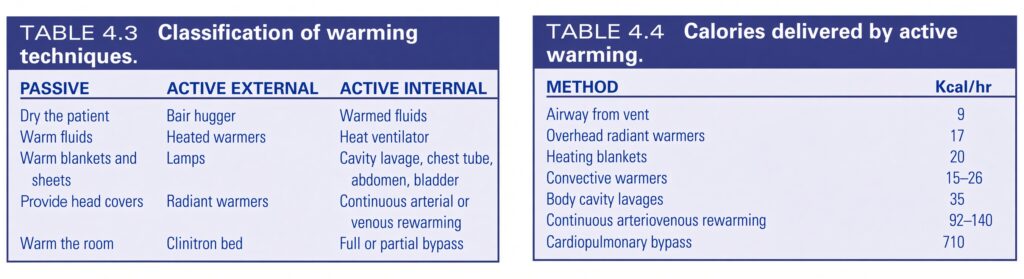
- Rewarming methods are classified as passive or active.
- Active warming is further divided into external or internal (Table 4.3).
- Passive warming means preventing further heat loss.
- Examples include:
- Drying the patient to reduce evaporative heat loss.
- Giving warm fluids to prevent further cooling.
- Covering the patient.
- Covering the head can greatly reduce heat loss.
- Aluminum-lined head covers are preferred because they reflect heat normally lost through the scalp.
- Warming the room reduces the temperature difference between the patient and environment, but a 37°C humidified operating room is usually impractical for surgical staff.
- Closing an open chest or abdomen also reduces evaporative heat loss.
- The most important way to prevent heat loss is to control the bleeding and treat hemorrhagic shock.
- Once shock is corrected, normal metabolism can generate heat from the body’s core.
- This is an especially important principle.
- Active warming means transferring calories into the patient, either through the skin or internally.
- Skin and fat normally prevent heat transfer.
- Fat insulates against heat loss, but this also makes transfer of heat through the skin difficult.
- Therefore, active external warming is less efficient than internal warming.
- Before any active rewarming method, remove wet clothing or bedding and dry the patient.
- Without drying, the efficiency of all warming methods decreases greatly.
- Forced-air warming is an active external method.
- Because air is an inefficient method of transferring heat, it provides relatively few calories.
- Forced air mainly increases the surrounding temperature.
- If the patient is wet with blood, fluids, clothing, or sweat, it can initially increase evaporation and actually cool the patient.
- Warming the skin may feel comfortable, but it can reduce shivering, which is an efficient internal heat-producing mechanism.
- Forced-air warming provides only about 10 kcal/hour.
- External warming is more efficient when heating pads transfer heat through conduction.
- Some beds can warm patients faster using heated air-fluidized beads, although such beds are more suitable for the ICU than the operating room.
- Heated-water heating pads can also transfer heat through countercurrent heat exchange.
- These can be placed under the patient during surgery and can help prevent mild hypothermia.
- The amount of heat transferred depends on the degree of skin-vessel dilation or constriction.
- The same countercurrent system can also be used to cool the patient when necessary.
- The most effective method of warming is to deliver calories internally (Table 4.4).
- Warming ventilator air is technically internal active warming, but it is inefficient because heat is mainly transferred by convection.
- Although the lungs have a large surface area, the heat transferred through warmed humidified air is small compared with conduction-based methods.
- Another method is to wash warmed fluids into body cavities using:
- Nasogastric tubes.
- Foley catheters.
- Chest tubes.
- Peritoneal lavage.
- For gastric lavage, warmed fluid can continuously enter through the sump port while being removed through the main tube.
- Devices that warm the hand through conduction are promising but are not yet widely available.
- ECMO can actively rewarm a patient and also help treat shock.
- In ECMO, blood is pumped through an artificial lung and then returned to the bloodstream.
- It can support a failing pulmonary or cardiac system.
- The blood can be oxygenated and warmed before being returned to the patient.
- Case reports and cost-effectiveness studies suggest that ECMO may also be useful for rewarming patients after accidental hypothermia.
- Cardiopulmonary bypass can also warm the patient by delivering heated blood at more than 5 L/min to tissues containing capillaries.
- If full cardiopulmonary bypass is unavailable or not desired, alternatives include continuous venous or arterial rewarming.
- Venovenous rewarming can also be performed using the roller pump of a dialysis machine.
- A prospective study found arterial-venous rewarming to be highly effective:
- About 39 minutes to reach 37°C.
- Compared with about 3.2 hours with standard methods.
- Special arterial warming catheters can be placed in the femoral artery with another line in the opposite femoral vein.
- Arterial pressure drives blood through a fluid warmer and back into the vein.
- The effectiveness of this method depends greatly on the patient’s BP because blood flow depends directly on BP.
- Some central venous catheters can directly warm blood through a countercurrent exchange system.
- In recent decades, changes in resuscitation methods have decreased the incidence of hypothermia.
- Dilutional coagulopathy has also become less common because:
- Crystalloid volumes have been reduced.
- Resuscitation fluids and blood are carefully warmed before infusion.
KEY CONCEPT
- Hypothermia = ↓ metabolism, which can sometimes protect tissues from ischemia, but in trauma it mainly causes coagulopathy.
- Cold → ↓ clotting-enzyme activity + platelet dysfunction + ↑ fibrinolysis → more bleeding.
- Cold patient + cold fluids → further heat loss, so warming fluids is mainly important to prevent additional cooling.
- Best passive warming: prevent heat loss + control bleeding.
- Best active warming: deliver heat internally, especially through efficient conduction-based methods.
- ECMO/cardiopulmonary bypass can provide both circulatory support and rapid internal warming.
Conceptual Examples
- Trauma + bleeding → shock → ↓ ATP production → ↓ body temperature → coagulopathy → more bleeding.
- 34°C patient + 40°C fluid → only 6°C temperature difference, so warmed fluids provide limited heat.
- 75-kg patient: 75 × 0.83 = 62.25 kcal needed for each 1°C rise.
- Cold patient: the priority is not simply “give warm fluid”; first stop heat loss and control the bleeding.
Coagulopathy
- Coagulopathy in surgical patients has multiple causes.
- Besides acidosis and hypothermia, another major cause is a decrease in clotting factors.
- Clotting factors can decrease because of:
- Consumption → used up while the body tries to stop bleeding.
- Dilution → diluted by infused fluids that do not contain clotting factors.
- Genetic causes → for example, hemophilia.
- Coagulopathy often needs to be corrected.
- Common tests include:
- Prothrombin time (PT)
- Partial thromboplastin time (PTT)
- International normalized ratio (INR)
- However, these tests may not accurately detect coagulopathy in surgical patients.
- One major reason is that coagulopathy is dynamic and can change through different stages:
- Hypocoagulability
- Hypercoagulability
- Fibrinolysis
- Traditional tests cannot show this changing process because they provide only a snapshot of coagulation at one moment.
- They are also performed at normal pH and temperature, so they do not show the effects of acidosis and hypothermia on coagulation.
- They are performed using serum rather than whole blood, so they cannot properly measure the interaction between clotting factors and platelets.
- Thromboelastography (TEG) and rotational thromboelastometry are newer dynamic tests.
- They provide a more sensitive and accurate assessment of coagulation changes in surgical patients.
- Both mainly assess clot strength, the final result of the coagulation process.
- Because they use whole blood, they also assess the functional interaction between clotting factors and platelets.
- Important TEG parameters include:
- R-time = reaction time.
- α-angle = alpha angle.
- MA = maximum amplitude.
- R-time shows how long it takes before fibrin formation begins.
- Increased R-time may indicate:
- Reduced clotting-factor activity.
- Deficiency of clotting factors.
- Decreased R-time indicates a hypercoagulable state.
- The α-angle shows how quickly fibrin forms and cross-links.
- A steeper α-angle → faster fibrin formation.
- A flatter α-angle → slower fibrin formation.
- MA measures clot strength or elasticity.
- MA reflects the strength of interaction between:
- Coagulation factors.
- Fibrin.
- Platelets.
- Defects in any of these can cause a decreased MA.
- TEG can also assess fibrinolysis.
- LY30 and LY60 measure the decrease in clot strength after 30 and 60 minutes, respectively.
- A large lysis index indicates rapid fibrinolysis.
- This can help guide the use of antifibrinolytic treatment.
- Antifibrinolytic therapy has been shown to reduce mortality when used within 3 hours of injury in these patients.
- TEG components can help guide treatment because they show the surgeon which part of the clotting process is defective.
- TEG and thromboelastometry are routinely used in cardiac surgery and are increasingly used in trauma and liver transplantation as point-of-care tests.
- However, they are not widely available in most hospitals (Fig. 4.7).
- Methods for defining and treating coagulopathy are still variable.
- The most important step is to stop the lethal triad and therefore break the vicious cycle of bleeding.
- Prothrombin complex concentrate (PCC) is increasingly used to treat surgical coagulopathy.
- PCC contains several clotting factors:
- Factor II
- Factor VII
- Factor IX
- Factor X
- Depending on the PCC product, it may also contain varying amounts of factor VIIa.
- In patients taking warfarin, PCC is the recommended treatment because it replaces the clotting factors reduced by warfarin.
- This is particularly useful in elderly patients with TBI when FFP could cause problems because of cardiac disease and volume overload.
- PCC also reverses coagulopathy faster than fresh frozen plasma (FFP).
- Blood-component therapy remains very important in treating coagulopathy.
- PCC has shown promising results in trauma patients at risk of bleeding, but the studies were not randomized and need further confirmation.
- An ideal drug would stop or reduce bleeding, treat coagulopathy cheaply, and cause no serious complications.
- Current drugs are expensive, and their adverse effects are not yet completely understood.
- Another way to treat coagulopathy is to modify the fibrinolytic pathway.
- Tranexamic acid (TXA) is a synthetic form related to the amino acid lysine.
- TXA is an antifibrinolytic drug.
- It competitively prevents activation of plasminogen → plasmin.
- This prevents breakdown of fibrin, the protein framework of a blood clot.
- TXA has about 8 times the antifibrinolytic activity of the older drug ε-aminocaproic acid.
- TXA is used to treat or prevent excessive bleeding during:
- Cardiac surgery.
- Liver surgery.
- Vascular surgery.
- Orthopedic surgery.
- Topical TXA appears effective and safe after total knee and hip replacement surgery.
- It also reduces bleeding and the need for blood transfusion in mucosal oropharyngeal bleeding in thrombocytopenic patients.
- Similar results have been reported in children undergoing craniofacial and spinal surgery.
- TXA is also used for heavy menstrual bleeding as an oral tablet and in dentistry as a 5% mouthwash.
- It has also been recommended for trauma.
- TXA appears to reduce rebleeding in spontaneous intracranial bleeding.
- A small randomized study of 238 patients showed less progression of intracranial bleeding after trauma, but the reduction was not statistically significant because the study was small.
- TXA is used to treat primary fibrinolysis, which is important in the development of acute traumatic coagulopathy.
- The CRASH-2 trial included 20,211 patients in a multicenter randomized controlled civilian study.
- TXA reduced overall mortality compared with placebo:
- TXA: 14.5%
- Placebo: 16.0%
- Death caused by bleeding was also reduced:
- TXA: 4.9%
- Placebo: 5.7%
- CRASH-2 suggested that TXA becomes less effective and may even be harmful when treatment is delayed more than 3 hours after admission.
- This finding was supported by the MATTER study.
- The result was rapidly incorporated into military guidelines and later into civilian practice worldwide.
- The PED-TRAX study found that among children treated at a military hospital in Afghanistan, TXA was independently associated with:
- Lower mortality.
- Better neurologic outcomes.
- Better pulmonary outcomes.
- TXA was given to 66 of 766 children in that study.
- Critics of CRASH-2 note that it was performed in 270 hospitals across 40 countries.
- They argue that the very large sample size could produce a beta 1 error, meaning statistical significance may occur because of the large number of patients even when the actual clinical difference is small.
- The absolute risk reduction was about 1.5%.
- The estimated number needed to treat (NNT) was 68.
- The CRASH-3 trial is being conducted to assess the effect of TXA on death or disability in patients with TBI.
- The important issues are:
- Dose
- Timing
- Patient selection
- TXA is attractive because it is inexpensive, about $5.70 per dose, easy to use, and appears to have relatively few side effects.
KEY CONCEPT
- Coagulopathy = clotting problem with multiple causes.
- Major causes:
- Consumption
- Dilution
- Acidosis
- Hypothermia
- Genetic factors
- PT/PTT/INR give only a snapshot.
- TEG gives a more dynamic picture:
- R-time ↑ → clotting-factor problem.
- α-angle ↓ → slow fibrin formation.
- MA ↓ → weak clot due to clotting-factor/fibrin/platelet problems.
- LY30/LY60 ↑ → increased fibrinolysis.
- PCC → replaces several clotting factors and rapidly reverses warfarin-associated coagulopathy.
- TXA → inhibits plasmin formation → prevents fibrin breakdown → reduces bleeding, with greatest benefit when given early.
Conceptual Examples
- Bleeding → clotting factors consumed + fluids dilute them → coagulopathy → more bleeding.
- Cold + acidotic patient → clotting enzymes work poorly → coagulopathy worsens.
- High R-time → think delayed clot initiation.
- Low MA → think weak clot.
- High LY30 → think rapid clot breakdown → fibrinolysis.
- Early TXA after major bleeding → less fibrin breakdown → less bleeding.
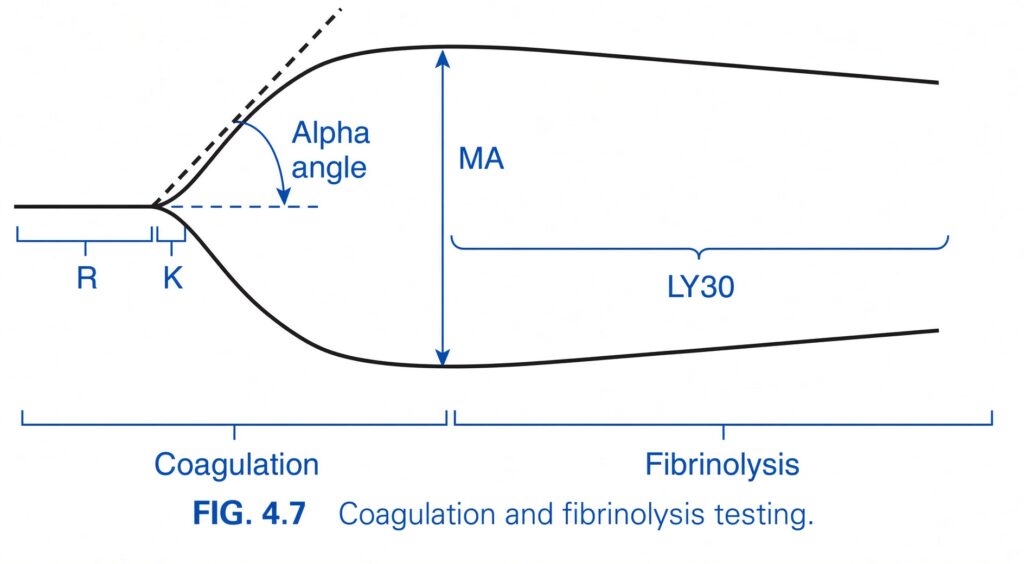
FIG. 4.7 — Coagulation and Fibrinolysis Testing
🧠 What is this graph showing?
This figure is basically a movie of what happens to a blood clot over time:
Blood starts liquid → clot begins → clot becomes stronger → clot reaches maximum strength → clot is gradually broken down.
The test shown is a thromboelastography (TEG)-type tracing, which assesses both:
- Coagulation (clot formation)
- Fibrinolysis (clot breakdown)
1. 🩸 COAGULATION — LEFT SIDE
The left portion shows how quickly and strongly the clot forms.
R = Reaction time
R is the time from the beginning of the test until initial clot formation starts.
WITH DR SHEEN
Imagine waiting for glue to start becoming sticky.
R = “How long does it take before clotting starts?”
If R is prolonged:
- Clotting is taking too long.
- This may indicate coagulation-factor deficiency or anticoagulant effect.
2. 🧱 K = Clot Formation Time
After clotting starts, the clot needs to become stronger.
K represents the time needed for the clot to develop from its initial formation to a defined level of clot strength.
SUPERFAST
R = When does the clot START?
K = How quickly does the clot BECOME STRONG?
So:
R → clot starts
K → clot strengthens
3. 📐 Alpha Angle
The alpha angle represents the speed of clot formation and strengthening.
Look carefully at the graph:
- The tracing begins to rise after clot formation starts.
- The steeper the rise, the faster the clot is becoming stronger.
- The alpha angle is measured between the horizontal baseline and the rising clot-formation line.
SUPERFAST
Imagine building a wall:
- Small angle / shallow slope → wall is being built slowly.
- Large angle / steep slope → wall is being built quickly.
Therefore:
Alpha angle = How FAST the clot builds up.
Important relationship:
Larger alpha angle → faster clot formation
Smaller alpha angle → slower clot formation
4. 📈 MA = Maximum Amplitude
Now look at the point where the tracing reaches its maximum width.
This is labeled:
MA = Maximum Amplitude
It represents the maximum strength of the clot.
SUPERFAST
Think of the clot as a rope.
MA tells you how strong the rope has become at its strongest point.
Therefore:
MA = Maximum clot strength
Clot strength is influenced mainly by the interaction of fibrin and platelets.
5. 🔄 FIBRINOLYSIS — RIGHT SIDE
Once the clot reaches its maximum strength, the body does not want the clot to remain forever.
The body begins to break down the clot.
This process is called:
Fibrinolysis
The graph therefore starts to become narrower after reaching MA.
SUPERFAST
Think of making a snowball:
Make snowball → snowball becomes strongest → snowball starts melting
Similarly:
Clot forms → clot becomes strongest → clot starts breaking down
6. ⏱️ LY30
The figure labels LY30 on the fibrinolysis portion.
LY30 = Lysis at 30 minutes
It assesses how much the clot has broken down 30 minutes after reaching maximum clot strength.
DR SHEEN
Imagine your clot reaches its strongest point at MA.
Then you wait 30 minutes.
You ask:
“How much of my clot has disappeared during those 30 minutes?”
That is what LY30 assesses.
Therefore:
MA = strongest point of clot
LY30 = amount of clot breakdown 30 minutes later
🧠 NOW FOLLOW THE GRAPH FROM LEFT → RIGHT
The easiest way to understand the entire figure is as a story:
1. R
🕐 Waiting for clotting to start
↓
2. K
🧱 Clot starts forming and becomes stronger
↓
3. Alpha angle
📐 How rapidly the clot is becoming strong
↓
4. MA
💪 Clot reaches maximum strength
↓
5. LY30
🧹 Clot is being broken down by fibrinolysis
🔑 THE MOST IMPORTANT DIFFERENCES
| Parameter | Simple meaning | Think |
|---|---|---|
| R | Time until clotting begins | START |
| K | Time for clot to gain strength | BUILD |
| Alpha angle | Speed of clot strengthening | SPEED |
| MA | Maximum clot strength | STRENGTH |
| LY30 | Clot breakdown after 30 min | BREAKDOWN |
📊 What the SHAPE of the graph means
Before R
The tracing is essentially flat.
➡️ No significant clot formation yet.
At R
The tracing begins to separate from the baseline.
➡️ Clot formation has started.
Between R and MA
The two sides of the tracing move farther apart.
➡️ The clot is becoming stronger.
Alpha angle
The steepness of this expansion tells us:
➡️ How rapidly the clot is forming.
At MA
The tracing reaches its greatest amplitude.
➡️ Maximum clot strength.
After MA
The tracing gradually moves inward.
➡️ The clot is being broken down.
At LY30
We assess the degree of clot breakdown 30 minutes after maximum amplitude.
🎯 ONE-LINE MEMORY TRICK
R → K → α → MA → LY30
START → BUILD → SPEED → STRENGTH → BREAKDOWN
Or remember:
R = When does it start?
K = How long to build?
α = How fast does it build?
MA = How strong does it get?
LY30 = How much does it break down?
⭐ Final conceptual picture
LIQUID BLOOD
     ↓
  R = clot STARTS
     ↓
  K = clot BUILDS
     ↓
α angle = speed of BUILDING
     ↓
MA = clot is STRONGEST
     ↓
FIBRINOLYSIS
     ↓
LY30 = clot BREAKDOWN after 30 min
🧠 The whole figure in one sentence:
TEG follows a clot from the moment it starts forming (R), through its strengthening (K and alpha angle), to its maximum strength (MA), and finally measures its breakdown by fibrinolysis (LY30).
Oxygen Delivery
- Shock = inadequate tissue perfusion, but it is often incorrectly simplified as inadequate tissue oxygenation.
- Much of the knowledge about oxygen delivery and oxygen consumption came from physiologist Archibald V. Hill.
- Hill was a runner who measured oxygen consumption in four runners running around an 88-m grass track (Fig. 4.8).
- During this work, he defined:
- Maximum O₂ intake
- O₂ requirement
- O₂ debt
- He is also known for his work with Otto Meyerhof, who explained the difference between aerobic and anaerobic metabolism.
- They received the Nobel Prize in 1922.
- Blood carries oxygen mainly through red blood cells containing hemoglobin.
- The basic formula for oxygen delivery (DO₂) is: DO₂ = CO × CaO₂
- In simple words:
- Oxygen delivery = Cardiac output × Oxygen content of arterial blood.
- Each gram of hemoglobin carries about 1.34 mL of oxygen, depending on arterial oxygen saturation (SaO₂).
- A small amount of oxygen is also dissolved directly in plasma.
- Dissolved oxygen is calculated as: 0.003 × PaO₂
- Therefore, arterial oxygen content (CaO₂) is: CaO₂ = (1.34 × Hgb × SaO₂) + (0.003 × PaO₂)
- In simple words:
- Hemoglobin-bound oxygen = 1.34 × Hgb × SaO₂
- Dissolved oxygen = 0.003 × PaO₂
- Total arterial oxygen = hemoglobin-bound oxygen + dissolved oxygen.
- Hemoglobin is measured in g/dL.
- Cardiac output (CO) is: CO = Heart rate × Stroke volume
- Normally, stroke volume can increase by shifting blood from less important tissue beds toward the central circulation.
- However, most changes in cardiac output are caused by an increase in heart rate.
- During hemorrhage and resuscitation, fluid infusion affects stroke volume.
- When blood volume decreases, stroke volume eventually decreases.
- The body compensates by increasing heart rate.
- Cells consume oxygen, and oxygen consumption (VO₂) can be calculated from the difference between arterial and venous oxygen content: VO₂ = CO × (CaO₂ − CvO₂)
- In simple words:
- Oxygen consumption = Cardiac output × (arterial oxygen content − venous oxygen content).
- After simplifying and converting units: VO₂ = CO × 1.34 × Hgb × (SaO₂ − SvO₂)
- In simple words:
- Oxygen consumption depends mainly on:
- Cardiac output.
- Hemoglobin concentration.
- Difference between arterial and venous oxygen saturation.
- Oxygen consumption depends mainly on:
- The usual method for measuring venous oxygen content is taking blood from the most distal port of a pulmonary artery catheter.
- The pulmonary artery is used because venous blood from different parts of the body is mixed there.
- Oxygen content in the inferior vena cava is usually higher than in the superior vena cava.
- Oxygen content in the superior vena cava is higher than in the coronary sinus.
- Average mixed venous blood is about 75% saturated.
- Therefore, oxygen consumption is considered to be approximately 25% of oxygen delivered (Fig. 4.9).
- This means that, normally, the body has a considerable reserve of delivered oxygen.
- Newer catheters can continuously measure venous oxygen saturation in the pulmonary artery.
- They use technology similar to a pulse oximeter.
- They use near-infrared (NIR) light to measure hemoglobin oxygen saturation.
- These catheters can also continuously measure cardiac output.
- Previously, cardiac output was estimated by measuring changes in temperature inside the heart.
- A known amount of iced or room-temperature water was injected through the proximal port of a pulmonary artery catheter.
- The temperature change was then measured at the distal end.
- In recent years, pulmonary artery catheters have become much less commonly used.
- Venous oxygenation can still be measured through central lines, but these measurements are not truly mixed venous measurements.
- Cardiac output and oxygen delivery are also influenced by the left ventricular end-diastolic volume.
- According to Starling’s principle, described in 1915, cardiac output increases as ventricular muscle fibers become longer.
- There is a maximum filling point.
- Beyond this point, further filling does not increase cardiac output (Fig. 4.10).
- Left ventricular end-diastolic volume can be estimated using a pulmonary artery catheter by measuring wedge pressure.
- Wedge pressure represents preload.
- It reflects left ventricular pressure because there are no valves between the pulmonary artery and the left ventricle.
- Other methods can also help assess and optimize left ventricular filling.
- Pulmonary artery catheters can measure right ventricular end-diastolic volume, but they are rarely used for this purpose.
- Echocardiography, through transthoracic or esophageal probes, can directly estimate cardiac filling volumes.
- However, differences in heart size and volume can affect the measurements.
- Medical conditions that stress and enlarge the heart can also change heart size.
- Therefore, interpreting heart size and deciding whether resuscitation is adequate can be subjective.
KEY CONCEPT
- Oxygen delivery (DO₂) depends on two major things: DO₂ = CO × CaO₂ → Cardiac output × arterial oxygen content
- CaO₂ mainly depends on hemoglobin: CaO₂ = (1.34 × Hgb × SaO₂) + (0.003 × PaO₂) → Most oxygen is carried by hemoglobin; only a small amount is dissolved in plasma.
- Cardiac output: CO = Heart rate × Stroke volume
- Oxygen consumption: VO₂ = CO × (CaO₂ − CvO₂) → Oxygen consumed by tissues = oxygen entering tissues − oxygen remaining in venous blood.
- Normal mixed venous blood is about 75% saturated, so approximately 25% of delivered oxygen is consumed.
Conceptual Examples
- Hemorrhage → ↓ blood volume → ↓ stroke volume → ↑ heart rate → attempt to maintain cardiac output.
- Low hemoglobin → less oxygen carried per unit of blood → ↓ arterial oxygen content → ↓ oxygen delivery.
- Low cardiac output → less blood reaches tissues → ↓ oxygen delivery even if oxygen saturation is normal.
- Normal oxygen delivery but increased tissue extraction → venous oxygen saturation falls.
- Too little or too much ventricular filling is not equally useful: cardiac output increases with filling only up to the maximum filling point.
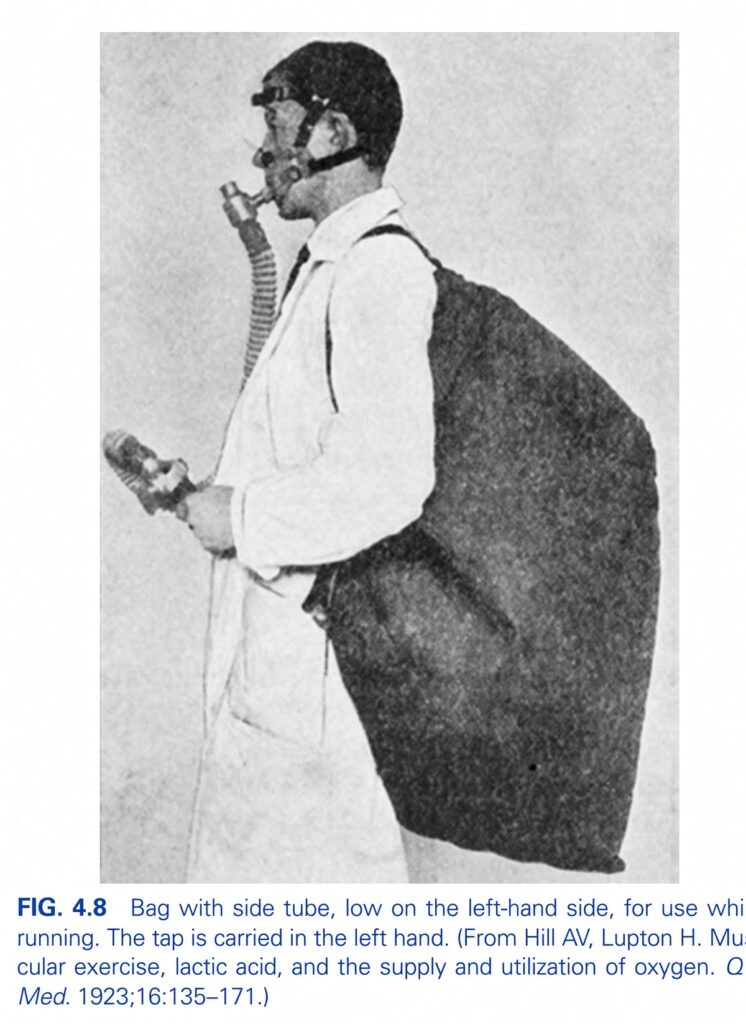
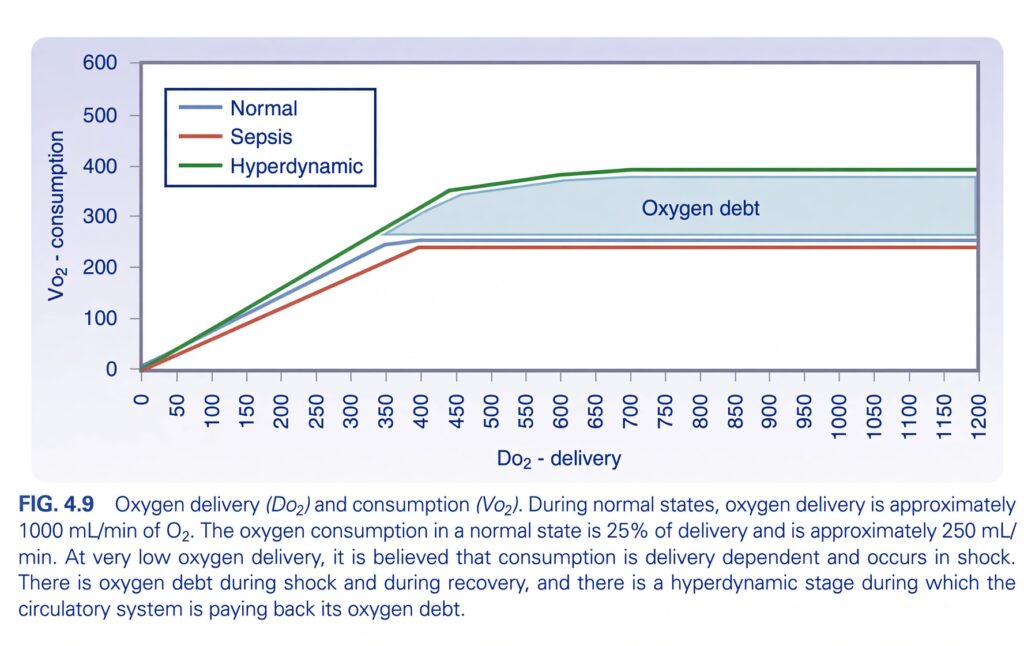
FIG. 4.9 — Oxygen Delivery (DO₂) and Oxygen Consumption (VO₂)
🧠 First understand the BIG IDEA
This graph answers one simple question:
When the body receives different amounts of oxygen, how much oxygen does it actually use?
Think of DO₂ as oxygen delivered to the body and VO₂ as oxygen actually used by the tissues.
Very simple analogy 🚚
Imagine a truck delivering oxygen packages:
- DO₂ = packages delivered
- VO₂ = packages actually used
- At first, if you deliver more packages, the tissues can use more.
- But eventually, the tissues are using as much as they need.
- Giving them even more oxygen does not normally increase consumption.
1. Understand the AXES first
X-axis = DO₂ — Oxygen delivery
It goes from:
0 → 1200 mL/min
So moving right means:
More oxygen is being delivered to the tissues.
Y-axis = VO₂ — Oxygen consumption
It goes from:
0 → 600 mL/min
So moving up means:
The tissues are consuming more oxygen.
2. 🔵 BLUE LINE = NORMAL
This is the most important line to understand first.
From 0 → about 300–400 DO₂
The blue line rises.
That means:
As oxygen delivery increases, oxygen consumption also increases.
SUPERFAST
Imagine giving a child food:
- Give very little → child eats very little.
- Give more → child can eat more.
Similarly:
More DO₂ → more VO₂
This is the oxygen supply-dependent region.
Then the blue line becomes FLAT
At approximately:
DO₂ ≈ 400 mL/min and above
the blue line becomes almost horizontal at:
VO₂ ≈ 250 mL/min
This means:
The tissues have enough oxygen and are already consuming approximately what they need.
So even if you increase oxygen delivery:
DO₂ ↑↑
the oxygen consumption stays approximately:
VO₂ ≈ 250 mL/min
🧠 Key concept:
Once oxygen delivery is sufficient, oxygen consumption becomes independent of oxygen delivery.
3. 🔴 RED LINE = SEPSIS
Now look at the red line.
It rises initially, just like the normal line.
But notice:
The red line reaches its plateau LOWER than normal.
It levels off at approximately:
VO₂ ≈ 240–250 mL/min
while the normal line is around:
VO₂ ≈ 250 mL/min
The important conceptual point is not the tiny numerical difference in the drawing.
The important idea is:
Sepsis can alter the relationship between oxygen delivery and oxygen utilization.
In the figure, the sepsis curve represents an abnormal oxygen-utilization state.
4. 🟢 GREEN LINE = HYPERDYNAMIC
Now look at the green line.
It rises higher than the normal line.
It eventually reaches approximately:
VO₂ ≈ 390–400 mL/min
What does this mean?
During the hyperdynamic stage, oxygen consumption is increased.
Think:
The body is working harder and has increased metabolic activity.
So:
Hyperdynamic state → ↑ oxygen consumption
5. ⭐ THE MOST IMPORTANT PART: THE SHADED AREA
This is the part you specifically asked about.
The blue-gray shaded area is labeled:
Oxygen debt
What is oxygen debt?
During shock, the tissues may not receive enough oxygen.
So they cannot obtain all the oxygen they need through normal aerobic metabolism.
The body therefore develops an oxygen deficit/debt.
🧠 : Think of a battery 🔋
Imagine your tissues normally need:
250 units of oxygen
But during shock, only enough oxygen is being delivered to allow them to use:
150 units
So there is a shortage:
250 − 150 = 100 units
That missing amount represents an oxygen debt.
The body has effectively been forced to function with insufficient oxygen.
6. WHERE EXACTLY IS THE SHADED AREA?
Look carefully at the graph.
The shaded region is mainly between:
🔵 Normal oxygen consumption line
and
🟢 Hyperdynamic/recovery oxygen consumption line
during the period after oxygen delivery has been restored.
This represents the extra oxygen consumption required during recovery to repay the oxygen deficit accumulated during shock.
7. 🔥 Why does the graph call it “Oxygen debt”?
During shock:
Oxygen delivery ↓ → tissues cannot meet their normal oxygen requirements → oxygen debt develops.
After circulation improves:
Oxygen delivery ↑ → the body enters a hyperdynamic state → oxygen consumption ↑ → the body “pays back” the oxygen debt.
That is why the textbook says:
“the circulatory system is paying back its oxygen debt.”
8. FOLLOW THE GRAPH AS A STORY
This is the easiest way to understand the entire graph.
🟢 STEP 1 — Normal state
Oxygen delivery is approximately:
DO₂ ≈ 1000 mL/min
Normal oxygen consumption is approximately:
VO₂ ≈ 250 mL/min
So normally:
The body receives much more oxygen than it actually consumes.
The tissues have an oxygen reserve.
🔴 STEP 2 — Shock
During shock:
DO₂ ↓
because tissue oxygen delivery becomes inadequate.
Initially, the body can compensate by extracting more oxygen from the blood.
Therefore:
As DO₂ falls, the tissues can initially maintain oxygen consumption.
But eventually:
A critical point is reached.
Below this point:
Oxygen delivery becomes too low to support normal oxygen consumption.
Then:
DO₂ ↓ → VO₂ ↓
This is the dangerous part.
🟠 STEP 3 — Oxygen debt develops
Because the tissues cannot obtain enough oxygen:
Oxygen requirement > oxygen supplied
Therefore:
Oxygen debt accumulates.
This is represented conceptually by the deficit between what the tissues need and what they can actually consume.
🟢 STEP 4 — Recovery / Hyperdynamic stage
Once circulation is restored:
DO₂ ↑
But something interesting happens.
The body temporarily consumes more oxygen than normal.
That’s the:
Hyperdynamic stage
The green line rises toward approximately:
VO₂ ≈ 400 mL/min
instead of the normal approximately:
VO₂ ≈ 250 mL/min
Why?
The body is recovering from the previous oxygen deficit and is using extra oxygen to support recovery processes.
Therefore:
Hyperdynamic state = increased oxygen consumption during recovery.
📌 VERY IMPORTANT: Why is the green line ABOVE the blue line?
🔵 Normal:
VO₂ ≈ 250 mL/min
🟢 Hyperdynamic:
VO₂ ≈ 400 mL/min
So:
Hyperdynamic VO₂ > Normal VO₂
This higher oxygen consumption represents the body’s increased oxygen requirement during recovery.
🧠 NOW UNDERSTAND EVERY PART OF THE GRAPH
| Graph feature | Meaning |
|---|---|
| X-axis (DO₂) | Oxygen delivered to tissues |
| Y-axis (VO₂) | Oxygen consumed by tissues |
| 🔵 Blue line | Normal relationship |
| 🔴 Red line | Sepsis |
| 🟢 Green line | Hyperdynamic recovery |
| Rising portion | VO₂ is dependent on DO₂ |
| Flat portion | Adequate oxygen delivery; VO₂ becomes relatively independent of DO₂ |
| Shaded area | Oxygen debt / repayment concept during recovery |
| Green area above normal | Increased oxygen consumption during hyperdynamic recovery |
⭐ ONE EXTREMELY IMPORTANT CONCEPT
Oxygen delivery and consumption are NOT always the same.
Normally:
DO₂ ≈ 1000 mL/min
but:
VO₂ ≈ 250 mL/min
So the body receives approximately 4 times more oxygen than it consumes.
Therefore:
DO₂ is the supply.
VO₂ is the actual use.
🔥 THE GRAPH IN ONE SIMPLE STORY
NORMAL
DO₂ is adequate
        ↓
Tissues consume ≈ 250 mL O₂/min
        ↓
────────────────────────────

SHOCK
DO₂ falls
        ↓
Initially tissues extract more O₂
        ↓
Critical low DO₂ reached
        ↓
VO₂ starts falling
        ↓
OXYGEN DEBT develops
        ↓
────────────────────────────

RECOVERY
DO₂ is restored
        ↓
Hyperdynamic stage
        ↓
VO₂ temporarily rises above normal
        ↓
Extra O₂ is used
        ↓
OXYGEN DEBT IS REPAID
🎯SUPERFAST FINAL MEMORY
Think of DO₂ = oxygen supply and VO₂ = oxygen use.
Normal:
🫁 Plenty of oxygen delivered → tissues use about 250 mL/min
Shock:
⬇️ Oxygen delivery → tissues eventually cannot maintain normal consumption → oxygen debt develops
Recovery:
⬆️ Oxygen delivery → body temporarily becomes hyperdynamic → oxygen consumption increases → oxygen debt is repaid
The single best sentence to remember:
Shock creates an oxygen debt because oxygen delivery becomes inadequate; during recovery, the hyperdynamic circulation increases oxygen consumption to help repay that debt.
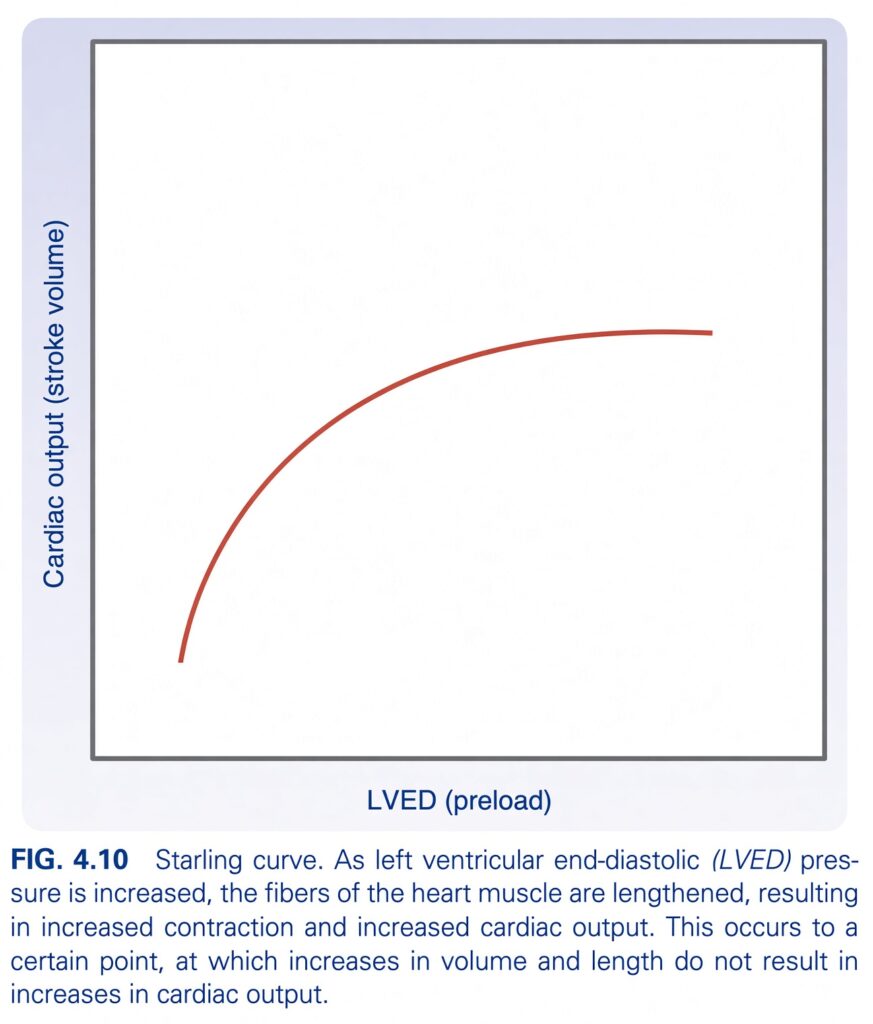
FIG. 4.10 — Starling Curve
The main idea
This graph shows the relationship between:
LVED (preload) → Cardiac output (stroke volume)
In simple terms:
More blood filling the left ventricle → the heart muscle stretches → the heart contracts more strongly → more blood is pumped out.
This is the Frank-Starling mechanism.
1. X-axis — LVED (Preload)
LVED = Left ventricular end-diastolic volume
This means:
How much blood is inside the left ventricle just before it contracts.
So, moving to the right means:
More blood enters the left ventricle → more ventricular filling → increased preload.
Think of it like a spring:
- Less stretching → weaker recoil
- More stretching → stronger recoil
The heart behaves similarly within a normal range.
2. Y-axis — Cardiac output (Stroke volume)
The vertical axis represents how much blood the heart pumps with each contraction.
Stroke volume = amount of blood pumped out by the ventricle with one heartbeat.
So, moving upward means:
More blood is being pumped out with each beat.
3. ❤️ Why does the curve rise?
Look at the rising portion of the curve.
As LVED/preload increases:
↑ LV filling
↓
↑ Stretch of cardiac muscle fibers
↓
↑ Force of contraction
↓
↑ Stroke volume / cardiac output
Therefore:
More filling → stronger contraction → more blood pumped out.
4. Why does the curve eventually become FLAT?
This is the most important part of the graph.
At first, increasing preload produces a large increase in cardiac output.
But eventually, the curve begins to flatten.
This means:
The heart has reached a point where additional filling does not produce a significant additional increase in cardiac output.
In other words:
More preload → more output
⬇️
Up to a certain point
⬇️
More preload → little or no additional output
5. Understand the SHAPE of the curve
Lower-left portion 📈
The curve is relatively steep.
A small increase in preload causes a significant increase in cardiac output.
↑ Preload → ↑↑ Cardiac output
Upper portion ➡️
The curve becomes flatter.
Increasing preload further produces little additional increase in output.
↑ Preload → little further ↑ in output
6. What exactly does the textbook sentence mean?
The caption says:
As left ventricular end-diastolic pressure (LVED) increases, the fibers of the heart muscle are lengthened.
Meaning:
More blood fills the ventricle.
↓
The ventricular muscle fibers are stretched.
This results in increased contraction and increased cardiac output.
Meaning:
The appropriately stretched heart muscle contracts more strongly.
↓
More blood is pumped out.
This occurs to a certain point.
Meaning:
There is a limit to how much increasing preload can improve cardiac output.
At a certain point, increases in volume and length do not result in increases in cardiac output.
Meaning:
Once the curve reaches the flatter region:
More filling ≠ significantly more pumping.low the curve from LEFT → RIGHT
LESS PRELOAD
     ↓
Less ventricular filling
     ↓
Less muscle fiber stretch
     ↓
Less force of contraction
     ↓
Lower stroke volume

        ↓

MORE PRELOAD
     ↓
More ventricular filling
     ↓
More muscle fiber stretch
     ↓
Stronger contraction
     ↓
Higher stroke volume

        ↓

TOO MUCH / BEYOND THE EFFECTIVE RANGE
     ↓
Further filling gives little additional benefit
     ↓
Curve becomes flat
⭐ The easiest way to remember the graph
Preload = filling
Frank-Starling principle:
The more the ventricle fills, the more strongly it contracts — up to a limit.
🔑 Every part of the graph
| Part | Meaning |
|---|---|
| X-axis | LVED/preload → ventricular filling |
| Y-axis | Cardiac output/stroke volume → blood pumped per beat |
| Rising curve | ↑ Preload → ↑ cardiac output |
| Steep portion | Small increase in preload produces a significant increase in output |
| Flattening portion | Further preload produces little additional increase in output |
| Top/plateau | Effective limit of the Frank-Starling response |
🎯 One-line concept
More blood enters the left ventricle → the heart muscle stretches → it contracts more strongly → stroke volume increases, but only up to a certain limit.
Optimization (Supernormalization)
- In the late 1980s, surgical critical care became a specialty, with major focus on ventilator support and improving oxygen delivery to tissues.
- William Shoemaker, a pioneer of modern surgical critical care, proposed that shock causes inadequate oxygen delivery, leading to anaerobic metabolism and an oxygen debt that must be repaid.
- He found that after giving fluids, increasing oxygen delivery also increased oxygen consumption—until a point where further oxygen delivery no longer increased consumption.
- This increased oxygen consumption was thought to represent repayment of the oxygen debt caused by body-wide ischemia.
- Patients in shock were found to have a hyperdynamic phase, where increased oxygen delivery caused increased oxygen consumption.
- The assumption was that this increased consumption was repaying the oxygen debt.
- Shoemaker popularized optimization or supernormalization of oxygen delivery.
- This meant increasing oxygen delivery as much as possible until oxygen consumption stopped increasing and reached a plateau (flow independence).
- The optimization process involved giving a rapid fluid bolus and confirming that it increased wedge pressure.
- Because the response to fluids changes quickly, the infusion had to be given over a short period, such as 20 minutes.
- If it took longer, changes in the vascular space and heart could be caused by factors other than the fluid.
- The response also had to be measured immediately because the effect of infused fluid decreases quickly as fluid leaves the vascular space.
- Wedge pressure and cardiac output were measured shortly before fluid infusion to determine whether the fluid was effective.
- If cardiac output increased when wedge pressure increased, oxygen delivery was assumed to have increased.
- By measuring central venous oxygen content along with cardiac output, clinicians could determine whether oxygen consumption also increased.
- This process was originally repeated until another fluid bolus no longer increased cardiac output.
- The goal was to move oxygen delivery from the delivery-dependent part of the curve to the delivery-independent part (Fig. 4.9).
- LR solution was preferred during optimization because it was inexpensive and considered harmless.
- Once the Starling curve was optimized, further increases in wedge pressure no longer increased left ventricular end-diastolic volume.
- Therefore, wedge pressure was kept at that maximum level.
- Further increasing wedge pressure without increasing LVED volume could cause unnecessary pulmonary edema.
- After fluids had maximized cardiac output and oxygen delivery, an inotropic drug was added to increase cardiac output further.
- The drug recommended at that time was dobutamine.
- Its dose was increased while its effect on cardiac output was measured.
- With each step, oxygen consumption was measured and cardiac output was “optimized” to meet oxygen-consumption demands.
- The aim was to maximize oxygen delivery so that all tissues received enough oxygen.
- Shoemaker’s earlier clinical trials showed fewer cases of multiple-organ dysfunction syndrome (MODS) and death with this approach.
- At that time, ARDS and MODS were major causes of late death in trauma patients.
- Later clinical studies could not reproduce Shoemaker’s success.
- Randomized prospective trials showed that optimizing oxygen delivery and consumption did not improve outcomes.
- Patients who responded to optimization generally did well, but patients whose oxygen delivery could not be increased had poor outcomes.
- Therefore, response to optimization predicted outcome, but the optimization process itself did not seem to improve outcome.
- One possible reason for the success of the earlier studies was that their control patients were not adequately resuscitated.
- When later studies adequately resuscitated patients, optimization did not improve outcomes.
- Aggressive fluid administration to achieve supranormal oxygen delivery could actually increase:
- Multiple-organ failure
- Abdominal compartment syndrome
- Mortality from excessive crystalloid administration.
- Over time, pulmonary artery catheters became much less commonly used.
- Studies showed that stopping their use did not worsen outcomes.
- Because pulmonary artery catheters are invasive and their data could be misinterpreted, they have almost disappeared from modern surgical ICUs except in cardiac surgery.
- In hyperdynamic patients, oxygen delivery could not be increased to a point where oxygen consumption clearly reached a plateau.
- One theory was that pushing the heart harder during supernormalization increased the heart’s own metabolism, making the heart the major organ using the extra oxygen.
- The harder the heart worked to deliver oxygen, the more oxygen it needed.
- Normal cardiac output in an average man is about 5 L/min.
- During optimization, patients were sometimes driven to 15 L/min or more for days.
- Critics argued that there was a point where oxygen consumption was flow-dependent, but the relationship between consumption and delivery made it appear that increasing delivery caused the increase in consumption.
- They also argued that the body was usually already on the flat portion of the oxygen-consumption curve.
- Oxygen delivery was rarely at a critically low level where the body was consuming almost everything delivered.
- Therefore, optimization usually resulted in patients receiving very large amounts of fluid.
- The hyperdynamic response and MODS might have resulted from these excessive fluids, which could cause an inflammatory response.
- The concept of oxygen debt, introduced by Archibald Hill almost 100 years earlier, may have important weaknesses.
- Hill’s original work on aerobic and anaerobic metabolism involved only four patients, but the concept continued to be used for a century.
- Modern exercise physiology shows that oxygen debt is repaid over a short period, not over several days.
- In contrast, the optimization model suggested that oxygen debt could continue for long periods.
- During massive hemorrhage, some tissues may theoretically become ischemic.
- However, during acute hemorrhage, even when BP falls to 40 mm Hg, cardiac output and oxygen delivery are usually reduced by only about 50%.
- Before resuscitation with cell-free fluids, hemoglobin does not fall significantly.
- Therefore, oxygen delivery is reduced by only about half, while the body still has a large oxygen reserve because cells normally consume only about 25% of delivered oxygen.
- Whether ongoing anaerobic metabolism actually occurs in this situation is therefore questionable.
- Theoretically, oxygen delivery would have to fall to about 25% of baseline before reaching the anaerobic threshold.
- If fluids are used for resuscitation without blood, hemoglobin may theoretically fall by 50%, while cardiac output is generally restored to its original level.
- Again, oxygen delivery is reduced by about half, but enough oxygen is still delivered to potentially avoid ongoing anaerobic metabolism.
- It is difficult to reduce both cardiac output and hemoglobin enough to reduce oxygen delivery by 75%, below the theoretical anaerobic threshold.
- In hypovolemic shock, it was thought that regional hypoxia could continue even when overall oxygen delivery was adequate.
- Different organs and tissues do not have the same oxygen requirements or consumption.
- Critical organs may experience hypoxia, even though their blood flow is usually preserved, while less-essential organs receive less oxygen.
- However, these patients are usually not actively exercising, so their oxygen demand is low.
- Therefore, the theory of prolonged oxygen debt is questioned.
- Even during exercise, if oxygen debt occurs, it is repaid quickly rather than over several days.
- One previous method for increasing oxygen delivery was to increase hemoglobin.
- Increasing hemoglobin from 8.0 to 10 g/dL by transfusing two units of blood would increase oxygen delivery by about 25%.
- Blood transfusions were included in optimization because they also increased wedge pressure, LVED volume, and cardiac output.
- However, it was rarely recognized that transfusions placed patients on the flat portion of the oxygen-consumption curve (Fig. 4.9).
- In the past, clinicians were concerned that increasing hematocrit would increase blood viscosity and reduce capillary flow.
- Studies in the 1950s showed better capillary flow with diluted blood.
- However, the reduction in flow caused by increased viscosity was only a few percentage points.
- This was much smaller than the approximately 25% increase in oxygen delivery produced by transfusing a couple of units of packed red blood cells.
- Therefore, if the goal were simply to increase oxygen delivery, calculations suggested that blood transfusion would be the most efficient method.
- Modern exercise physiology studies show that professional athletes can perform better when their hemoglobin levels are above normal.
- Athletes who blood dope by autologous blood transfusion or by using red-cell production enhancers such as erythropoietin or testosterone are now banned for illegal performance enhancement.
- Such athletes can have cardiac outputs greater than 20–50 L/min.
- They do not appear to develop problems from blood “sludging” despite higher blood flow and greater blood viscosity.
- However, injured patients are different because their capillaries may not be adequately dilated and may already be blocked by white and red blood cells.
KEY CONCEPT
- Supernormalization = deliberately increasing oxygen delivery above normal until oxygen consumption reaches a plateau.
- Shoemaker’s theory:
- Shock → ↓ oxygen delivery → anaerobic metabolism → oxygen debt
- Fluids ± dobutamine → ↑ cardiac output → ↑ oxygen delivery → ↑ oxygen consumption
- Continue until oxygen consumption no longer increases.
- Later studies showed that supernormalization itself did not improve outcomes.
- Excessive fluids used to achieve very high oxygen delivery could instead cause:
- MODS
- Abdominal compartment syndrome
- Increased mortality
- The major conceptual problem was that the body is usually already on the flat part of the oxygen-consumption curve, so giving more oxygen does not necessarily make tissues consume more.
- The concept of prolonged oxygen debt was also questioned because modern evidence suggests oxygen debt is normally repaid relatively quickly.
Conceptual Examples
- 5 L/min CO → normal cardiac output in an average man.
- Pushing CO to 15 L/min does not necessarily improve tissue oxygen use and may overload the patient.
- Hb 8 → 10 g/dL with blood transfusion → approximately 25% ↑ oxygen delivery, according to the source.
- If oxygen delivery increases but oxygen consumption does not increase, the patient is on the flow-independent/flat portion of the curve.
- More fluid ≠ automatically more useful oxygen delivery; excessive fluid can itself cause harm.
Global Perfusion Versus Regional Perfusion
- Measuring blood pressure (BP) was a major advance.
- However, because the vascular system must deliver nutrients to cells and remove waste products, clinicians continue to ask whether BP or blood flow is more important.
- During sepsis, systemic vascular resistance is low, suggesting a problem somewhere in the body’s autoregulatory system.
- Another possible explanation is that the body may have evolved to lower systemic vascular resistance so that cardiac output can increase more easily because afterload is reduced.
- Some blood shunting may occur at the capillary level.
- An important question is whether BP should be increased with pressor drugs if doing so reduces capillary blood flow.
- Very high doses of pressor drugs may worsen blood flow because lactate levels increase when the dose is too high.
- The increased lactate may result from:
- A stress response, because catecholamines can increase lactate.
- Reduced blood flow at the capillary level.
- Some clinicians prefer a lower BP as long as blood flow remains adequate.
- However, some organs may depend more on pressure.
- The brain and kidneys have traditionally been considered pressure-dependent organs.
- Early experiments had difficulty separating the effects of pressure from flow because these two factors are closely related.
- As the idea that flow may be more important than pressure developed, technology was created to measure nutrient flow rather than pressure.
- During hemorrhage or hypovolemia, blood is redirected toward:
- Brain
- Liver
- Heart
- Kidneys
- This occurs at the expense of:
- Skin
- Muscle
- Gut
- Researchers therefore began studying the consequences of this blood-shunting process.
- The gastrointestinal (GI) tract became an important focus.
- Two major methods were developed:
- Gastric tonometry
- NIR technology
- Gastric tonometry assesses blood flow to the GI tract using a CO₂-permeable balloon filled with saline placed inside the stomach after suppressing gastric acid.
- The balloon remains against the stomach mucosa for 30 minutes.
- During this time, CO₂ from the gastric mucosa passes into the balloon and reaches equilibrium.
- The saline and gas are then removed from the balloon, and the partial pressure of CO₂ is measured.
- This value, together with arterial HCO₃⁻, is used in the Henderson-Hasselbalch equation to calculate gastric mucosal pH.
- The gastric mucosal pH is then used to estimate whether blood flow to the splanchnic circulation is adequate.
- Gastric tonometry has important practical difficulties.
- Although it could help predict survival, improving the measured value through resuscitation did not improve survival.
- Therefore, most clinicians have abandoned gastric tonometry.
- A multicenter study found that gastric tonometry predicted outcome in septic shock, but using it as a resuscitation target was no better than using the cardiac index.
- Regional measurements were thought to be better monitoring tools than global pressure-based measurements.
- However, evidence consistently suggests that initial resuscitation of critically ill patients with shock does not require regional monitoring.
- After stabilization, regional measurements are mainly predictors of outcome, rather than targets that should necessarily be treated.
- An ideal resuscitation-monitoring device should be:
- Noninvasive
- Simple
- Cheap
- Portable
- NIR spectroscopy uses the near-infrared part of the electromagnetic spectrum, approximately 800–2500 nm.
- NIR technology has many applications, including physics, astronomy, chemistry, pharmaceuticals, medical diagnosis, and food and agricultural quality control.
- Its major advantage is that NIR light can penetrate skin and bone.
- This is why a hand looks red when placed over a flashlight: most visible light is absorbed or reflected, while red and infrared light can pass through skin and bone relatively easily.
- A common medical device using related NIR technology is the pulse oximeter.
- Using slightly different light wavelengths, this technology has also been related to the status of cytochrome aa3 by adding a third light wave around 800 nm.
- When oxygen supply is inadequate, electron transport decreases and oxidative phosphorylation decreases, eventually leading to anaerobic metabolism.
- NIR optical devices can assess the redox state of copper atoms in cytochrome aa3 and can study intracellular oxidative processes without entering the body.
- Therefore, NIR technology can potentially assess tissue metabolic activity and determine whether tissue is being adequately perfused.
- Animal studies of hemorrhagic shock showed changes in regional tissue beds with NIR technology (Fig. 4.11).
- Animal and human studies have shown NIR results to be better than conventional shock measurements.
- A multicenter prospective study tested whether NIR could identify patients at risk of hemorrhagic shock and its complications.
- The study involved 383 severely injured patients with hypotension who required blood transfusions at seven level I trauma centers.
- A pulse-oximeter-like probe was placed on the thenar muscle of the hand and continuously measured NIR values.
- NIR was found to be as sensitive as base deficit for predicting death and MODS in hypotensive trauma patients.
- The receiver operating characteristic curves suggested that NIR might also be somewhat better than BP for predicting outcome.
- Most importantly, its negative predictive value was 90% (Fig. 4.12).
- The noninvasive, continuous NIR probe could therefore demonstrate perfusion status.
- However, only 50 patients developed MODS in that study.
- This may have been because trauma resuscitation methods were changing during the study period, reducing MODS and death.
- These changes were related to damage-control resuscitation.
- NIR technology may help identify when a patient is in shock or when the patient is doing well.
- It may also reliably detect or rule out occult hypoperfusion.
- In trauma, a noninvasive method that continuously follows regional oxygenation, base deficit, or BP trends could have an important role.
- However, the important question is whether this technology will actually change treatment.
- Once hypoperfusion is identified by BP, NIR, or another device, clinicians still need to decide what to do with that information.
- It is uncertain whether oxygen delivery should be increased to poorly oxygenated regional tissues.
- Previous studies showed that optimizing global oxygen delivery was not useful.
- Regional monitoring with gastric tonometry also failed to improve outcomes.
- Therefore, it remains uncertain whether NIR will be helpful or potentially harmful.
- One possible harm is over-resuscitation simply to correct an abnormal measurement that may not be clinically important.
- The best endpoint for resuscitation remains debated.
- Because NIR results correlate well with base deficit, NIR might eventually be used to indirectly estimate base deficit.
- NIR technology may also have other useful surgical applications, including:
- Direct monitoring of blood flow and tissue oxygenation in high-risk patients
- Organ transplantation
- Free-flap perfusion
- Classification of burn injuries
- Intraoperative assessment of bowel ischemia
- Compartment syndrome
- Subdural and epidural hematomas
- Its most useful application may ultimately be in the ICU for septic shock patients at risk of multiple-organ failure.
KEY CONCEPT
- Global perfusion = looking at the circulation of the body as a whole, such as BP and cardiac output.
- Regional perfusion = looking at blood flow and oxygenation in individual tissues or organs.
- During shock:
- Blood is redirected toward brain, heart, liver, and kidneys.
- Blood flow is reduced to skin, muscle, and gut.
- BP may be normal or improved while regional tissue flow may still be inadequate.
- Gastric tonometry could measure regional GI perfusion but did not improve outcomes when used as a resuscitation target.
- NIR offers a noninvasive, continuous way to assess regional tissue oxygenation/perfusion.
- However, an abnormal regional measurement does not automatically mean that more resuscitation will improve the patient.
Conceptual Examples
- BP normal + poor regional perfusion → global BP alone may not tell the complete story.
- Hemorrhage → blood shunting → brain/heart/kidneys protected → skin/muscle/gut receive less flow.
- Too much pressor → ↑ BP but possibly ↓ capillary flow → ↑ lactate.
- NIR abnormal → shows possible regional hypoperfusion, but simply giving more fluid to normalize NIR may cause harmful over-resuscitation.
SUPERFAST WITH CEO AND FOUNDER DR SHEEN
