


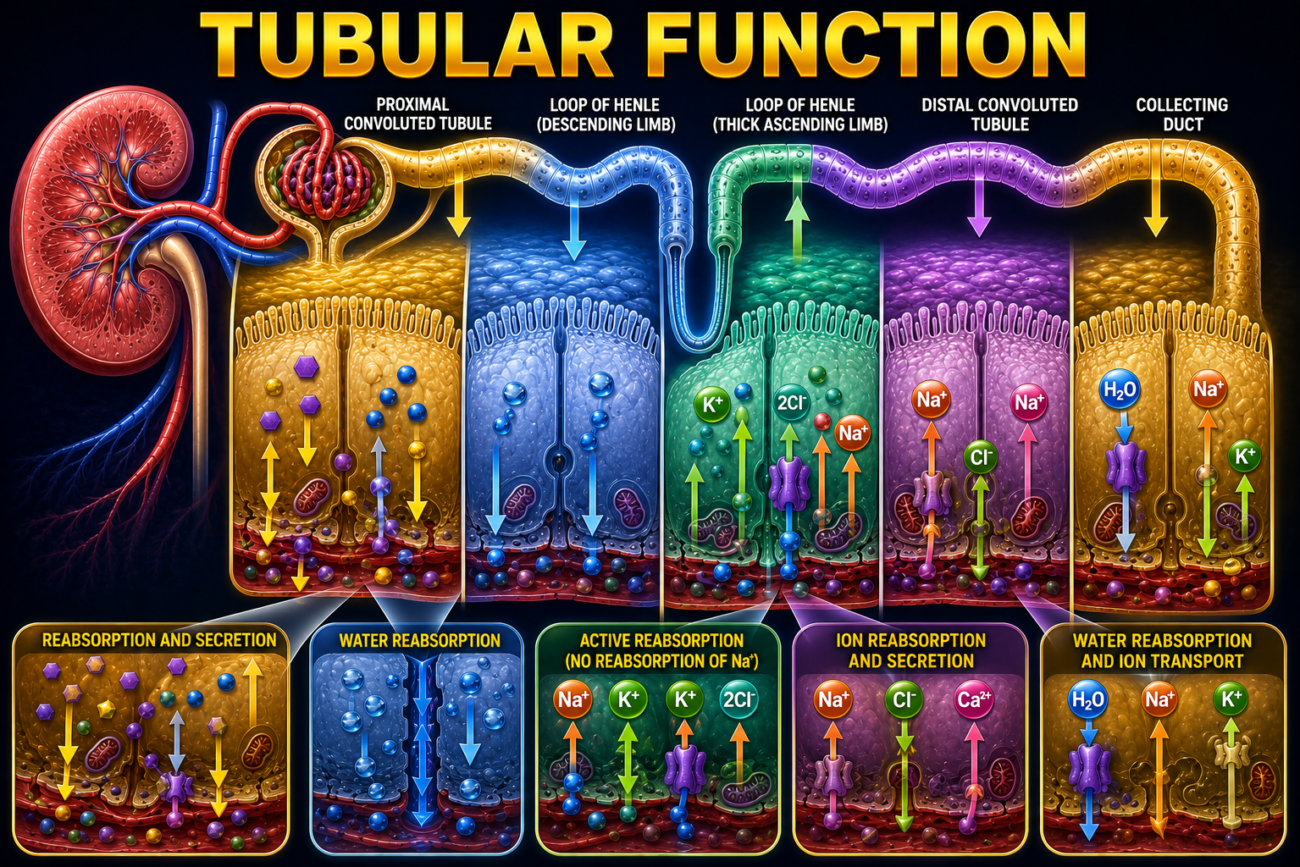
GENERAL CONSIDERATIONS
- The filtered amount of any substance (X) is equal to:
- GFR × Plasma concentration of the substance (GFR × PX).
- After filtration, the tubular cells may add more of the substance to the filtrate.
- This process is called tubular secretion.
- The tubular cells may also remove some or all of the substance from the filtrate.
- This process is called tubular reabsorption.
- A substance may undergo both secretion and reabsorption.
- The amount of substance excreted per unit time (UX) is equal to:
- Amount filtered + Net tubular transfer (TX). (Fig. 37–6)
- TX represents the net amount of substance transferred by the renal tubules. (Fig. 37–6)
- The clearance of a substance equals the GFR when there is no net tubular secretion or reabsorption.
- The clearance is greater than the GFR when there is net tubular secretion.
- The clearance is less than the GFR when there is net tubular reabsorption.
- Much of the knowledge about glomerular filtration and tubular function has been obtained using micropuncture techniques.
- Micropipettes can be inserted into the tubules of a living kidney.
- The composition of the tubular fluid can then be measured using microchemical techniques.
- Two micropipettes can also be inserted into the same tubule.
- This allows the tubule to be perfused in vivo.
- Isolated perfused tubular segments can also be studied in vitro.
- Tubular cells can be grown and studied in cell culture.
KEY CONCEPT
- Filtered load = GFR × Plasma concentration of the substance (GFR × PX).
- Tubular secretion adds substances to the filtrate.
- Tubular reabsorption removes substances from the filtrate.
- Excretion = Filtered amount + Net tubular transfer (TX). (Fig. 37–6)
- Clearance = GFR when there is no net tubular transport; it is greater than GFR with secretion and less than GFR with reabsorption.
- Micropuncture, in vivo perfusion, in vitro perfusion, and cell culture are important methods for studying tubular function.
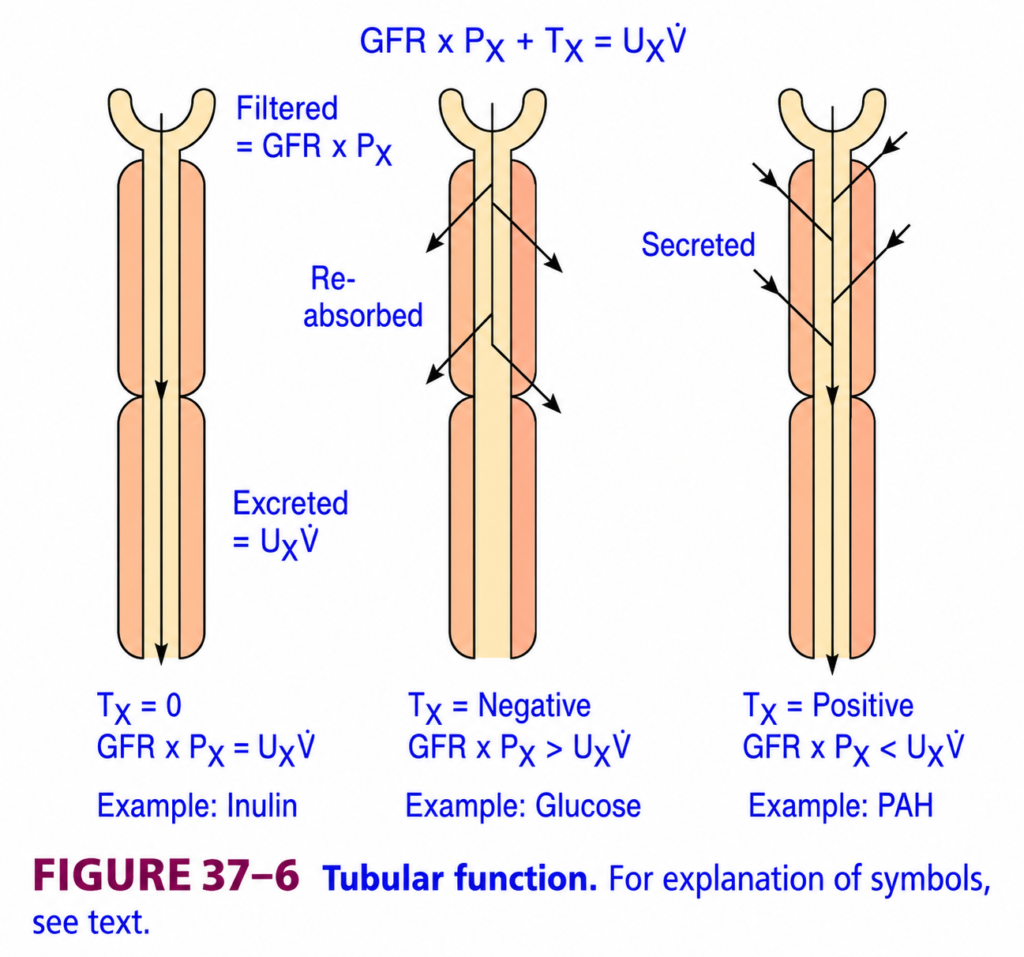
Tubular Function (Ganong Fig. 37-6) – Easiest & Most Conceptual Explanation
🎯 One-Line Concept
After blood is filtered in the glomerulus, the kidney can either keep a substance in the urine, take it back into the blood (reabsorption), or add more of it into the urine (secretion).
Think of the nephron as a smart sorting machine.
- 🟢 Keep useful substances → Reabsorption
- 🔴 Remove harmful substances → Secretion
- ⚪ Leave some substances unchanged → Excretion only
The Big Picture
Every substance (glucose, sodium, urea, creatinine, etc.) follows three possible steps.
Blood
   │
   ▼
1. Filtered
   │
   ▼
Nephron Tubule
   │
 ┌─┴───────────────┐
 │                 │
 ▼                 ▼
Reabsorbed     Secreted
 │                 │
 └──────┬──────────┘
        ▼
     Excreted
     (Urine)
Three Possible Processes
1️⃣ Filtration
The first step occurs in the glomerulus.
Blood is filtered.
Small substances enter the nephron.
Blood
   │
   ▼
Glomerulus
   │
   ▼
Filtrate
Amount Filtered
The figure gives the formula:
Filtered Load = GFR × Plasma Concentration (Px)
Formula
Filtered Load = GFR × PxWhere
- GFR = Glomerular Filtration Rate
- Px = Concentration of substance X in plasma
Example
Suppose
- GFR = 125 mL/min
- Plasma glucose = 1 mg/mL
Then
Filtered glucose

=125 ×1

=125 mg/min
So,
125 mg of glucose enters the nephron every minute.
2️⃣ Reabsorption
After filtration,
the kidney asks:
“Is this substance useful?”
If YES,
it is taken back into the blood.
Tubule
     │
Useful substance
     │
     ▼
Blood
This process is called
Reabsorption
Examples
- Glucose
- Amino acids
- Sodium
- Water
- Bicarbonate
These are valuable substances, so the kidney tries to save them.
3️⃣ Secretion
Sometimes,
the kidney removes extra substances from the blood and puts them into the tubule.
Blood
    │
    ▼
Tubule
This is called
Tubular Secretionamples
- PAH
- Hydrogen ions (H⁺)
- Potassium (K⁺)
- Many drugs
The purpose is to remove unwanted substances from the body.
Finally → Excretion
Everything remaining in the tubule leaves as
Urine
Tubule
    │
    ▼
Urine
Understanding the Three Diagrams
LEFT DIAGRAM
Substance is Only Filtered
Nothing is reabsorbed.
Nothing is secreted.
Blood
   │
Filtered
   │
Tubule
   │
Urine
Everything filtered appears in urine.
Formula
Filtered = ExcretedOR
GFR × Px = UxVExample
Inulin
Inulin
- Is filtered.
- Is NOT reabsorbed.
- Is NOT secreted.
Therefore
Filtered = ExcretedThis is why inulin clearance is used to measure GFR.
MIDDLE DIAGRAM
Substance is Reabsorbed
This time,
the substance is filtered,
but some is taken back into blood.
Blood
   │
Filtered
   │
Tubule
   │
Some returns
to blood
   │
Less remains
in urine
Formula
Filtered > Excretedbecause
Some has been reabsorbed.
Example
Glucose
Normally,
all filtered glucose is reabsorbed.
Therefore
Very little (normally none) appears in urine.
The figure says
Tx = Negative
Why?
Because
Transport is occurring
FROM tubule
TO blood.
That is called
Negative transport.
RIGHT DIAGRAM
Substance is Secreted
This time,
the substance is filtered
AND
extra substance is added from blood.
Blood
   │
Filtered
   │
Tubule
▲
More added
Now,
More leaves in urine
than was originally filtered.
Formula
Excreted > Filteredbecause
Extra substance has been secreted.
Example
PAH (Para-Aminohippuric Acid)
PAH
- Filtered
- Secreted
Therefore,
almost all PAH entering the kidney is removed in one pass.
The figure says
Tx = Positive
because
Substance moves
FROM blood
TO tubule.
Understanding the Main Equation
The figure gives
GFR × Px + Tx = UxV
Let’s simplify it.
Left Side
Filtered

+

Secreted

−

Reabsorbed
equals
Right Side
Excreted in urineEasy Formula
Excreted

=

Filtered

+

Secreted

−

Reabsorbed
This is the most important equation in renal physiology.
Meaning of Symbols
| Symbol | Meaning |
|---|---|
| GFR | Glomerular filtration rate |
| Px | Plasma concentration of substance X |
| Tx | Tubular transport (positive = secretion, negative = reabsorption) |
| Ux | Urine concentration of substance X |
| V | Urine flow rate |
| UxV | Amount excreted per minute |
Everyday Analogy
Imagine a supermarket checkout.
Step 1
All items enter the checkout.
➡ Filtration
Step 2
Useful items are returned to the shelf.
➡ Reabsorption
Step 3
Extra unwanted items are added to the trash.
➡ Secretion
Step 4
Everything left goes into the garbage truck.
➡ Urine
High-Yield Comparison
| Process | Direction | Effect | Example |
|---|---|---|---|
| Filtration | Blood → Tubule | Substance enters filtrate | Inulin, glucose, sodium |
| Reabsorption | Tubule → Blood | Substance saved | Glucose, water, sodium |
| Secretion | Blood → Tubule | Extra substance added | PAH, H⁺, K⁺ |
| Excretion | Tubule → Urine | Substance leaves body | Urea, creatinine, drugs |
Three Important Examples
1. Inulin
Filtered ✔
Reabsorbed ✖
Secreted ✖

Filtered = Excreted
2. Glucose
Filtered ✔
Reabsorbed ✔✔✔
Secreted ✖

Filtered > Excreted
Normally,
no glucose appears in urine.
3. PAH
Filtered ✔
Reabsorbed ✖
Secreted ✔✔✔

Excreted > Filtered
Complete Flow Chart
Blood
      │
      ▼
Glomerular Filtration
      │
      ▼
Tubular Fluid
      │
 ┌────┴──────────────┐
 │                   │
 ▼                   ▼
Reabsorbed       Secreted
 │                   │
 └──────┬────────────┘
        ▼
Remaining Substance
        │
        ▼
Urine (Excretion)
🌟 Super Memory Summary
FILTERED
      │
      ▼
Tubule
      │
 ┌────┴─────┐
 │          │
 ▼          ▼
Reabsorbed  Secreted
 │          │
 └────┬─────┘
      ▼
Excreted
Remember These Three Examples
| Substance | Filtered | Reabsorbed | Secreted | Urine |
|---|---|---|---|---|
| Inulin | ✅ | ❌ | ❌ | = Filtered |
| Glucose | ✅ | ✅ | ❌ | Less than filtered (normally none) |
| PAH | ✅ | ❌ | ✅ | More than filtered |
🧠 Easy Mnemonic
“F-R-S-E”
- F = Filtered
- R = Reabsorbed
- S = Secreted
- E = Excreted
💎 Golden Rule
Every substance filtered by the kidney has only three possible fates: it may be reabsorbed back into the blood, secreted into the tubule, or remain in the tubular fluid and be excreted in the urine. Mathematically:
Excretion = Filtration + Secretion − Reabsorption
MECHANISMS OF TUBULAR REABSORPTION & SECRETION
- Small proteins and some peptide hormones are reabsorbed in the proximal tubules by endocytosis.
- Other substances are reabsorbed or secreted by:
- Passive diffusion between cells.
- Passive diffusion through cells.
- Facilitated diffusion down chemical or electrical gradients.
- Active transport against chemical or electrical gradients.
- These substances move through:
- Ion channels.
- Exchangers.
- Cotransporters.
- Pumps.
- Many of these transport proteins have been cloned.
- Their regulation is being studied.
- The transporters in the luminal membrane are different from those in the basolateral membrane.
- This polarized distribution allows net movement of solutes across the tubular epithelium.
- This arrangement is similar to the gastrointestinal epithelium.
- Like other active transport systems in the body, renal active transport systems have a transport maximum (Tm).
- Tm is the maximum rate at which a transporter can move a particular solute.
- Up to the Tm, the amount transported is directly proportional to the amount of solute present.
- When the Tm is reached, the transport system becomes saturated.
- After saturation, increasing the solute concentration does not significantly increase transport.
- Some transport systems have a very high Tm.
- These systems are difficult to saturate.
- The tubular epithelium, like the small intestinal epithelium, is a leaky epithelium.
- The tight junctions between tubular cells allow some water and electrolytes to pass.
- This movement occurs through the paracellular pathway.
- The exact contribution of the paracellular pathway to fluid and solute movement is still controversial because it is difficult to measure.
- Current evidence suggests that the paracellular pathway plays an important role in the proximal tubule.
- Paracellin-1 is a protein located in the tight junctions.
- Paracellin-1 is involved in Mg²⁺ reabsorption.
- A loss-of-function mutation of the paracellin-1 gene causes severe urinary loss of Mg²⁺ and Ca²⁺.
KEY CONCEPT
- Small proteins and peptide hormones are reabsorbed by endocytosis in the proximal tubule.
- Tubular reabsorption and secretion occur by passive diffusion, facilitated diffusion, and active transport.
- Transport occurs through ion channels, exchangers, cotransporters, and pumps.
- Luminal and basolateral membranes contain different transporters, allowing net solute movement across the tubule.
- Active transport has a maximum rate called the transport maximum (Tm); once Tm is reached, transport becomes saturated.
- The proximal tubule is a leaky epithelium, and the paracellular pathway contributes significantly to water and electrolyte movement.
- Paracellin-1 is important for Mg²⁺ reabsorption, and its mutation causes urinary loss of Mg²⁺ and Ca²⁺.
NA⁺ REABSORPTION
- Reabsorption of Na⁺ and Cl⁻ plays a major role in maintaining body electrolyte and water balance.
- Na⁺ transport is coupled with the movement of:
- H⁺
- Glucose
- Amino acids
- Organic acids
- Phosphate
- Other electrolytes and substances
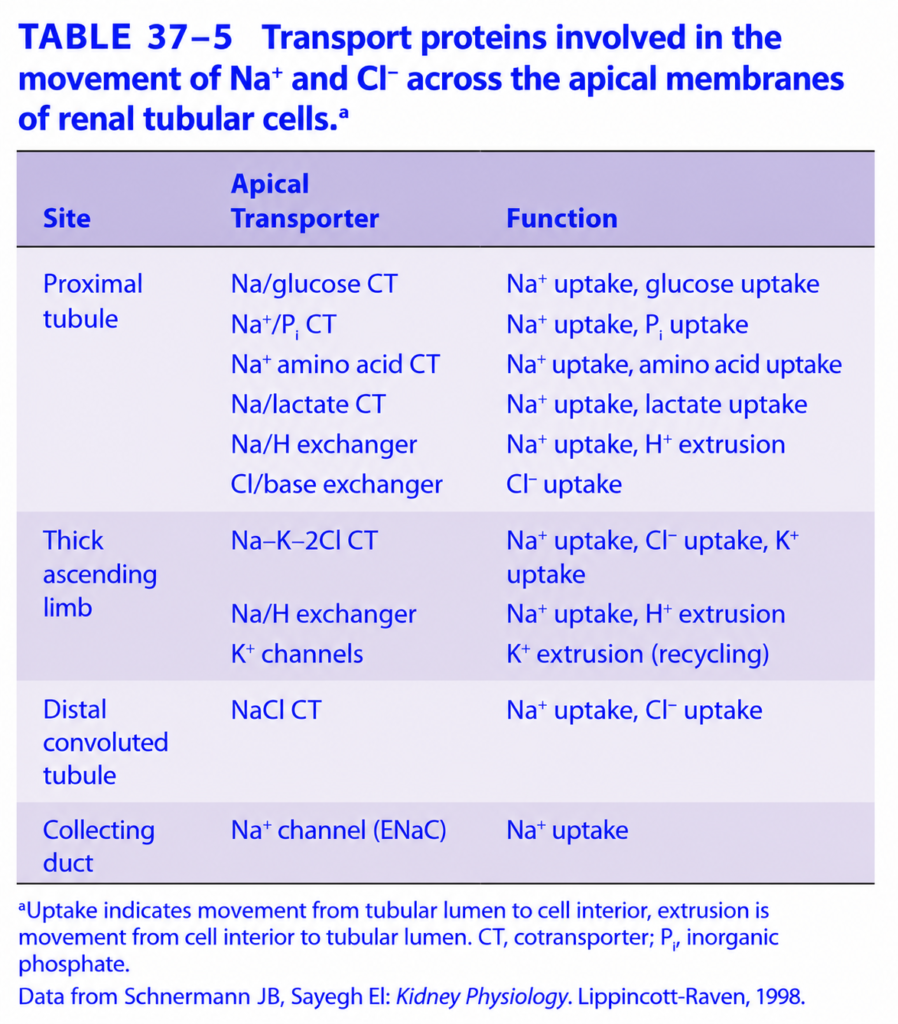
- The main cotransporters and exchangers present in different parts of the nephron are listed in Table 37–5.
- In the proximal tubules, thick ascending limb of the loop of Henle, distal tubules, and collecting ducts, Na⁺ enters the tubular epithelial cells from the tubular lumen.
- Na⁺ enters the cells by:
- Cotransport.
- Exchange.
- This movement occurs down its concentration and electrical gradients.
- Na⁺ is then actively pumped from the tubular cells into the interstitial space.
- This pumping is carried out by the Na⁺, K⁺-ATPase located in the basolateral membrane.
- Therefore, Na⁺ is actively transported in all parts of the renal tubule except the thin segments of the loop of Henle.
- The Na⁺, K⁺-ATPase pumps:
- 3 Na⁺ out of the cell.
- 2 K⁺ into the cell.
- The tubular cells of the nephron are connected by tight junctions at their luminal edges.
- Along the rest of their lateral borders, spaces are present between adjacent cells.
- A large amount of Na⁺ is actively transported into these lateral intercellular spaces. (Fig. 37–7)
- Normally, about 60% of the filtered Na⁺ is reabsorbed in the proximal tubule.
- This occurs mainly by Na⁺–H⁺ exchange.
- About 30% of the filtered Na⁺ is reabsorbed in the thick ascending limb of the loop of Henle.
- This occurs through the Na⁺–2Cl⁻–K⁺ cotransporter.
- In both the proximal tubule and the thick ascending limb, passive paracellular movement of Na⁺ also contributes to Na⁺ reabsorption.
- About 7% of the filtered Na⁺ is reabsorbed in the distal convoluted tubule.
- This occurs through the Na⁺–Cl⁻ cotransporter.
- The remaining about 3% of filtered Na⁺ is reabsorbed in the collecting ducts.
- This occurs through ENaC channels.
- This 3% of Na⁺ reabsorption is regulated by aldosterone.
- Aldosterone allows homeostatic adjustment of Na⁺ balance.
KEY CONCEPT
- Na⁺ and Cl⁻ reabsorption is essential for maintaining electrolyte and water balance.
- Na⁺ transport is coupled with the transport of H⁺, glucose, amino acids, phosphate, and other substances.
- Na⁺ enters tubular cells by cotransport or exchange and is pumped into the interstitium by the Na⁺, K⁺-ATPase.
- The Na⁺, K⁺-ATPase pumps 3 Na⁺ out of the cell and 2 K⁺ into the cell.
- Na⁺ reabsorption occurs as follows:
- 60% – Proximal tubule (mainly Na⁺–H⁺ exchange)
- 30% – Thick ascending limb (Na⁺–2Cl⁻–K⁺ cotransporter)
- 7% – Distal convoluted tubule (Na⁺–Cl⁻ cotransporter)
- 3% – Collecting duct (ENaC channels, regulated by aldosterone)
- Passive paracellular Na⁺ movement also contributes in the proximal tubule and thick ascending limb. (Fig. 37–7)
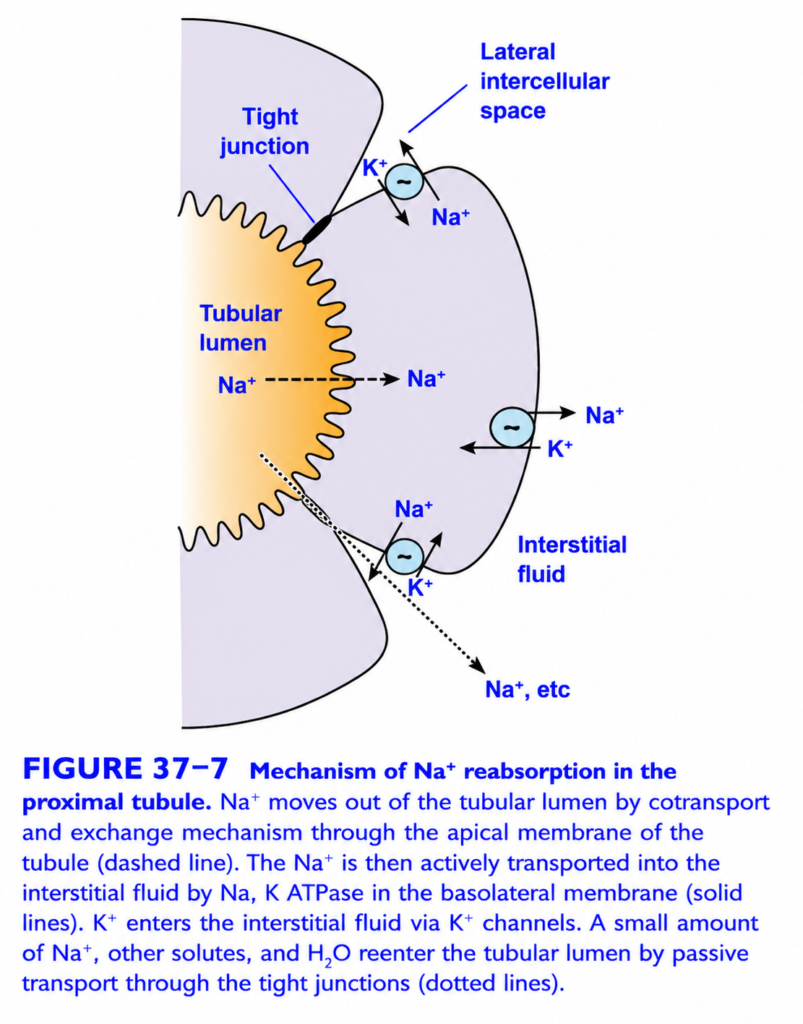
Mechanism of Na⁺ Reabsorption in the Proximal Tubule Figure 37.7 (Summarized Essay)
The proximal tubule is the main site where the kidneys reabsorb sodium (Na⁺). Sodium moves from the tubular lumen into the tubular epithelial cells through the apical (luminal) membrane by different transport mechanisms, including cotransport and Na⁺ exchange. These transporters allow Na⁺ to enter the cell by moving together with other substances or by exchanging with other ions.
After entering the tubular cell, Na⁺ is actively pumped across the basolateral membrane into the interstitial fluid by the Na⁺/K⁺-ATPase pump. This pump uses ATP to transport three Na⁺ ions out of the cell and two K⁺ ions into the cell, keeping intracellular Na⁺ concentration low. This low intracellular Na⁺ creates the driving force that allows continuous Na⁺ entry from the tubular lumen.
The K⁺ that enters the cell through the Na⁺/K⁺-ATPase does not accumulate inside the cell. Instead, most of it diffuses back into the interstitial fluid through basolateral K⁺ channels, helping maintain the electrical balance and allowing the Na⁺/K⁺ pump to function efficiently.
The epithelial cells are connected by tight junctions, but these junctions are slightly permeable. Therefore, a small amount of Na⁺, water (H₂O), and other solutes can move back into the tubular lumen through the tight junctions by passive diffusion (back-leak). Although this back-leak occurs, the overall movement of Na⁺ is still toward the interstitial fluid, resulting in net Na⁺ reabsorption.
Thus, Na⁺ reabsorption in the proximal tubule is a coordinated process involving passive entry of Na⁺ across the apical membrane, active extrusion by the Na⁺/K⁺-ATPase on the basolateral membrane, K⁺ recycling through K⁺ channels, and minimal passive back-leak through tight junctions. This mechanism enables the kidneys to efficiently reclaim most of the filtered sodium, along with water and many other solutes, helping maintain extracellular fluid volume, electrolyte balance, and normal blood pressure.
GLUCOSE REABSORPTION
- Glucose, amino acids, and bicarbonate are reabsorbed together with Na⁺ in the early part of the proximal tubule. (Fig. 37–8)
- Glucose is a typical example of a substance reabsorbed by secondary active transport.
- Glucose is filtered at a rate of about 100 mg/min.
- This is calculated as:
- 80 mg/dL × 125 mL/min = 100 mg/min
- Almost all filtered glucose is reabsorbed.
- Normally, only a few milligrams of glucose are excreted in the urine over 24 hours.
- The amount of glucose reabsorbed is directly proportional to the amount filtered.
- The filtered amount depends on:
- Plasma glucose concentration (PG).
- Glomerular filtration rate (GFR).
- Glucose reabsorption increases until the transport maximum (TmG) is reached.
- When TmG is exceeded, the amount of glucose in the urine increases. (Fig. 37–9)
- The TmG is approximately:
- 375 mg/min in men.
- 300 mg/min in women.
- The renal threshold for glucose is the plasma glucose level at which glucose first appears in the urine in amounts greater than normal.
- The predicted renal threshold is about 300 mg/dL.
- This is calculated as:
- 375 mg/min ÷ 125 mL/min = 3 mg/mL
- 3 mg/mL = 300 mg/dL
- However, the actual renal threshold is about:
- 200 mg/dL in arterial plasma.
- 180 mg/dL in venous plasma.
- Fig. 37–9 explains why the actual renal threshold is lower than the predicted value.
- The ideal curve assumes:
- All tubules have the same TmG.
- All filtered glucose is completely reabsorbed below the TmG.
- In reality, the actual curve is rounded and differs from the ideal curve.
- This difference is called splay.
- The magnitude of the splay is inversely proportional to the avidity of the transport mechanism for the substance.
KEY CONCEPT
- Glucose is reabsorbed with Na⁺ in the early proximal tubule by secondary active transport. (Fig. 37–8)
- Filtered glucose = Plasma glucose concentration × GFR.
- Normal filtered glucose = 80 mg/dL × 125 mL/min = 100 mg/min.
- Glucose is almost completely reabsorbed until the transport maximum (TmG) is reached.
- TmG = 375 mg/min in men and 300 mg/min in women.
- Predicted renal threshold = 375 mg/min ÷ 125 mL/min = 300 mg/dL.
- Actual renal threshold = about 200 mg/dL (arterial plasma) or 180 mg/dL (venous plasma).
- The difference between the ideal and actual reabsorption curve is called splay. (Fig. 37–9)
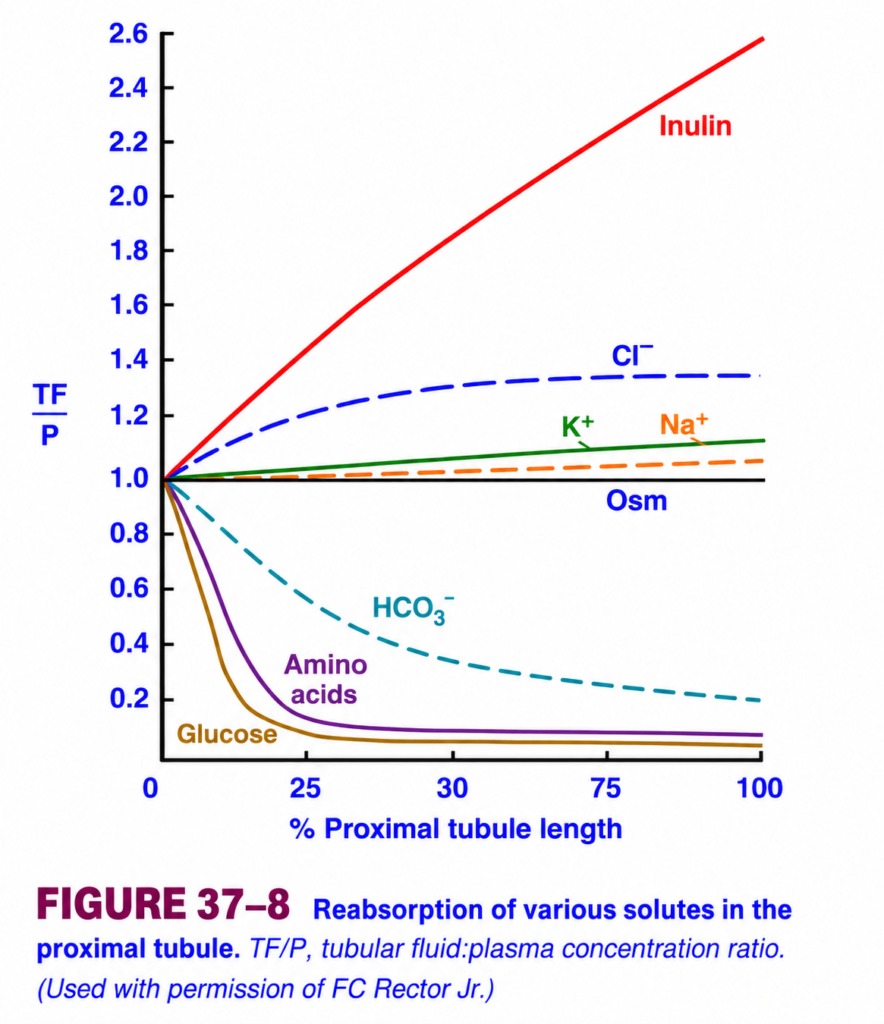
Reabsorption of Various Solutes in the Proximal Tubule (TF/P Ratio Graph) – Easy Conceptual Summary
Basic Concept of the Graph
This graph shows how the concentration of different substances changes inside the proximal tubule as filtrate moves from the beginning (0%) to the end (100%) of the proximal tubule.
- Y-axis (TF/P ratio) = Tubular Fluid concentration ÷ Plasma concentration
- X-axis = Percentage of proximal tubule length
Golden Rule
- TF/P = 1
- Tubular fluid concentration = Plasma concentration.
- The substance is reabsorbed at the same rate as water.
- TF/P > 1
- The substance becomes more concentrated in tubular fluid.
- Water is removed faster than the substance, or the substance is not reabsorbed well.
- TF/P < 1
- The substance becomes less concentrated in tubular fluid.
- The substance is reabsorbed faster than water.
Understanding Every Line
1. Red Line — Inulin
What happens?
- Starts at TF/P = 1
- Continuously rises to about 2.6.
Why?
Inulin is:
- Freely filtered
- Not reabsorbed
- Not secreted
Only water leaves the tubule.
Since water decreases but inulin stays behind,
➡️ Inulin concentration continuously increases.
Easy Concept
Imagine:
You have 10 marbles in a glass of water.
You slowly remove water but never remove marbles.
The marbles become more concentrated.
Exactly the same happens with inulin.
Key Point
Inulin is the reference marker for water reabsorption.
2. Blue Dashed Line — Chloride (Cl⁻)
This is a dotted (dashed) line.
What happens?
- Slight increase above 1
- Reaches around 1.3
- Then almost becomes flat.
Why?
Early proximal tubule:
- Sodium is reabsorbed together with
- Glucose
- Amino acids
- Bicarbonate
Chloride is left behind.
Therefore,
Its concentration inside tubular fluid increases.
Later:
Because chloride concentration becomes high,
it begins to diffuse back into blood.
Therefore,
The curve becomes almost flat.
Easy Concept
Initially chloride waits.
Later chloride follows sodium into blood.
Key Point
Cl⁻ is reabsorbed later than sodium.
3. Green Line — Potassium (K⁺)
What happens?
Very small increase above 1.
Why?
Water leaves slightly faster initially.
So potassium concentration increases a little.
Later,
Potassium is reabsorbed together with water.
Therefore,
Its concentration changes very little.
Key Point
Potassium is reabsorbed almost proportionally with water.
4. Orange Dashed Line — Sodium (Na⁺)
Another dotted line.
What happens?
Almost straight around TF/P = 1.
Very slight increase.
Why?
About 65–70% of filtered sodium is reabsorbed in the proximal tubule.
At the same time,
About the same amount of water is also reabsorbed.
Therefore,
The concentration of sodium inside tubular fluid remains nearly unchanged.
Easy Concept
Imagine removing:
- 65 sodium molecules
- 65 water molecules
The concentration stays almost the same.
Key Point
Sodium and water are reabsorbed together (isosmotic reabsorption).
5. Black Horizontal Line — Osmolarity (Osm)
What happens?
Always remains exactly at TF/P = 1.
Why?
Water and dissolved solutes are reabsorbed together.
Therefore,
Tubular fluid remains almost isotonic with plasma.
Key Point
The proximal tubule performs isosmotic reabsorption.
6. Cyan Dashed Line — Bicarbonate (HCO₃⁻)
Another dotted line.
What happens?
Gradually falls from 1 to about 0.2.
Why?
Bicarbonate is actively reabsorbed very efficiently.
It disappears from tubular fluid faster than water.
Therefore,
Its concentration steadily falls.
Easy Concept
Water leaves.
But bicarbonate leaves even faster.
So very little bicarbonate remains.
Key Point
Most bicarbonate is reabsorbed in the proximal tubule.
7. Purple Line — Amino Acids
What happens?
Drops rapidly toward zero.
Why?
Nearly all amino acids are reabsorbed in the first part of the proximal tubule.
Very little remains.
Easy Concept
The kidney tries to save all amino acids because they are valuable nutrients.
Key Point
Almost 100% amino acids are reabsorbed normally.
8. Brown Line — Glucose
What happens?
Falls fastest of all curves.
Almost reaches zero very early.
Why?
Glucose is reabsorbed rapidly by sodium-glucose cotransporters (SGLT).
Normally,
No glucose remains in urine.
Easy Concept
The kidney treats glucose as precious fuel.
It removes glucose from the filtrate almost immediately.
Key Point
Normal urine contains no glucose.
Understanding the Dotted (Dashed) Lines
There are three dotted (dashed) curves in the graph.
1. Sodium (Na⁺) – Orange Dashed Line
- Remains close to TF/P = 1.
- Sodium is reabsorbed almost exactly with water.
- Shows isosmotic reabsorption.
2. Chloride (Cl⁻) – Blue Dashed Line
- Initially increases because sodium, glucose, amino acids, and bicarbonate are reabsorbed first.
- Chloride concentration rises temporarily.
- Later chloride is also reabsorbed, so the curve levels off.
3. Bicarbonate (HCO₃⁻) – Cyan Dashed Line
- Continuously decreases.
- Bicarbonate is reabsorbed much faster than water.
- Therefore its tubular concentration progressively falls.
Quick Memory Trick
| Substance | TF/P Change | Main Reason |
|---|---|---|
| Inulin | ↑↑ Highest | Water removed, inulin not reabsorbed |
| Cl⁻ | ↑ Slightly | Reabsorbed later than sodium |
| K⁺ | Slight ↑ | Reabsorbed almost with water |
| Na⁺ | ≈1 | Reabsorbed with water |
| Osmolarity | =1 | Isosmotic reabsorption |
| HCO₃⁻ | ↓ | Rapidly reabsorbed |
| Amino acids | ↓↓↓ | Nearly completely reabsorbed early |
| Glucose | ↓↓↓ Fastest | Almost completely reabsorbed very early |
Key Concept
The TF/P ratio reflects how a substance behaves relative to water during proximal tubular reabsorption. Inulin rises because only water is removed, making it the marker of water reabsorption. Sodium and osmolarity remain close to 1, demonstrating isosmotic reabsorption. Chloride initially becomes concentrated because it is reabsorbed later than sodium, then levels off as it diffuses back into the blood. Bicarbonate, glucose, and amino acids fall below 1 because they are reabsorbed faster than water, with glucose and amino acids disappearing almost completely in the early proximal tubule. This graph summarizes the selective handling of solutes by the proximal tubule and is one of the most important concepts in renal physiology for MBBS students.
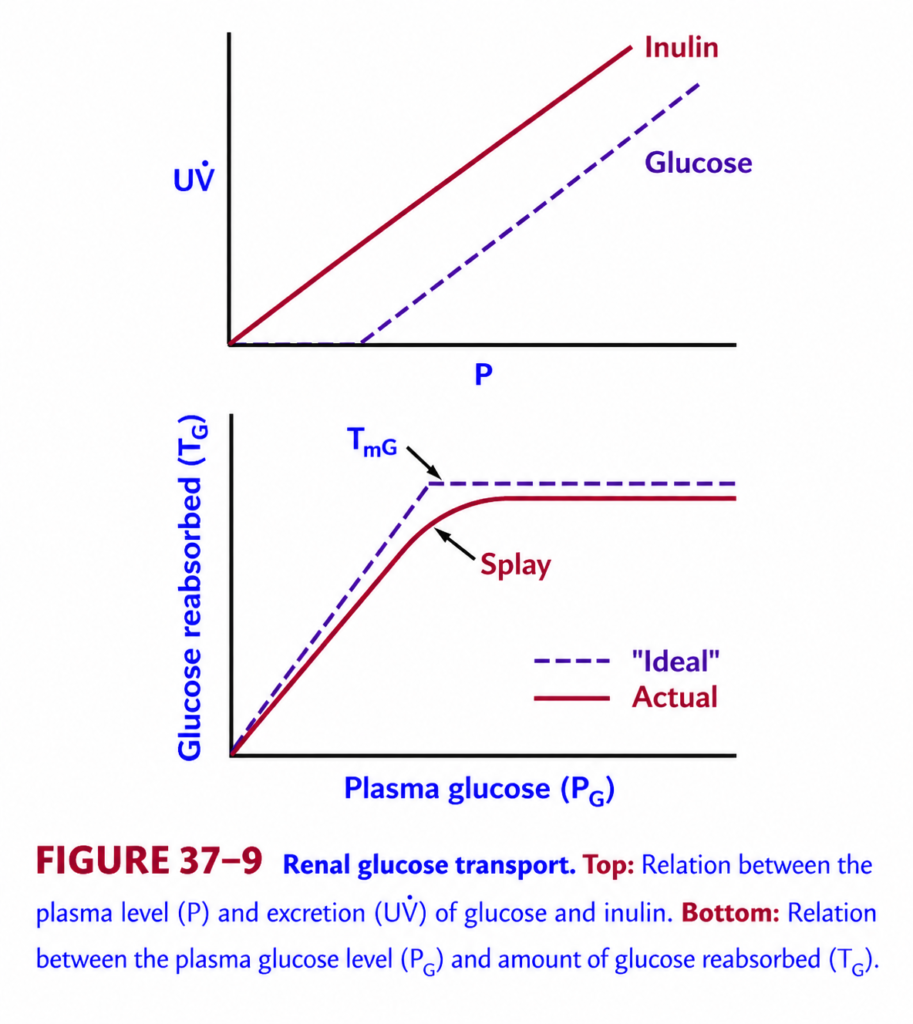
Renal Glucose Transport (Figure 37–9) – Easy Conceptual Summary
This figure explains how the kidney handles glucose when the plasma glucose concentration increases. It contains two graphs:
- Top Graph: Plasma glucose vs Urinary excretion (UV)
- Bottom Graph: Plasma glucose vs Glucose reabsorbed (TG)
Understanding these two graphs together makes renal glucose transport very easy.
Basic Concepts Before Understanding the Graph
Normally,
- Glucose is freely filtered at the glomerulus.
- The proximal tubule reabsorbs almost all filtered glucose.
- Glucose is reabsorbed by SGLT transporters, which have a maximum transport capacity (TmG).
- When all transporters become saturated, extra glucose cannot be reabsorbed and begins to appear in urine.
TOP GRAPH
Relation Between Plasma Glucose (P) and Urinary Glucose Excretion (UV)
Axes
- X-axis: Plasma glucose (P)
- Y-axis: Urinary glucose excretion (UV)
There are two lines.
1. Red Line — Inulin
What happens?
The line starts from zero and rises continuously in a straight line.
Why?
Inulin is:
- Freely filtered
- Not reabsorbed
- Not secreted
Therefore,
Every molecule filtered is excreted in urine.
As plasma inulin increases,
Urinary inulin increases proportionally.
Easy Concept
Filtered = Excreted
Nothing is taken back.
Key Point
Inulin excretion always increases linearly.
2. Purple Dashed Line — Glucose
What happens?
Initially,
The line stays flat at zero.
Then,
It suddenly begins to rise.
Why?
At low plasma glucose,
All filtered glucose is reabsorbed.
Therefore,
No glucose appears in urine.
As plasma glucose increases further,
The transporters become saturated.
Now,
Extra glucose cannot be reabsorbed.
It begins appearing in urine.
Easy Concept
Imagine a bus with 100 seats.
As long as passengers are fewer than 100,
Everyone gets inside.
No one is left behind.
Once 100 seats are full,
New passengers remain outside.
These “left-behind passengers” represent glucose in urine.
Key Point
Glucose appears in urine only after the renal threshold is exceeded.
BOTTOM GRAPH
Relation Between Plasma Glucose and Glucose Reabsorbed (TG)
Axes
- X-axis: Plasma glucose (PG)
- Y-axis: Glucose reabsorbed (TG)
There are two curves.
1. Purple Dashed Line — Ideal Curve
What happens?
The line rises perfectly straight.
Then,
It suddenly becomes horizontal.
Why?
In an ideal kidney,
Every nephron has exactly the same transport capacity.
When the transport maximum (TmG) is reached,
No further glucose can be reabsorbed.
The graph suddenly becomes flat.
Key Point
Ideal kidneys would show an abrupt plateau.
2. Red Line — Actual Curve
What happens?
The line rises.
Instead of becoming flat suddenly,
It bends gradually before reaching the plateau.
This curved portion is called Splay.
What is Splay?
Definition
Splay is the curved region between the ideal curve and the actual curve before reaching TmG.
Why does Splay occur?
Not all nephrons are identical.
Some nephrons:
- Reach saturation earlier.
Others:
- Reach saturation later.
Therefore,
Some nephrons begin excreting glucose while others are still reabsorbing it.
As a result,
Glucose starts appearing gradually instead of suddenly.
Easy Concept
Imagine 100 workers loading boxes.
If all workers become tired at exactly the same time,
Loading stops suddenly.
This represents the ideal curve.
But in reality,
Some workers become tired earlier,
Others later.
Therefore,
Loading slows gradually.
This gradual slowing is called Splay.
Transport Maximum (TmG)
TmG means:
Maximum amount of glucose that renal tubules can reabsorb per minute.
Once this limit is reached,
No additional glucose can be reabsorbed.
Extra glucose is excreted in urine.Clinical Importance
Normal person
- Nearly all filtered glucose is reabsorbed.
- Urine contains no glucose.
Diabetes Mellitus
Plasma glucose becomes very high.
Filtered glucose exceeds TmG.
Transporters become saturated.
Excess glucose appears in urine.
This is called:
Glucosuria
Osmotic Diuresis
Glucose remaining in urine attracts water.
This increases urine volume.
Result:
- Polyuria
- Dehydration
- Excessive thirst (Polydipsia)
Comparison of Both Graphs
| Feature | Top Graph | Bottom Graph |
|---|---|---|
| X-axis | Plasma glucose | Plasma glucose |
| Y-axis | Urinary glucose excretion | Glucose reabsorbed |
| Inulin | Linear increase | Not shown |
| Glucose | No excretion initially, then rises | Reabsorption increases then reaches TmG |
| Plateau | No | Yes (TmG) |
| Splay | Not shown | Present in actual curve |
Quick Memory Table
| Curve | Meaning | Why? |
|---|---|---|
| Inulin | Straight upward line | Filtered only, never reabsorbed |
| Glucose (Top) | Flat then rises | Completely reabsorbed until threshold, then excreted |
| Ideal Curve (Bottom) | Straight then sudden plateau | All nephrons saturate simultaneously |
| Actual Curve (Bottom) | Gradual bend then plateau | Different nephrons saturate at different times (Splay) |
Key Concept
The kidney normally filters glucose freely and reabsorbs nearly all of it in the proximal tubule, so no glucose appears in urine. As plasma glucose rises, glucose reabsorption increases until the transport maximum (TmG) is reached. Beyond this point, the transporters become saturated, and excess glucose is excreted in urine (glucosuria). The ideal curve shows an abrupt plateau at TmG, whereas the actual curve shows a gradual transition called splay, reflecting differences in the saturation of glucose transporters among individual nephrons. This concept explains why glucose may begin to appear in urine before the entire kidney reaches its maximum reabsorptive capacity.
GLUCOSE TRANSPORT MECHANISM
- Glucose reabsorption in the kidneys is similar to glucose reabsorption in the intestine.
- Glucose and Na⁺ bind to the Sodium-Dependent Glucose Transporter-2 (SGLT-2) in the apical membrane.
- SGLT-2 carries glucose into the tubular cell as Na⁺ moves down its electrical and chemical gradient.
- The Na⁺ is then actively pumped out of the cell into the interstitial fluid.
- The glucose leaves the cell by facilitated diffusion.
- Glucose exits through Glucose Transporter-2 (GLUT-2) into the interstitial fluid.
- In the rat, some glucose transport also occurs through:
- SGLT-1.
- GLUT-1.
- SGLT-2 specifically binds the D-isomer of glucose.
- D-glucose is transported many times faster than L-glucose.
- Glucose transport in the kidney is inhibited by the plant glucoside phlorhizin.
- Phlorhizin competes with D-glucose for binding to the SGLT-2 carrier.
KEY CONCEPT
- Renal glucose reabsorption is similar to intestinal glucose reabsorption.
- Glucose enters tubular cells with Na⁺ through the SGLT-2 transporter in the apical membrane.
- Na⁺ is pumped into the interstitial fluid, while glucose leaves the cell through GLUT-2 by facilitated diffusion.
- In rats, SGLT-1 and GLUT-1 also contribute to glucose transport.
- SGLT-2 transports D-glucose much more efficiently than L-glucose.
- Phlorhizin inhibits glucose reabsorption by competing with D-glucose for the SGLT-2 transporter.
ADDITIONAL EXAMPLES OF SECONDARY ACTIVE TRANSPORT
- Like glucose reabsorption, amino acid reabsorption occurs mainly in the early part of the proximal convoluted tubule.
- Amino acid reabsorption in the kidney is similar to amino acid absorption in the intestine.
- The main carriers in the apical membrane cotransport Na⁺ with amino acids.
- The carriers in the basolateral membrane are not Na⁺-dependent.
- Na⁺ is pumped out of the tubular cells by the Na⁺, K⁺-ATPase.
- The amino acids leave the cells and enter the interstitial fluid by:
- Passive diffusion.
- Facilitated diffusion.
- Some Cl⁻ is reabsorbed together with Na⁺ and K⁺ in the thick ascending limb of the loop of Henle.
- Two members of the Cl⁻ channel family have been identified in the kidney.
- Mutations in the gene for one renal Cl⁻ channel are associated with:
- Ca²⁺-containing kidney stones.
- Hypercalciuria.
- Dent disease.
- The exact relationship between tubular transport of Ca²⁺ and Cl⁻ is still not fully understood.
KEY CONCEPT
- Amino acids are reabsorbed mainly in the early proximal convoluted tubule by secondary active transport.
- Na⁺ and amino acids enter the tubular cells together through Na⁺-dependent carriers in the apical membrane.
- Na⁺ is pumped out by the Na⁺, K⁺-ATPase, while amino acids leave through passive or facilitated diffusion.
- Some Cl⁻ is reabsorbed with Na⁺ and K⁺ in the thick ascending limb of the loop of Henle.
- Mutations of a renal Cl⁻ channel can cause Ca²⁺-containing kidney stones, hypercalciuria, and Dent disease.
- The exact link between Ca²⁺ and Cl⁻ transport in the kidney is still uncertain.
PAH TRANSPORT
- PAH (Para-aminohippuric acid) transport demonstrates how active transport secretes substances into the tubular fluid.
- The filtered load of PAH increases directly with the plasma PAH concentration (PPAH).
- PAH secretion also increases as plasma PAH concentration increases.
- However, PAH secretion increases only until the maximum secretion rate (TmPAH) is reached. (Fig. 37–10)
Clinical Box 37–1: Substances Secreted by the Tubules
- The renal tubules actively secrete:
- Derivatives of hippuric acid, including PAH.
- Phenol red.
- Other sulfonphthalein dyes.
- Penicillin.
- Various iodinated dyes.
- Substances normally produced in the body and secreted by the tubules include:
- Ethereal sulfates.
- Steroid glucuronides.
- Other glucuronides.
- 5-Hydroxyindoleacetic acid (5-HIAA), the principal metabolite of serotonin.
Therapeutic Highlights
- Furosemide (loop diuretic) is an organic anion.
- Thiazide diuretics are also organic anions.
- These drugs reach their sites of action after being secreted into the tubular fluid by the proximal tubule.
- Furosemide acts mainly in the thick ascending limb of the loop of Henle.
- Thiazide diuretics act mainly in the distal convoluted tubule.
- When PPAH is low, CPAH (PAH clearance) is high.
- As PPAH increases above TmPAH, CPAH gradually decreases.
- Eventually, CPAH approaches the clearance of inulin (CIn). (Fig. 37–11)
- This happens because the amount of PAH secreted becomes a smaller fraction of the total amount excreted.
- In contrast, glucose clearance (CG) is almost zero when the plasma glucose level is below the renal threshold.
- When the plasma glucose level rises above the renal threshold, CG increases.
- As plasma glucose continues to increase, CG approaches the clearance of inulin (CIn).
- CPAH is used to measure the Effective Renal Plasma Flow (ERPF).
KEY CONCEPT
- PAH transport demonstrates active tubular secretion.
- PAH secretion increases with plasma PAH concentration until the transport maximum (TmPAH) is reached. (Fig. 37–10)
- When plasma PAH exceeds TmPAH, PAH clearance decreases and approaches inulin clearance. (Fig. 37–11)
- The renal tubules actively secrete PAH, penicillin, phenol red, iodinated dyes, ethereal sulfates, glucuronides, and 5-HIAA.
- Furosemide and thiazide diuretics reach their tubular sites of action after secretion by the proximal tubule.
- PAH clearance (CPAH) is used to measure Effective Renal Plasma Flow (ERPF).
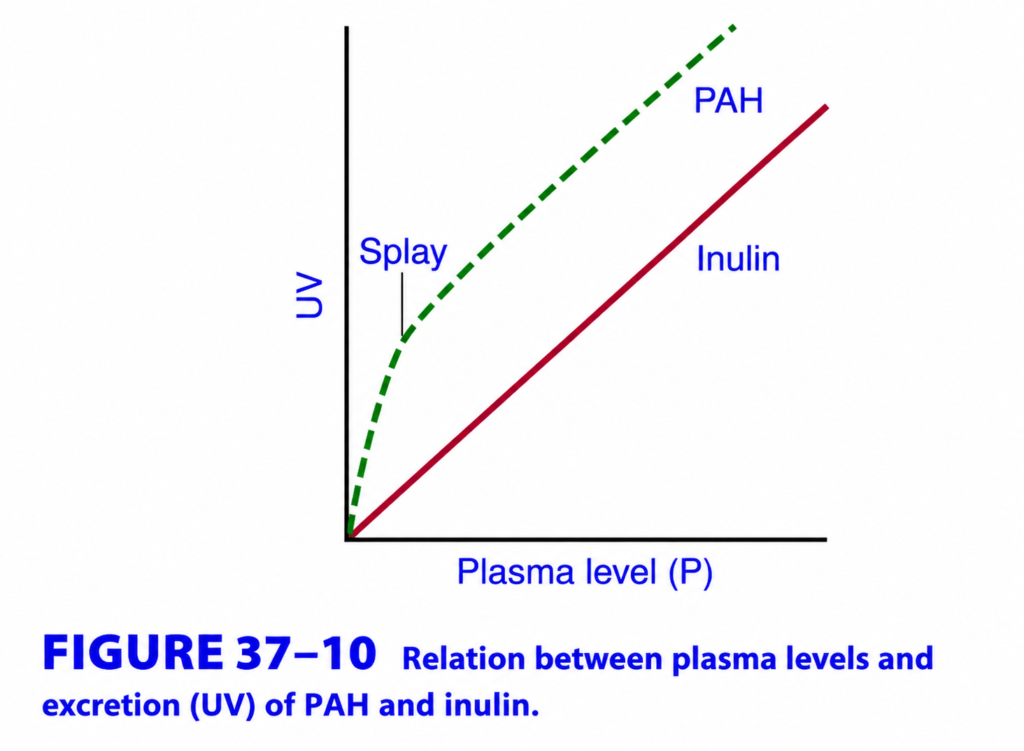
PAH and Inulin Excretion (Figure 37–10) – Easy Conceptual Summary
This graph compares how the kidney excretes Inulin and PAH (Para-Aminohippuric Acid) as their plasma concentration increases.
It helps us understand the difference between filtration only and filtration plus secretion.
Basic Concepts Before Understanding the Graph
There are two important substances:
1. Inulin
- Freely filtered by the glomerulus.
- Not reabsorbed.
- Not secreted.
- Everything filtered is excreted.
2. PAH (Para-Aminohippuric Acid)
- Freely filtered.
- Actively secreted by the proximal tubule.
- Not reabsorbed.
- Therefore, much more PAH is excreted than inulin.
Understanding the Axes
X-axis (Plasma Level, P)
Shows the concentration of PAH or Inulin in the blood.
As we move to the right,
➡️ Plasma concentration increases.
Y-axis (UV)
Represents the amount excreted in urine.
As we move upward,
➡️ More substance is excreted.
Understanding Every Line
1. Red Line — Inulin
What happens?
The red line starts at zero and rises in a straight line.
Why?
Inulin is:
- Filtered only
- Not secreted
- Not reabsorbed
Therefore,
Every increase in plasma inulin produces a proportional increase in urinary excretion.
Easy Concept
Imagine a factory where every item entering the gate immediately leaves through the exit, with no items added or removed.
So,
Filtered = Excreted
Key Point
Inulin excretion depends only on glomerular filtration (GFR).
2. Green Dashed Line — PAH
This is the dotted (dashed) green line.
What happens?
Initially,
The line rises much more steeply than the inulin line.
Later,
The slope becomes less steep and almost parallels the inulin line.
Why does PAH rise so rapidly at first?
At low plasma concentrations,
PAH is:
- Freely filtered.
- Actively secreted into the tubule by proximal tubular cells.
Therefore,
Two processes increase PAH excretion:
- Glomerular filtration
- Tubular secretion
As a result,
Much more PAH enters the urine than inulin.
Easy Concept
Imagine:
A conveyor belt carries boxes (filtration).
Workers standing beside the belt also throw extra boxes onto it (secretion).
So,
More boxes reach the exit than were originally on the conveyor.
That is exactly how PAH behaves.
Why does the PAH curve bend?
As plasma PAH continues to increase,
The secretion transporters begin to work at their maximum capacity.
They cannot transport any more PAH.
This point is called the Transport Maximum (Tm) for PAH secretion.
Now,
Only filtration continues to increase.
Therefore,
The curve becomes less steep and runs almost parallel to the inulin line.
Easy Concept
Imagine workers loading boxes onto the conveyor.
Initially,
They can keep adding boxes quickly.
Eventually,
All workers are fully occupied.
Even if more boxes arrive,
They cannot load any faster.
Only the conveyor continues carrying the filtered boxes.
What is Splay?
The curved portion labeled Splay is the gradual transition before secretion reaches its maximum.
Why does Splay occur?
Not all nephrons have identical secretory capacity.
- Some tubular cells become saturated earlier.
- Others become saturated later.
Therefore,
Secretion decreases gradually rather than stopping suddenly.
This creates the smooth curved region called Splay.
Easy Concept
Imagine 100 workers.
Some become tired earlier.
Others continue working longer.
Loading slows gradually instead of stopping all at once.
That gradual slowing is called Splay.
Why is PAH Always Above Inulin?
Because PAH is:
- Filtered plus
- Secreted
Whereas Inulin is:
- Filtered only
Therefore,
More PAH reaches the urine.
Clinical Importance
1. Inulin
Used to measure:
Glomerular Filtration Rate (GFR)
Because:
- Filtered only
- No secretion
- No reabsorption
2. PAH
Used to estimate:
Renal Plasma Flow (RPF)
Because:
Almost all PAH entering the kidneys is removed in a single pass through filtration and secretion.
Comparison of PAH and Inulin
| Feature | Inulin | PAH |
|---|---|---|
| Filtered | ✔ | ✔ |
| Reabsorbed | ✘ | ✘ |
| Secreted | ✘ | ✔ |
| Excretion | Equals filtered amount | Filtered + secreted amount |
| Curve | Straight line | Steep initially, then bends due to Tm |
| Clinical use | Measure GFR | Estimate Renal Plasma Flow (RPF) |
Quick Memory Trick
Inulin = F
F = Filtered only
PAH = FS
F = Filtered
S = Secreted
Therefore,
PAH excretion is always greater than Inulin excretion.
Key Concept
The graph compares inulin, which is filtered only, with PAH, which is both filtered and actively secreted by the proximal tubule. Inulin shows a straight-line increase in urinary excretion because every filtered molecule is excreted. PAH initially rises much more steeply because secretion adds extra PAH to the tubular fluid. As plasma PAH increases, the secretory transporters become saturated and reach their transport maximum (Tm). At this stage, secretion cannot increase further, so only filtration contributes to additional excretion, making the PAH curve become nearly parallel to the inulin curve. The splay represents the gradual saturation of secretory transporters in different nephrons. Clinically, inulin clearance measures GFR, whereas PAH clearance estimates renal plasma flow (RPF).
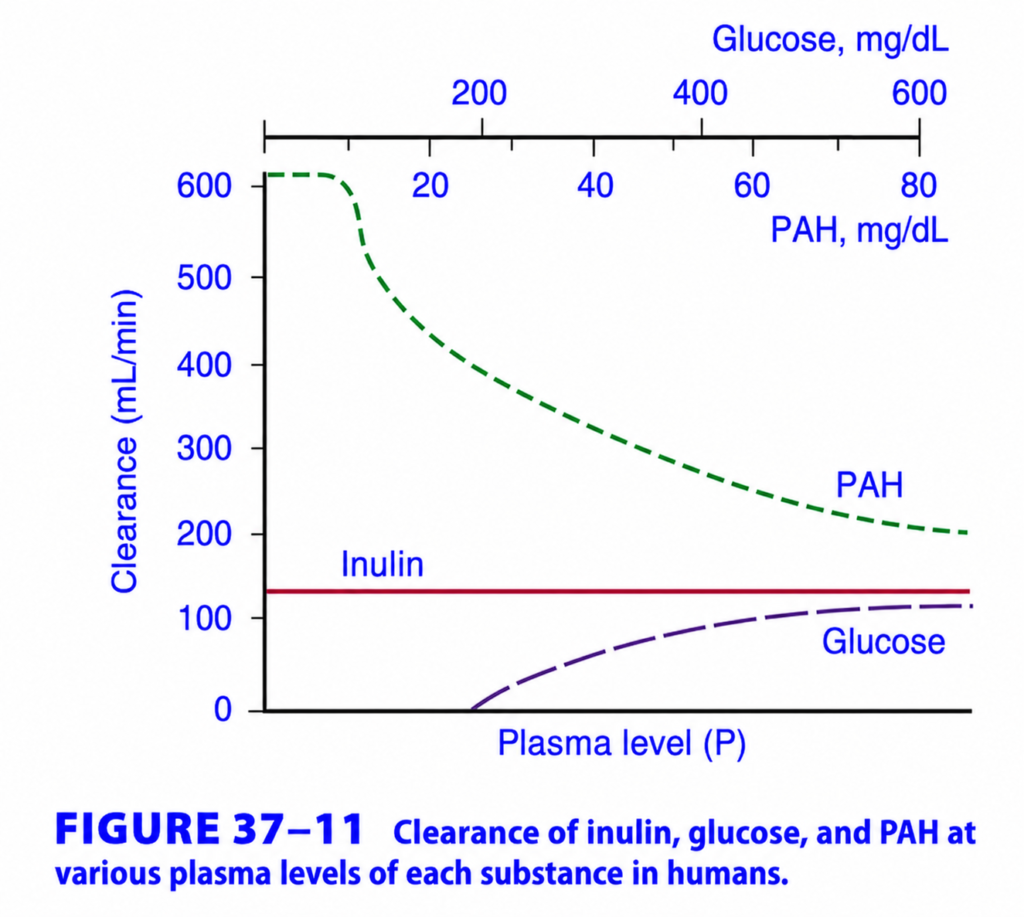
Clearance of Inulin, Glucose, and PAH (Figure 37–11) – Easy Conceptual Summary
This graph compares the renal clearance of Inulin, Glucose, and PAH as their plasma concentration increases.
It helps you understand which substance is filtered only, filtered and reabsorbed, or filtered and secreted.
Basic Concept of Clearance
What is Clearance?
Clearance is the volume of plasma that is completely cleared of a substance by the kidneys in one minute.
Formula
Clearance = (Urine concentration × Urine flow rate) ÷ Plasma concentration
Unit = mL/min
Golden Rule of Clearance
- Clearance = GFR
→ Substance is filtered only (Inulin) - Clearance < GFR
→ Substance is reabsorbed (Glucose) - Clearance > GFR
→ Substance is secreted (PAH)
Understanding the Axes
X-axis (Plasma Level, P)
Shows the concentration of each substance in plasma.
As we move to the right,
➡️ Plasma concentration increases.
Y-axis (Clearance)
Shows how much plasma is cleared of that substance each minute.
Higher curve
➡️ Greater clearance
Lower curve
➡️ Smaller clearance
Understanding Every Line
1. Red Line — Inulin
What happens?
The red line remains perfectly horizontal at about 125 mL/min.
Why?
Inulin is:
- Freely filtered
- Not reabsorbed
- Not secreted
Therefore,
Its clearance always equals the Glomerular Filtration Rate (GFR).
Even if plasma inulin increases,
The kidney continues filtering the same fraction of plasma.
So,
Its clearance remains constant.
Easy Concept
Imagine a water filter that always filters 125 mL every minute.
Whether the water contains a little dye or a lot of dye,
The filter still processes 125 mL/min.
Key Point
Inulin clearance = GFR (≈125 mL/min).2. Purple Dashed Line — Glucose
What happens?
Initially,
The clearance is zero.
As plasma glucose increases,
The clearance gradually rises.
However,
It never reaches the inulin clearance.
Why is clearance zero at first?
Normally,
All filtered glucose is reabsorbed in the proximal tubule.
Therefore,
No glucose appears in urine.
If nothing is excreted,
Its clearance is zero.
Why does clearance increase later?
As plasma glucose becomes very high,
The glucose transporters (SGLT) become saturated.
This is called the Transport Maximum (TmG).
Now,
Some glucose cannot be reabsorbed.
It appears in urine.
Therefore,
Clearance begins to increase.
Why does glucose clearance never equal inulin clearance?
Even after saturation,
Some glucose is still reabsorbed.
Since not all filtered glucose is excreted,
Its clearance always remains below GFR.
Easy Concept
Imagine 100 students entering a classroom.
Normally,
The teacher seats every student.
No one remains outside (urine).
If too many students arrive,
Some cannot get seats and remain outside.
As more students arrive,
More remain outside.
But some students are still getting seats.
Therefore,
Glucose clearance rises but never reaches the filtration rate.
3. Green Dashed Line — PAH
What happens?
Initially,
The clearance is very high,
about 600 mL/min.
As plasma PAH increases,
The clearance gradually decreases.
Why is PAH clearance so high initially?
PAH is:
- Filtered by the glomerulus.
- Actively secreted by the proximal tubule.
Almost all PAH entering the kidneys is removed in one passage.
Therefore,
Its clearance is almost equal to the Renal Plasma Flow (RPF).Why does PAH clearance decrease?
As plasma PAH increases,
The secretory transporters become saturated.
They cannot secrete additional PAH.
Now,
A smaller fraction of the plasma PAH is removed during each pass.
Therefore,
Clearance decreases.
Why does PAH clearance remain above inulin clearance?
Even after secretion reaches its transport maximum,
PAH is still filtered.
Some secretion also continues.
Therefore,
Its clearance remains greater than GFR.
Easy Concept
Imagine workers removing garbage from a conveyor belt.
Initially,
Workers remove almost every bag.
Later,
Too much garbage arrives.
Workers become fully occupied.
Now,
Some bags remain on the belt.
The removal efficiency decreases,
but it is still better than filtration alone.
Clinical Importance
Inulin
Used to measure:
Glomerular Filtration Rate (GFR)
Glucose
Normally,
Clearance = 0 mL/min
If glucose appears in urine,
It suggests:
- Diabetes mellitus
- Renal glycosuria
- Exceeded transport maximum (TmG)
PAH
Used to estimate:
Effective Renal Plasma Flow (ERPF)
Because almost all PAH is removed from plasma during one passage through the kidneys.
Comparison of the Three Curves
| Feature | Inulin | Glucose | PAH |
|---|---|---|---|
| Filtered | ✔ | ✔ | ✔ |
| Reabsorbed | ✘ | ✔ | ✘ |
| Secreted | ✘ | ✘ | ✔ |
| Clearance | Constant (≈125 mL/min) | Starts at 0, then rises | Very high initially, then decreases |
| Compared with GFR | = GFR | < GFR | > GFR |
| Clinical use | Measure GFR | Detect glucosuria/TmG | Estimate effective renal plasma flow (ERPF) |
Quick Memory Trick
Inulin = F
Filtered only
➡️ Clearance = GFR
Glucose = FR
Filtered + Reabsorbed
➡️ Clearance below GFR (normally zero)
PAH = FS
Filtered + Secreted
➡️ Clearance above GFR (approximates ERPF)
Key Concept
This graph illustrates how renal clearance reflects the kidney’s handling of different substances. Inulin is filtered only, so its clearance remains constant at the GFR (≈125 mL/min) regardless of plasma concentration. Glucose is filtered and almost completely reabsorbed, giving it a clearance of zero under normal conditions. As plasma glucose rises above the transport maximum (TmG), glucose begins to appear in urine, and its clearance increases but always remains below GFR because some glucose continues to be reabsorbed. PAH is filtered and actively secreted, so its clearance is initially very high and approximates the effective renal plasma flow (ERPF). As plasma PAH increases, the secretory transporters become saturated, causing PAH clearance to decrease, although it remains higher than inulin clearance because filtration continues. These three curves provide a simple way to distinguish substances that are filtered only, filtered and reabsorbed, or filtered and secreted.
prepare and made self learning by Dr sheen
