


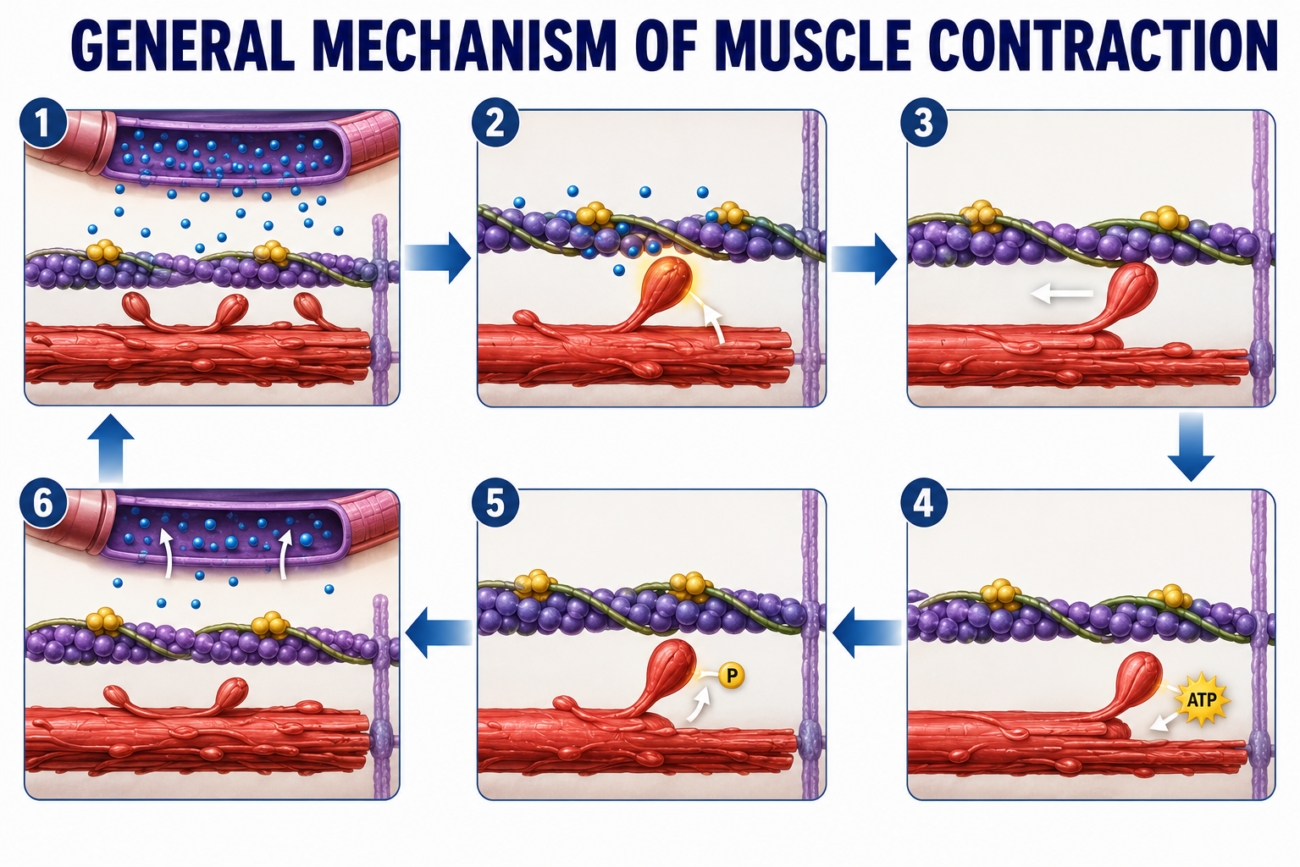
- An action potential travels along a motor nerve to its endings on the muscle fibers.
- At each nerve ending, a small amount of the neurotransmitter acetylcholine (ACh) is released.
- Acetylcholine acts on a local area of the muscle fiber membrane (sarcolemma).
- Acetylcholine opens acetylcholine-gated cation channels through protein molecules present in the membrane.
- The opened channels allow sodium ions (Na⁺) to rapidly diffuse into the muscle fiber.
- The entry of Na⁺ produces a local depolarization.
- This depolarization opens voltage-gated sodium channels.
- The opening of these channels initiates an action potential in the muscle fiber membrane.
- The action potential spreads along the entire muscle fiber membrane, just as it does in a nerve fiber.
- The action potential depolarizes the muscle membrane.
- The electrical signal travels through the T tubules to the deep interior of the muscle fiber (Fig. 6.3).
- This electrical signal causes the sarcoplasmic reticulum to release large amounts of stored Ca²⁺.
- The released Ca²⁺ ions create attractive forces between the actin and myosin filaments.
- As a result, the actin and myosin filaments slide past each other, producing muscle contraction.
- After a fraction of a second, the Ca²⁺ ions are pumped back into the sarcoplasmic reticulum by a Ca²⁺ membrane pump.
- The Ca²⁺ remains stored in the sarcoplasmic reticulum until the next muscle action potential arrives.
- The removal of Ca²⁺ from the myofibrils causes muscle contraction to stop.
KEY CONCEPT
- Muscle contraction begins when an action potential reaches the motor nerve ending.
- Acetylcholine is released and opens acetylcholine-gated cation channels.
- Na⁺ enters the muscle fiber, causing depolarization and generating a muscle action potential.
- The action potential travels along the sarcolemma and through the T tubules (Fig. 6.3).
- The sarcoplasmic reticulum releases Ca²⁺ into the muscle fiber.
- Ca²⁺ allows actin and myosin filaments to slide over each other, producing muscle contraction.
- Ca²⁺ is then pumped back into the sarcoplasmic reticulum, causing muscle relaxation.
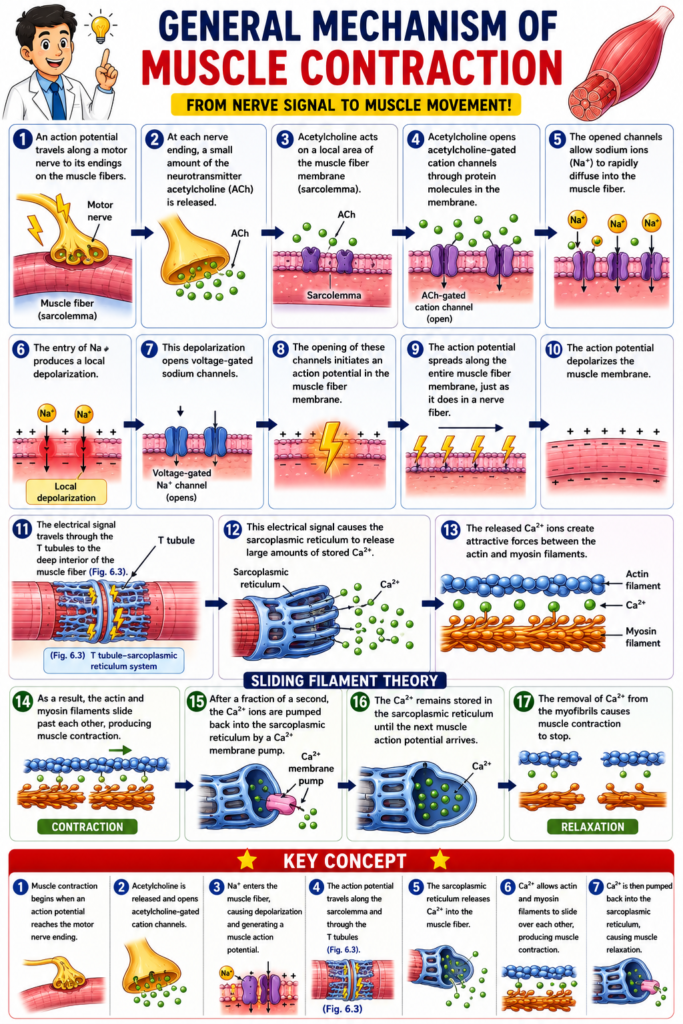
MOLECULAR MECHANISMS OF MUSCLE CONTRACTION
Muscle Contraction Occurs By a Sliding Filament Mechanism
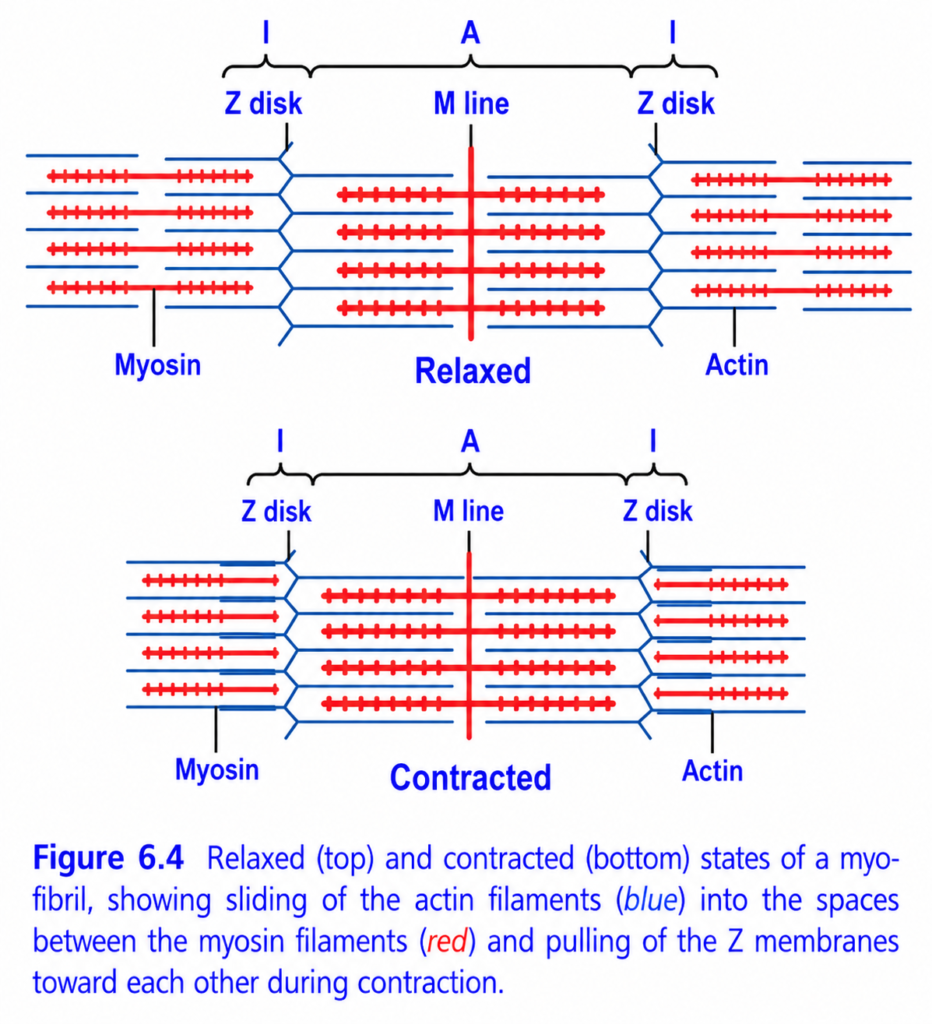
- Fig. 6.4 shows the basic mechanism of muscle contraction.
- The top of Fig. 6.4 shows a relaxed sarcomere.
- The bottom of Fig. 6.4 shows a contracted sarcomere.
- In the fully relaxed state:
- The actin filaments extending from two successive Z disks do not overlap each other.
- In the contracted state:
- The actin filaments are pulled inward between the myosin filaments.
- The ends of the actin filaments overlap each other to the maximum extent.
- The Z disks are pulled toward the ends of the myosin filaments by the actin filaments.
- Therefore, muscle contraction occurs by a sliding filament mechanism.
- The actin filaments slide inward because of the forces produced by the interaction between the myosin cross-bridges and the actin filaments.
- Under resting conditions, these forces are inactive.
- When an action potential travels along the muscle fiber, the sarcoplasmic reticulum releases large amounts of Ca²⁺.
- The released Ca²⁺ rapidly surrounds the myofibrils.
- The Ca²⁺ ions activate the interaction between the myosin and actin filaments.
- As a result, muscle contraction begins.
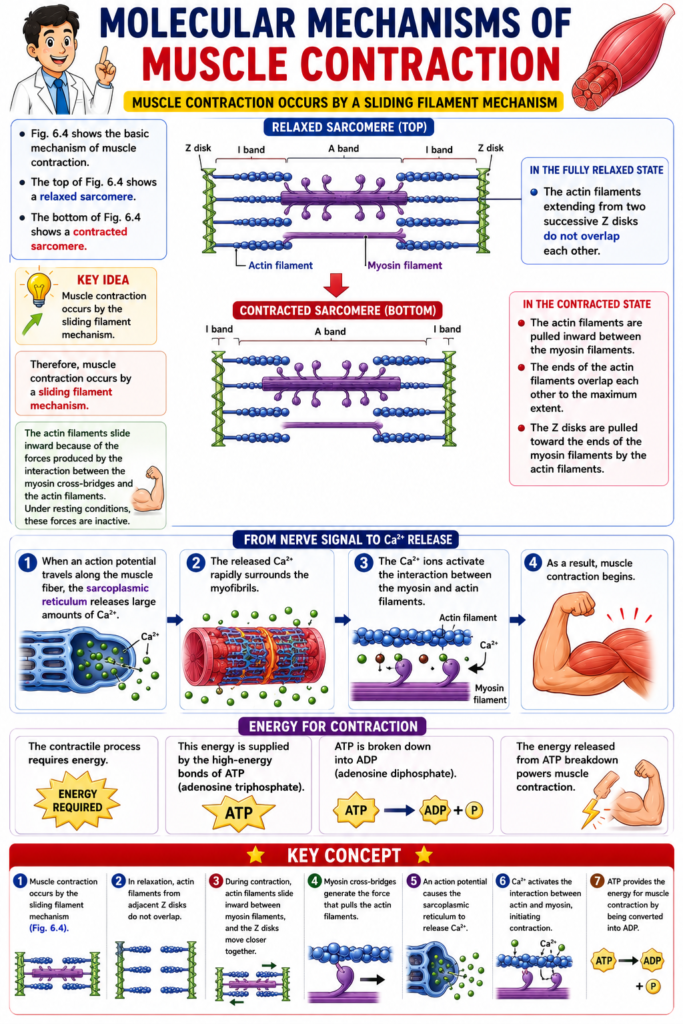
- The contractile process requires energy.
- This energy is supplied by the high-energy bonds of ATP (adenosine triphosphate).
- ATP is broken down into ADP (adenosine diphosphate).
- The energy released from ATP breakdown powers muscle contraction.
KEY CONCEPT
- Muscle contraction occurs by the sliding filament mechanism (Fig. 6.4).
- In relaxation, actin filaments from adjacent Z disks do not overlap.
- During contraction, actin filaments slide inward between myosin filaments, and the Z disks move closer together.
- Myosin cross-bridges generate the force that pulls the actin filaments.
- An action potential causes the sarcoplasmic reticulum to release Ca²⁺.
- Ca²⁺ activates the interaction between actin and myosin, initiating contraction.
- ATP provides the energy for muscle contraction by being converted into ADP.
Molecular Characteristics of the Contractile Filaments
Myosin Filaments Are Composed of Multiple Myosin Molecules
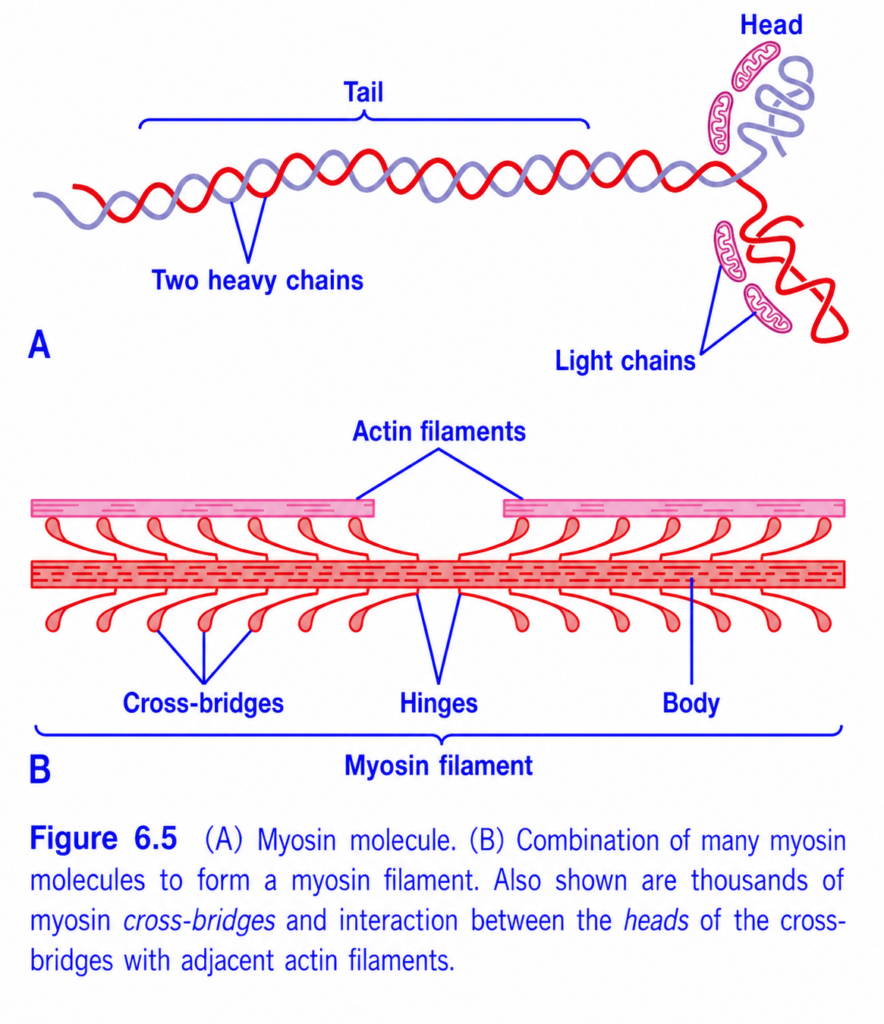
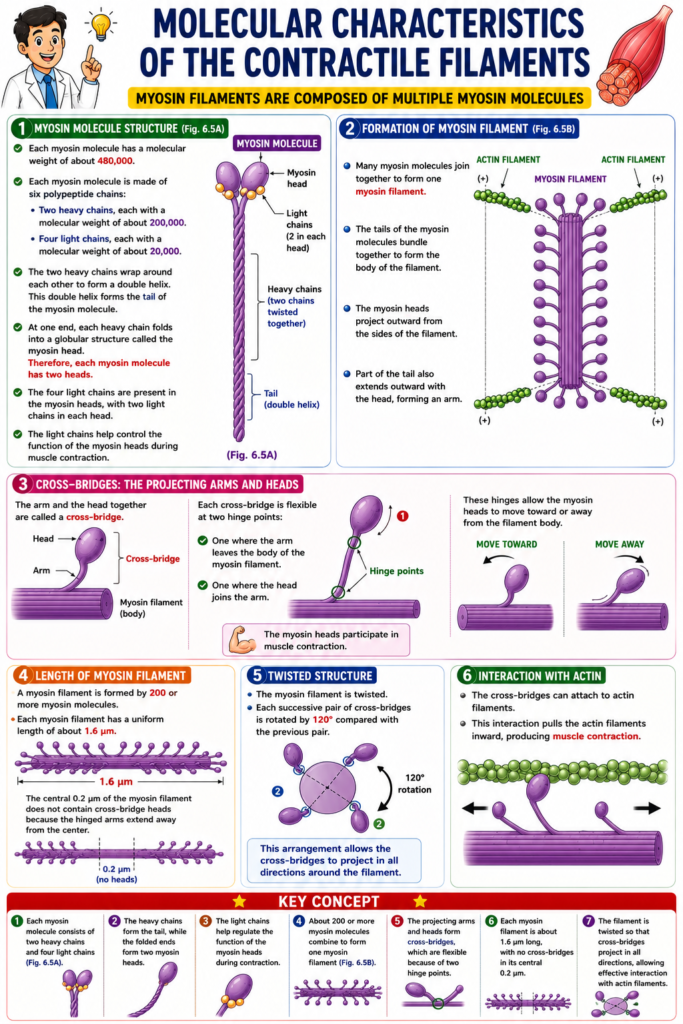
- Each myosin molecule has a molecular weight of about 480,000 (Fig. 6.5A).
- Fig. 6.5B shows:
- Many myosin molecules joining together to form one myosin filament.
- The interaction of the myosin filament with the ends of two actin filaments.
- Each myosin molecule is made of six polypeptide chains:
- Two heavy chains, each with a molecular weight of about 200,000.
- Four light chains, each with a molecular weight of about 20,000.
- The two heavy chains wrap around each other to form a double helix.
- This double helix forms the tail of the myosin molecule.
- At one end, each heavy chain folds into a globular structure called the myosin head.
- Therefore, each myosin molecule has two heads.
- The four light chains are present in the myosin heads, with two light chains in each head.
- The light chains help control the function of the myosin heads during muscle contraction.
- A myosin filament is formed by 200 or more myosin molecules.
- The tails of the myosin molecules bundle together to form the body of the myosin filament (Fig. 6.5B).
- The myosin heads project outward from the sides of the filament.
- Part of the tail also extends outward with the head, forming an arm.
- The arm and the head together are called a cross-bridge.
- Each cross-bridge is flexible at two hinge points:
- One where the arm leaves the body of the myosin filament.
- One where the head joins the arm.
- These hinges allow the myosin heads to move toward or away from the filament body.
- The myosin heads participate in muscle contraction.
- Each myosin filament has a uniform length of about 1.6 µm.
- The central 0.2 µm of the myosin filament does not contain cross-bridge heads.
- This is because the hinged arms extend away from the center.
- The myosin filament is twisted.
- Each successive pair of cross-bridges is rotated by 120° compared with the previous pair.
- This arrangement allows the cross-bridges to project in all directions around the filament.
KEY CONCEPT
- Each myosin molecule consists of two heavy chains and four light chains (Fig. 6.5A).
- The heavy chains form the tail, while the folded ends form two myosin heads.
- The light chains help regulate the function of the myosin heads during contraction.
- About 200 or more myosin molecules combine to form one myosin filament (Fig. 6.5B).
- The projecting arms and heads form cross-bridges, which are flexible because of two hinge points.
- Each myosin filament is about 1.6 µm long, with no cross-bridges in its central 0.2 µm.
- The filament is twisted so that cross-bridges project in all directions, allowing effective interaction with actin filaments.
Adenosine Triphosphatase Activity of the Myosin Head
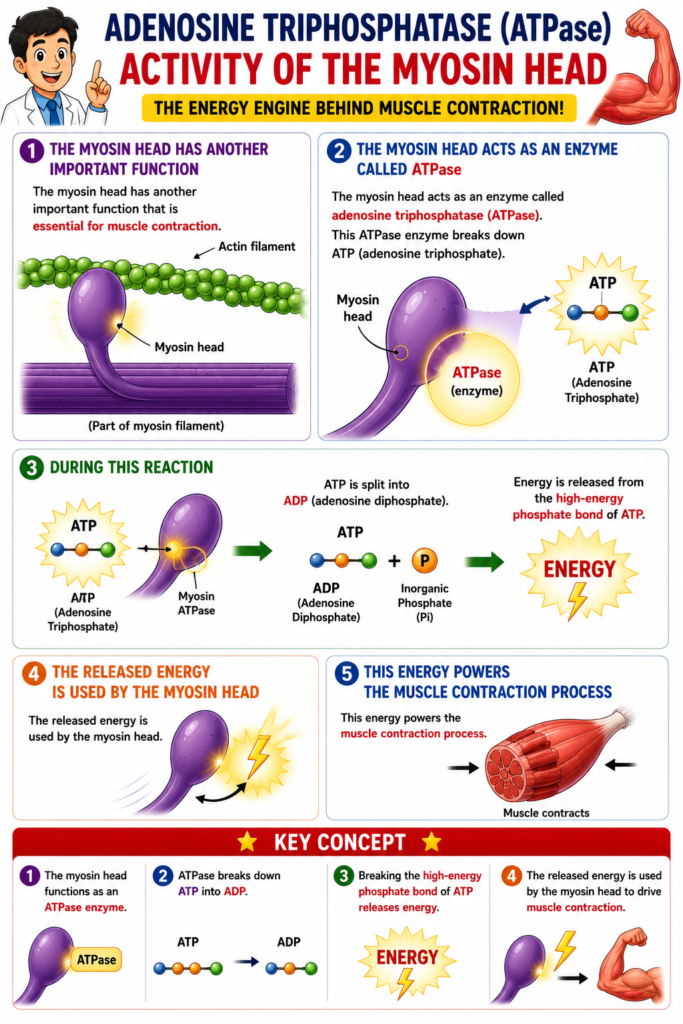
- The myosin head has another important function that is essential for muscle contraction.
- The myosin head acts as an enzyme called adenosine triphosphatase (ATPase).
- This ATPase enzyme breaks down ATP (adenosine triphosphate).
- During this reaction:
- ATP is split into ADP (adenosine diphosphate).
- Energy is released from the high-energy phosphate bond of ATP.
- The released energy is used by the myosin head.
- This energy powers the muscle contraction process.
KEY CONCEPT
- The myosin head functions as an ATPase enzyme.
- ATPase breaks down ATP into ADP.
- Breaking the high-energy phosphate bond of ATP releases energy.
- The released energy is used by the myosin head to drive muscle contraction.
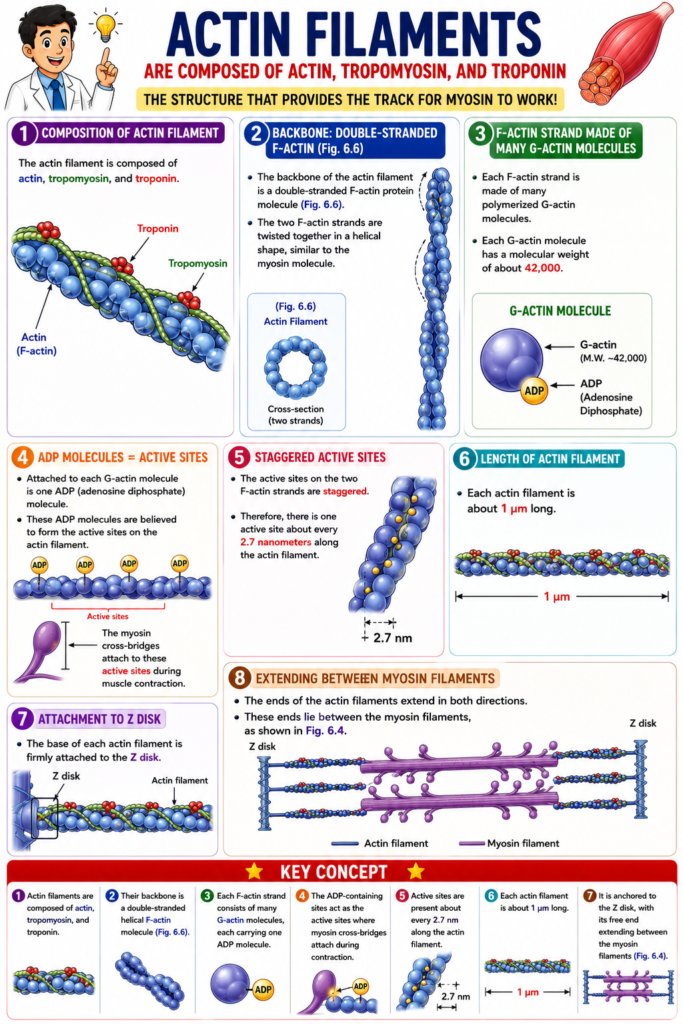
Actin Filaments Are Composed of Actin, Tropomyosin, and Troponin
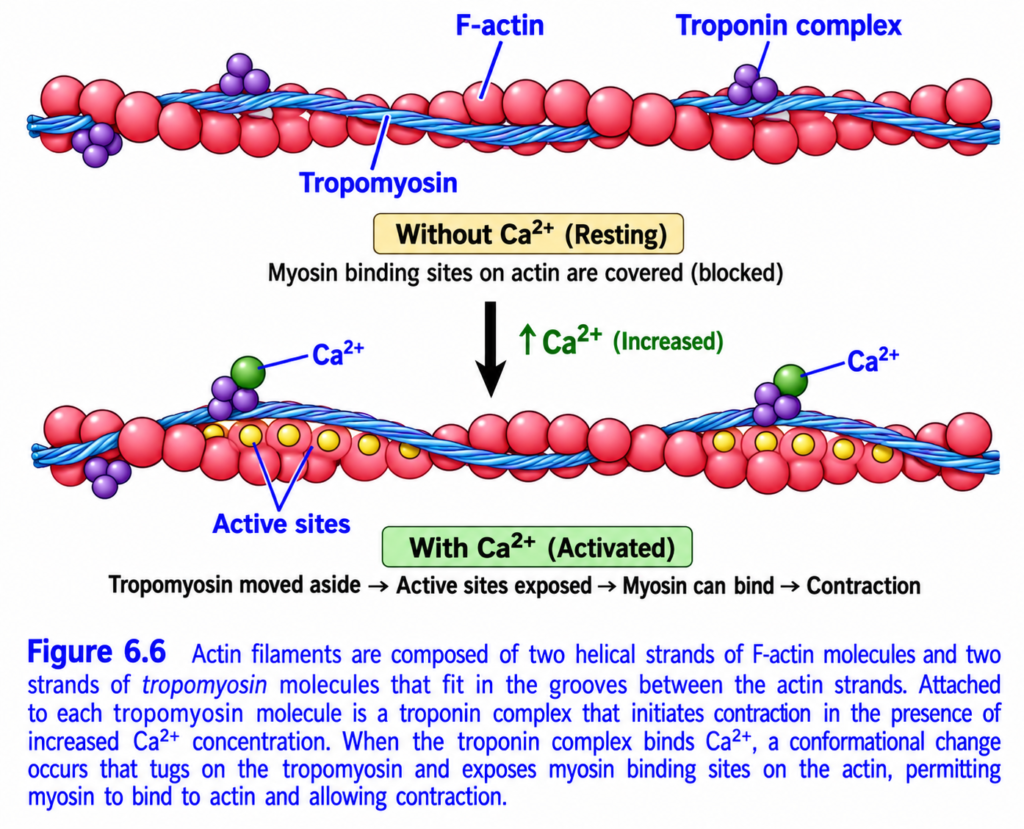
- The actin filament is composed of actin, tropomyosin, and troponin.
- The backbone of the actin filament is a double-stranded F-actin protein molecule (Fig. 6.6).
- The two F-actin strands are twisted together in a helical shape, similar to the myosin molecule.
- Each F-actin strand is made of many polymerized G-actin molecules.
- Each G-actin molecule has a molecular weight of about 42,000.
- Attached to each G-actin molecule is one ADP (adenosine diphosphate) molecule.
- These ADP molecules are believed to form the active sites on the actin filament.
- The myosin cross-bridges attach to these active sites during muscle contraction.
- The active sites on the two F-actin strands are staggered.
- Therefore, there is one active site about every 2.7 nanometers along the actin filament.
- Each actin filament is about 1 µm long.
- The base of each actin filament is firmly attached to the Z disk.
- The ends of the actin filaments extend in both directions.
- These ends lie between the myosin filaments, as shown in Fig. 6.4.
KEY CONCEPT
- Actin filaments are composed of actin, tropomyosin, and troponin.
- Their backbone is a double-stranded helical F-actin molecule (Fig. 6.6).
- Each F-actin strand consists of many G-actin molecules, each carrying one ADP molecule.
- The ADP-containing sites act as the active sites where myosin cross-bridges attach during contraction.
- Active sites are present about every 2.7 nm along the actin filament.
- Each actin filament is about 1 µm long and is anchored to the Z disk, with its free end extending between the myosin filaments (Fig. 6.4).
Tropomyosin Molecules
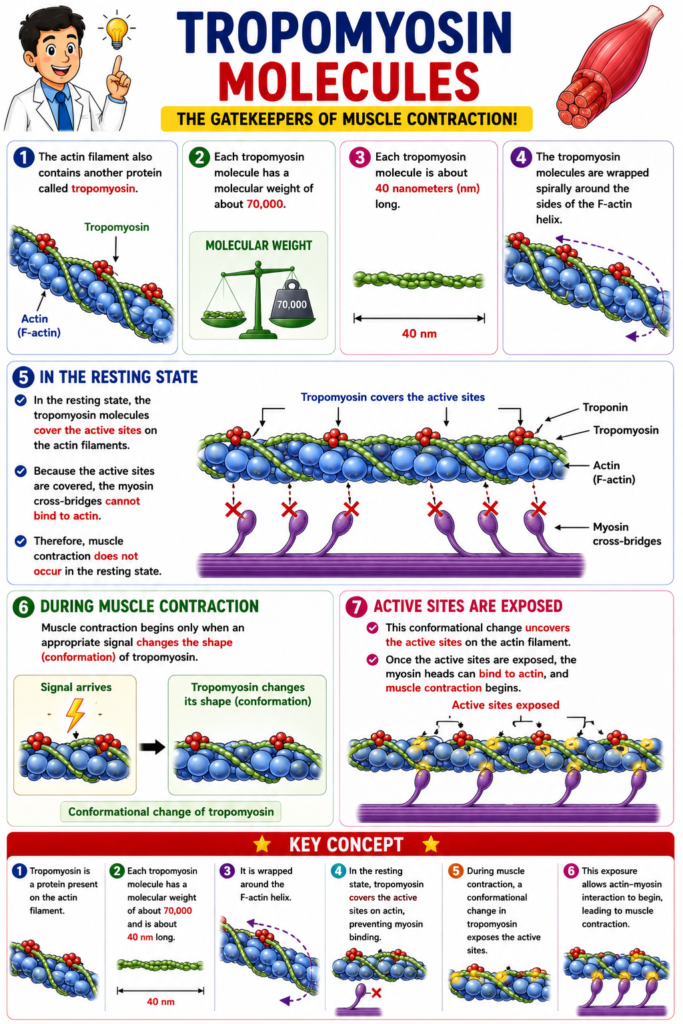
- The actin filament also contains another protein called tropomyosin.
- Each tropomyosin molecule has a molecular weight of about 70,000.
- Each tropomyosin molecule is about 40 nanometers (nm) long.
- The tropomyosin molecules are wrapped spirally around the sides of the F-actin helix.
- In the resting state, the tropomyosin molecules cover the active sites on the actin filaments.
- Because the active sites are covered, the myosin cross-bridges cannot bind to actin.
- Therefore, muscle contraction does not occur in the resting state.
- Muscle contraction begins only when an appropriate signal changes the shape (conformation) of tropomyosin.
- This conformational change uncovers the active sites on the actin filament.
- Once the active sites are exposed, the myosin heads can bind to actin, and muscle contraction begins.
KEY CONCEPT
- Tropomyosin is a protein present on the actin filament.
- Each tropomyosin molecule has a molecular weight of about 70,000 and is about 40 nm long.
- It is wrapped around the F-actin helix.
- In the resting state, tropomyosin covers the active sites on actin, preventing myosin binding.
- During muscle contraction, a conformational change in tropomyosin exposes the active sites, allowing actin–myosin interaction to begin.
Troponin and Its Role in Muscle Contraction
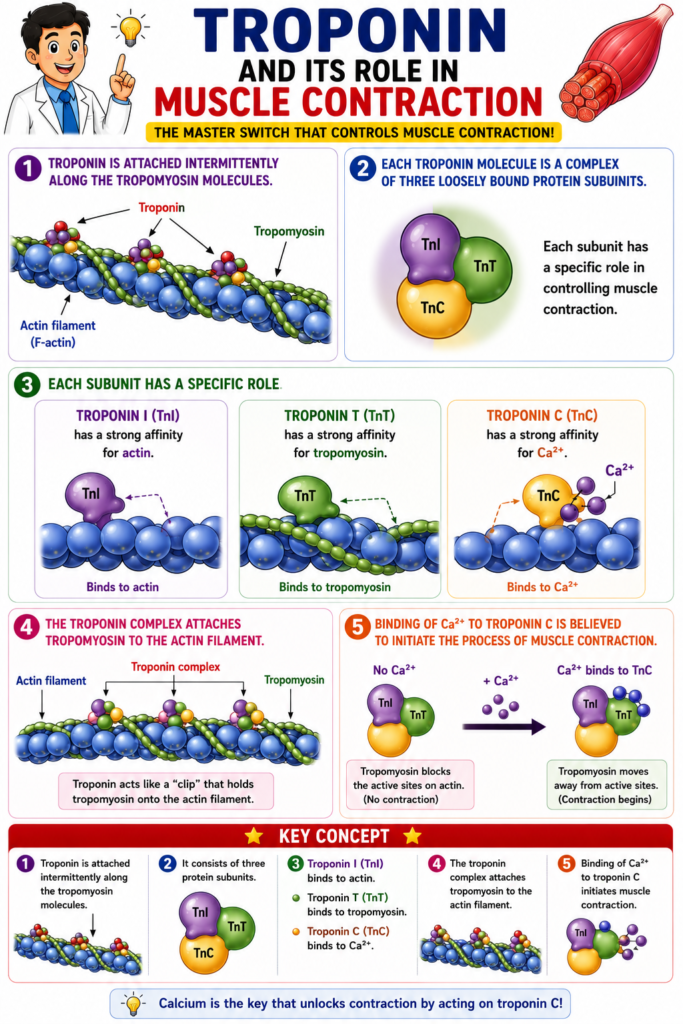
- Troponin is another protein attached at intervals along the sides of the tropomyosin molecules.
- Each troponin molecule is a complex of three loosely bound protein subunits.
- Each subunit has a specific role in controlling muscle contraction.
- Troponin I (TnI) has a strong affinity for actin.
- Troponin T (TnT) has a strong affinity for tropomyosin.
- Troponin C (TnC) has a strong affinity for Ca²⁺.
- The troponin complex attaches tropomyosin to the actin filament.
- The binding of Ca²⁺ to troponin C is believed to initiate the process of muscle contraction.
KEY CONCEPT
- Troponin is attached intermittently along the tropomyosin molecules.
- It consists of three protein subunits:
- Troponin I (TnI) binds to actin.
- Troponin T (TnT) binds to tropomyosin.
- Troponin C (TnC) binds to Ca²⁺.
- The troponin complex attaches tropomyosin to the actin filament.
- Binding of Ca²⁺ to troponin C initiates muscle contraction.
Interaction of One Myosin Filament, Two Actin Filaments, and Ca²⁺ to Cause Contraction
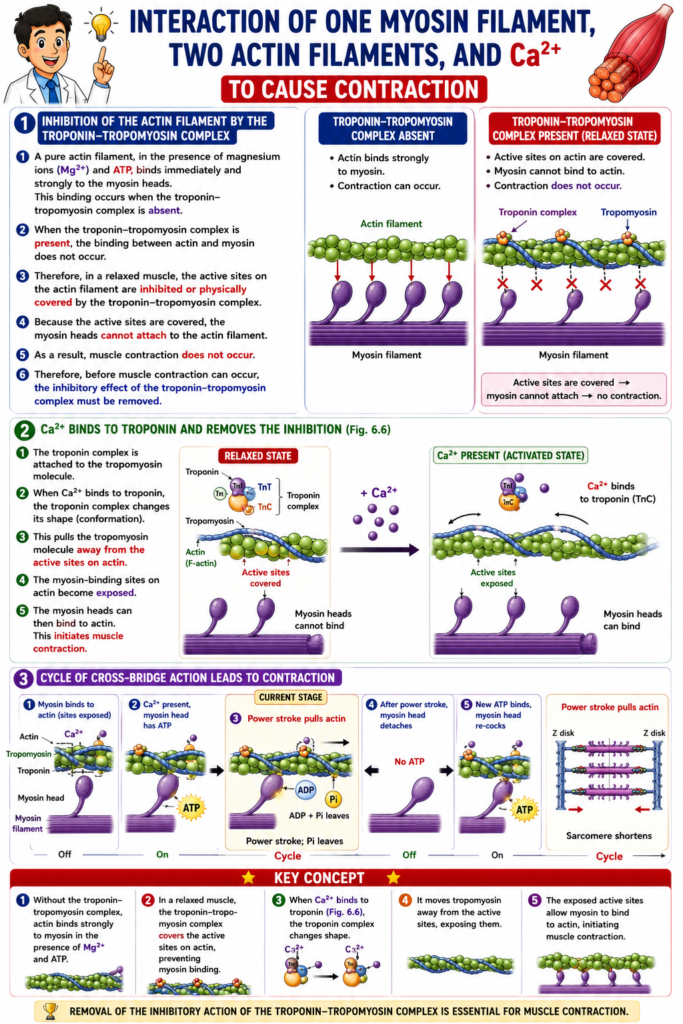
Inhibition of the Actin Filament By the Troponin–Tropomyosin Complex
- A pure actin filament, in the presence of magnesium ions (Mg²⁺) and ATP, binds immediately and strongly to the myosin heads.
- This binding occurs when the troponin–tropomyosin complex is absent.
- When the troponin–tropomyosin complex is present, the binding between actin and myosin does not occur.
- Therefore, in a relaxed muscle, the active sites on the actin filament are inhibited or physically covered by the troponin–tropomyosin complex.
- Because the active sites are covered, the myosin heads cannot attach to the actin filament.
- As a result, muscle contraction does not occur.
- Fig. 6.6 shows that:
- The troponin complex is attached to the tropomyosin molecule.
- When Ca²⁺ binds to troponin, the troponin complex changes its shape (conformation).
- This pulls the tropomyosin molecule away from the active sites on actin.
- The myosin-binding sites on actin become exposed.
- The myosin heads can then bind to actin.
- This initiates muscle contraction.
- Therefore, before muscle contraction can occur, the inhibitory effect of the troponin–tropomyosin complex must be removed.
KEY CONCEPT
- Without the troponin–tropomyosin complex, actin binds strongly to myosin in the presence of Mg²⁺ and ATP.
- In a relaxed muscle, the troponin–tropomyosin complex covers the active sites on actin, preventing myosin binding.
- When Ca²⁺ binds to troponin (Fig. 6.6), the troponin complex changes shape and moves tropomyosin away from the active sites.
- The exposed active sites allow myosin to bind to actin, initiating muscle contraction.
- Removal of the inhibitory action of the troponin–tropomyosin complex is essential for muscle contraction.
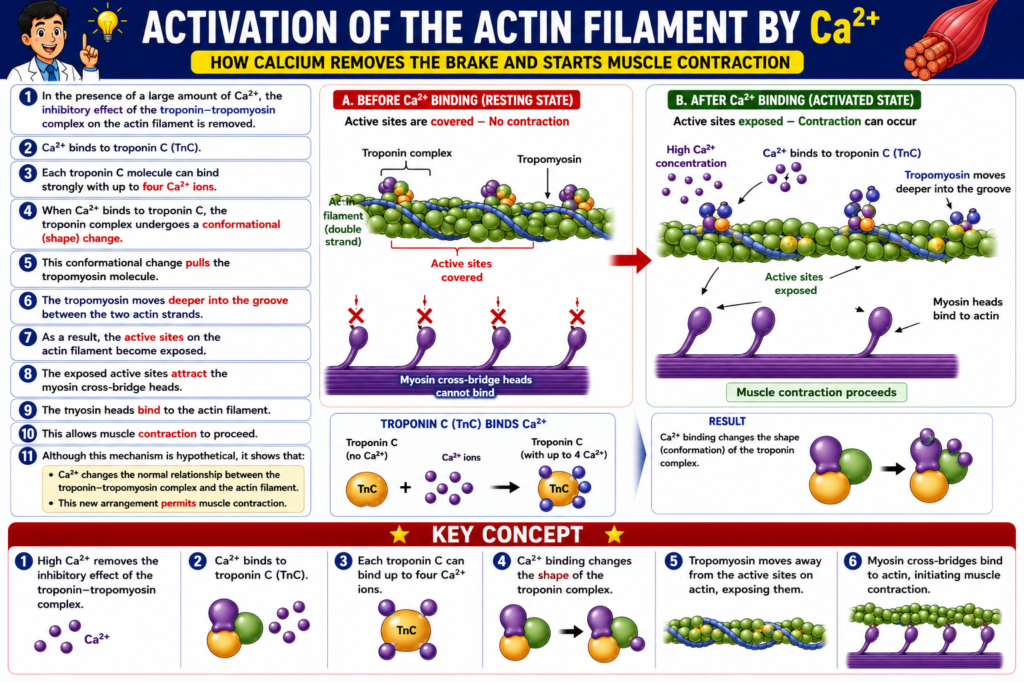
Activation of the Actin Filament By Ca²⁺
- In the presence of a large amount of Ca²⁺, the inhibitory effect of the troponin–tropomyosin complex on the actin filament is removed.
- Ca²⁺ binds to troponin C (TnC).
- Each troponin C molecule can bind strongly with up to four Ca²⁺ ions.
- When Ca²⁺ binds to troponin C, the troponin complex undergoes a conformational (shape) change.
- This conformational change pulls the tropomyosin molecule.
- The tropomyosin moves deeper into the groove between the two actin strands.
- As a result, the active sites on the actin filament become exposed.
- The exposed active sites attract the myosin cross-bridge heads.
- The myosin heads bind to the actin filament.
- This allows muscle contraction to proceed.
- Although this mechanism is hypothetical, it shows that:
- Ca²⁺ changes the normal relationship between the troponin–tropomyosin complex and the actin filament.
- This new arrangement permits muscle contraction.
KEY CONCEPT
- A high Ca²⁺ concentration removes the inhibitory effect of the troponin–tropomyosin complex.
- Ca²⁺ binds to troponin C, and each troponin C can bind up to four Ca²⁺ ions.
- Ca²⁺ binding changes the shape of the troponin complex.
- This moves tropomyosin away from the active sites on actin.
- The exposed active sites allow myosin cross-bridges to bind to actin, initiating muscle contraction.
- Ca²⁺ changes the troponin–tropomyosin–actin relationship into a state that permits contraction.
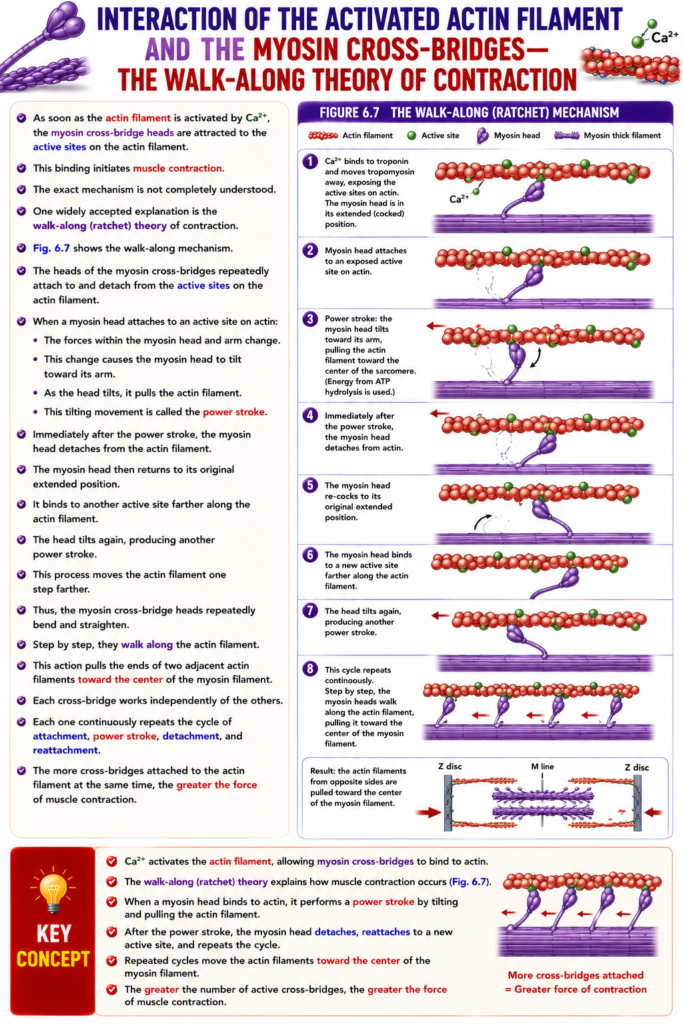
Interaction of the Activated Actin Filament and the Myosin Cross-Bridges—The Walk-Along Theory of Contraction
- As soon as the actin filament is activated by Ca²⁺, the myosin cross-bridge heads are attracted to the active sites on the actin filament.
- This binding initiates muscle contraction.
- The exact mechanism is not completely understood.
- One widely accepted explanation is the walk-along (ratchet) theory of contraction.
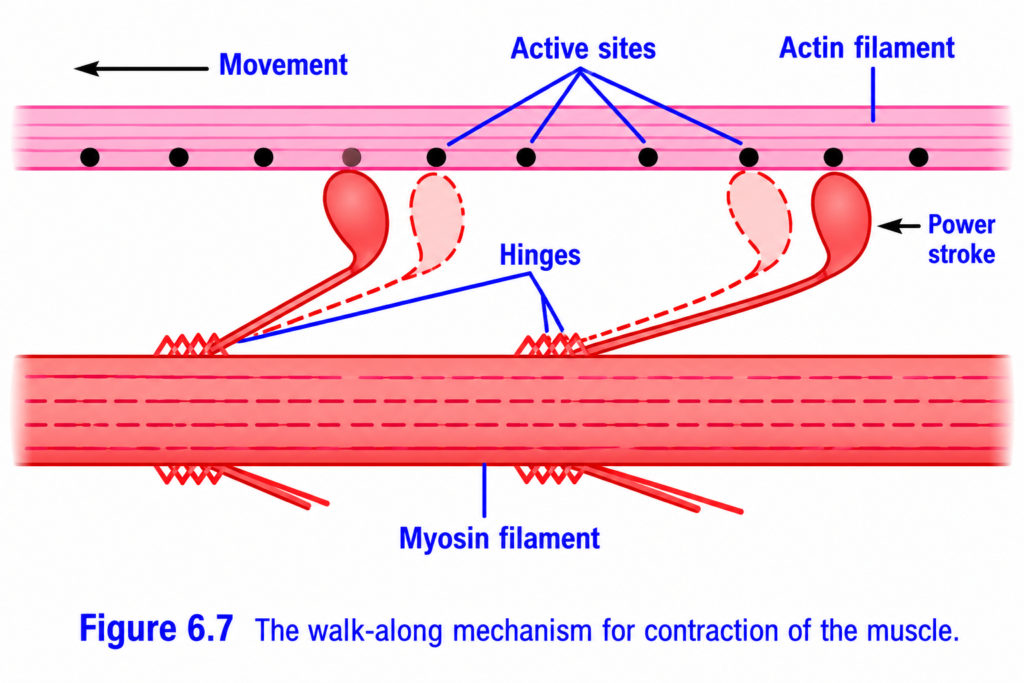
- Fig. 6.7 shows the walk-along mechanism.
- The heads of the myosin cross-bridges repeatedly attach to and detach from the active sites on the actin filament.
- When a myosin head attaches to an active site on actin:
- The forces within the myosin head and arm change.
- This change causes the myosin head to tilt toward its arm.
- As the head tilts, it pulls the actin filament.
- This tilting movement is called the power stroke.
- Immediately after the power stroke, the myosin head detaches from the actin filament.
- The myosin head then returns to its original extended position.
- It binds to another active site farther along the actin filament.
- The head tilts again, producing another power stroke.
- This process moves the actin filament one step farther.
- Thus, the myosin cross-bridge heads repeatedly bend and straighten.
- Step by step, they walk along the actin filament.
- This action pulls the ends of two adjacent actin filaments toward the center of the myosin filament.
- Each cross-bridge works independently of the others.
- Each one continuously repeats the cycle of attachment, power stroke, detachment, and reattachment.
- The more cross-bridges attached to the actin filament at the same time, the greater the force of muscle contraction.
KEY CONCEPT
- Ca²⁺ activates the actin filament, allowing myosin cross-bridges to bind to actin.
- The walk-along (ratchet) theory explains how muscle contraction occurs (Fig. 6.7).
- When a myosin head binds to actin, it performs a power stroke by tilting and pulling the actin filament.
- After the power stroke, the myosin head detaches, reattaches to a new active site, and repeats the cycle.
- Repeated cycles move the actin filaments toward the center of the myosin filament.
- The greater the number of active cross-bridges, the greater the force of muscle contraction.
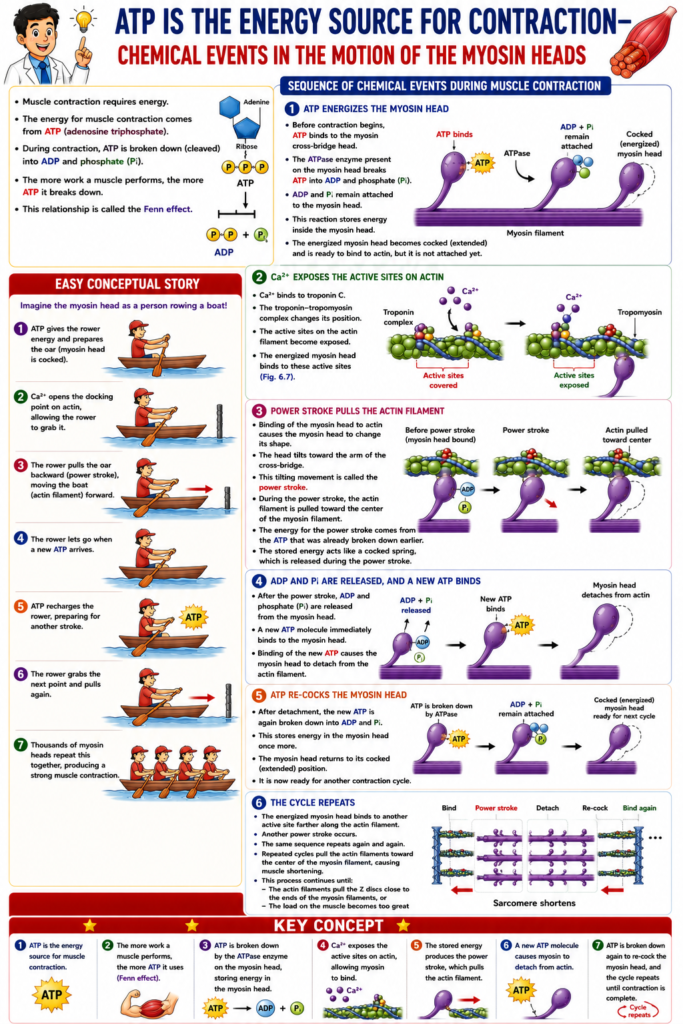
ATP Is the Energy Source for Contraction—Chemical Events in the Motion of the Myosin Heads
- Muscle contraction requires energy.
- The energy for muscle contraction comes from ATP (adenosine triphosphate).
- During contraction, ATP is broken down (cleaved) into ADP and phosphate (Pi).
- The more work a muscle performs, the more ATP it breaks down.
- This relationship is called the Fenn effect.
Sequence of Chemical Events During Muscle Contraction
1. ATP Energizes the Myosin Head
- Before contraction begins, ATP binds to the myosin cross-bridge head.
- The ATPase enzyme present on the myosin head breaks ATP into ADP and phosphate (Pi).
- ADP and Pi remain attached to the myosin head.
- This reaction stores energy inside the myosin head.
- The energized myosin head becomes cocked (extended) and is ready to bind to actin, but it is not attached yet.
2. Ca²⁺ Exposes the Active Sites on Actin
- Ca²⁺ binds to troponin C.
- The troponin–tropomyosin complex changes its position.
- The active sites on the actin filament become exposed.
- The energized myosin head binds to these active sites (Fig. 6.7).
3. Power Stroke Pulls the Actin Filament
- Binding of the myosin head to actin causes the myosin head to change its shape.
- The head tilts toward the arm of the cross-bridge.
- This tilting movement is called the power stroke.
- During the power stroke, the actin filament is pulled toward the center of the myosin filament.
- The energy for the power stroke comes from the ATP that was already broken down earlier.
- The stored energy acts like a cocked spring, which is released during the power stroke.
4. ADP and Pi Are Released, and a New ATP Binds
- After the power stroke, ADP and phosphate (Pi) are released from the myosin head.
- A new ATP molecule immediately binds to the myosin head.
- Binding of the new ATP causes the myosin head to detach from the actin filament.
5. ATP Re-cocks the Myosin Head
- After detachment, the new ATP is again broken down into ADP and Pi.
- This stores energy in the myosin head once more.
- The myosin head returns to its cocked (extended) position.
- It is now ready for another contraction cycle.
6. The Cycle Repeats
- The energized myosin head binds to another active site farther along the actin filament.
- Another power stroke occurs.
- The same sequence repeats again and again.
- Repeated cycles pull the actin filaments toward the center of the myosin filament, causing muscle shortening.
- This process continues until:
- The actin filaments pull the Z discs close to the ends of the myosin filaments, or
- The load on the muscle becomes too great for further shortening.
Easy Conceptual Story
Imagine the myosin head as a person rowing a boat:
- ATP gives the rower energy and prepares the oar (myosin head is cocked).
- Ca²⁺ opens the docking point on actin, allowing the rower to grab it.
- The rower pulls the oar backward (power stroke), moving the boat (actin filament) forward.
- The rower lets go when a new ATP arrives.
- ATP recharges the rower, preparing for another stroke.
- The rower grabs the next point and pulls again.
- Thousands of myosin heads repeat this together, producing a strong muscle contraction.
KEY CONCEPT
- ATP is the energy source for muscle contraction.
- The more work a muscle performs, the more ATP it uses (Fenn effect).
- ATP is broken down by the ATPase enzyme on the myosin head, storing energy in the myosin head.
- Ca²⁺ exposes the active sites on actin, allowing myosin to bind.
- The stored energy produces the power stroke, which pulls the actin filament.
- A new ATP molecule causes myosin to detach from actin.
- ATP is broken down again to re-cock the myosin head, and the cycle repeats until contraction is complete.
Amount of Actin and Myosin Filament Overlap Determines Tension Developed By the Contracting Muscle
- The force (tension) produced by a muscle depends on how much the actin and myosin filaments overlap.
- More effective overlap means more myosin cross-bridges can attach to actin, producing greater muscle tension.
- Too little overlap or too much overlap reduces the force of contraction.
Sarcomere Length and Muscle Tension (Fig. 6.8)
Point D – No Overlap (No Contraction)
- At Point D, the actin filament does not overlap the myosin filament.
- Therefore, myosin cross-bridges cannot bind to actin.
- No cross-bridge formation means no muscle tension.
- Tension = Zero.
From Point D to About 2.2 µm – Increasing Tension
- As the sarcomere shortens, the actin filament begins to overlap the myosin filament.
- More myosin cross-bridges attach to actin.
- As the number of cross-bridges increases, the muscle develops progressively greater tension.
- The maximum increase in tension occurs until the sarcomere reaches about 2.2 µm.
Around 2.2 µm – Maximum Cross-Bridge Formation
- At a sarcomere length of about 2.2 µm, the actin filament overlaps all the myosin cross-bridges.
- However, the actin filaments have not yet reached the center of the myosin filament.
- This produces maximum force of contraction.
Point B (About 2.0 µm) – Full Tension Maintained
- As the sarcomere shortens further to about 2.0 µm (Point B), the muscle still produces maximum tension.
- At this stage:
- All myosin cross-bridges are still attached to actin.
- The two actin filaments begin to overlap each other.
- Despite this overlap, maximum muscle tension is still maintained.
From Point B to Point A (2.0 → 1.65 µm) – Decreasing Tension
- As the sarcomere shortens from 2.0 µm to about 1.65 µm, the force of contraction decreases rapidly.
- This happens because:
- The actin filaments overlap each other more and more.
- The Z discs move very close to the ends of the myosin filaments.
- These changes interfere with normal cross-bridge action, reducing muscle tension.
Point A (About 1.65 µm) – Very Short Sarcomere
- At Point A, the Z discs touch the ends of the myosin filaments.
- The muscle cannot shorten effectively anymore.
- The force of contraction becomes much weaker.
Shorter Than Point A – Almost No Tension
- If the sarcomere shortens even further:
- The ends of the myosin filaments become crumpled (compressed).
- Cross-bridge movement becomes severely restricted.
- As a result, the force of contraction approaches zero.
- At this stage, the sarcomere has reached its shortest possible length.
Easy Conceptual Story
Imagine myosin as a person with many hands and actin as a rope.
- Point D: The rope is too far away, so none of the hands can grab it → No force.
- As the rope comes closer: More hands grab the rope → Force increases.
- Around 2.2–2.0 µm: Almost every hand is holding the rope → Maximum pulling force.
- Below 2.0 µm: The rope becomes folded and crowded, so the hands cannot pull efficiently → Force decreases.
- Below 1.65 µm: Everything becomes compressed, and the hands can hardly move → Almost no force.
KEY CONCEPT
- Muscle tension depends on the amount of overlap between actin and myosin filaments (Fig. 6.8).
- No overlap (Point D) → no cross-bridges → zero tension.
- Increasing overlap increases the number of cross-bridges and increases muscle tension.
- Maximum tension occurs at a sarcomere length of about 2.2–2.0 µm, where optimal actin–myosin overlap exists.
- Further shortening causes actin filaments to overlap each other and Z discs to approach the myosin filaments, reducing muscle tension.
- At very short sarcomere lengths, myosin filaments become compressed, and muscle tension approaches zero.
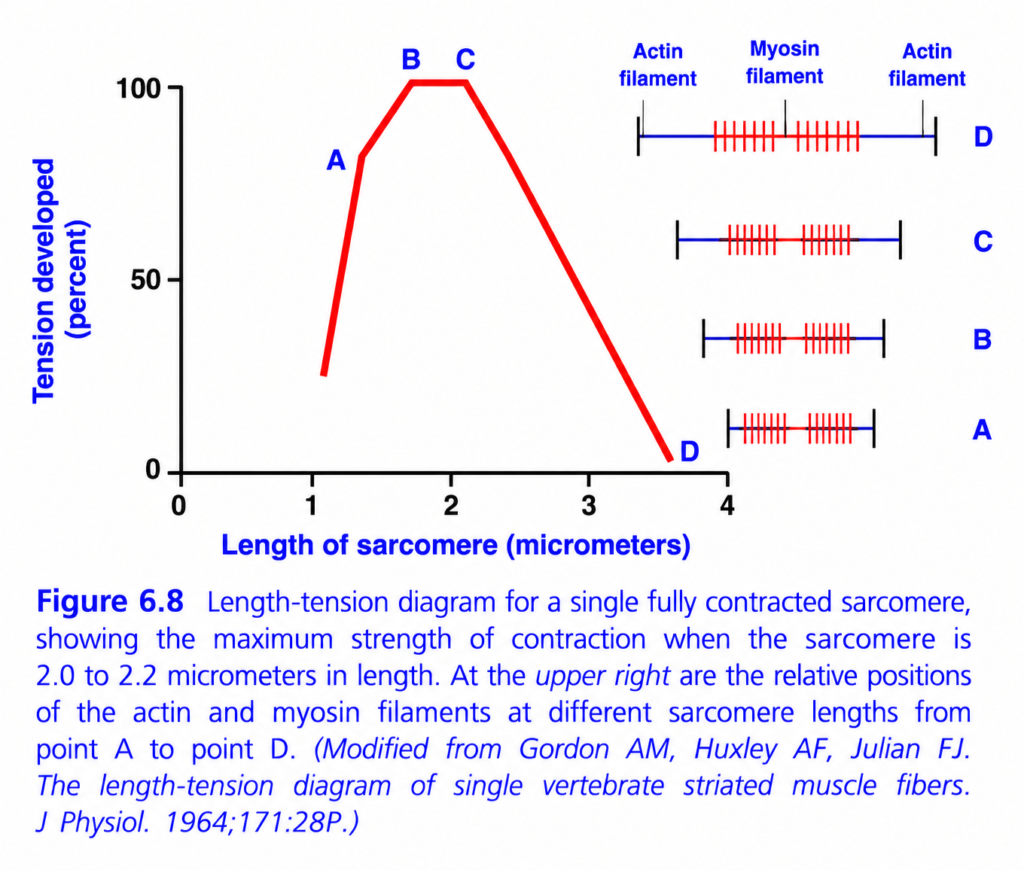
Length–Tension Relationship of a Sarcomere (Figure 6.8) – Easy Conceptual Summary
This figure explains one of the most important concepts in muscle physiology:
The force (tension) produced by a muscle depends on the length of its sarcomere before contraction.
It shows that a muscle produces maximum force only when the actin and myosin filaments overlap optimally.
Basic Concept
A sarcomere is the functional unit of skeletal muscle.
It contains:
- Thin filaments = Actin
- Thick filaments = Myosin
During contraction,
- Myosin heads attach to actin.
- Cross-bridges are formed.
- Actin slides over myosin.
- Muscle shortens and produces force.
Very Important Rule
👉 More effective actin-myosin overlap = More cross-bridges = Greater tension
But,
- Too much overlap is bad.
- Too little overlap is also bad.
Therefore,
There is an optimal sarcomere length for maximum contraction.
Understanding the Graph
X-axis (Length of Sarcomere, µm)
Shows the resting length of the sarcomere before contraction.
Moving to the right means:
➡️ Sarcomere becomes longer (stretched).
Y-axis (Tension Developed)
Shows the force produced during contraction.
Higher value
➡️ Stronger contraction.
Lower value
➡️ Weaker contraction.Understanding Every Point
The graph has four important points:
- A
- B
- C
- D
The pictures on the right show the arrangement of actin (blue) and myosin (red) at each point.Point A — Sarcomere is Too Short
Sarcomere length ≈ 1.2–1.5 µm
What happens?
The muscle develops only about 75–80% of maximum tension.
Why?
The sarcomere is excessively shortened.
The actin filaments from opposite sides overlap each other.
Some myosin heads cannot bind effectively.
Some myosin heads even press against the Z-discs.
Therefore,
Fewer effective cross-bridges are formed.
Easy Concept
Imagine two people pulling a rope.
If they stand too close together,
Their arms interfere with each other.
They cannot pull efficiently.
Key Point
Too much filament overlap decreases tension.
Point B — Optimal Length
Sarcomere length ≈ 2.0 µm
What happens?
Maximum tension is produced.
Why?
Actin and myosin overlap perfectly.
Almost every myosin head can attach to actin.
Maximum number of cross-bridges forms.
Therefore,
Maximum force develops.
Easy Concept
Imagine two pieces of Velcro.
When they overlap perfectly,
They stick with maximum strength.
Key Point
This is the ideal sarcomere length for contraction.
Point C — Slightly Longer but Still Optimal
Sarcomere length ≈ 2.2 µm
What happens?
Tension remains almost 100%.
Why?
The overlap is still ideal.
Almost all myosin heads continue to interact with actin.
Therefore,
Maximum force is maintained.ey Point
Maximum force occurs between 2.0 and 2.2 µm.
This is the optimal length-tension range.
Point D — Sarcomere is Too Long
Sarcomere length ≈ 3.6 µm
What happens?
Tension falls to zero.
Why?
The actin filaments are too far away from the myosin filaments.
There is no overlap.
Without overlap,
No cross-bridges can form.
Without cross-bridges,
No contraction occurs.
Easy Concept
Imagine trying to shake hands with someone standing several meters away.
No contact is possible.
Similarly,
Actin and myosin cannot interact.
Key Point
No overlap = No cross-bridges = No force.
Why Does the Curve Rise?
From A → B,
The sarcomere length increases.
Excessive overlap decreases.
More myosin heads gain access to actin.
More cross-bridges form.
Therefore,
Tension increases.
Why Does the Curve Become Flat?
From B → C,
The overlap remains optimal.
Nearly every myosin head can bind to actin.
Therefore,
Maximum tension is maintained.
Why Does the Curve Fall?
From C → D,
The sarcomere continues to stretch.
The overlap between actin and myosin decreases.
Fewer cross-bridges form.
Therefore,
Tension decreases steadily.
Eventually,
There is no overlap,
and tension becomes zero.
Understanding the Pictures on the Right
A
- Actin filaments overlap each other.
- Myosin heads are crowded.
- Some cross-bridges cannot form.
➡️ Moderate tension.
B
- Perfect overlap.
- Nearly all myosin heads contact actin.
➡️ Maximum tension.
- Slightly longer than B.
- Overlap remains optimal.
➡️ Maximum tension.
D
- Actin no longer overlaps with myosin.
- No cross-bridges.
➡️ Zero tension.
Clinical Importance
1. Skeletal Muscle
Normally contracts near the optimal sarcomere length (2.0–2.2 µm), allowing maximum force generation.
2. Cardiac Muscle
Cardiac muscle usually operates at shorter-than-optimal lengths.
When ventricular filling increases (greater end-diastolic volume), sarcomeres stretch closer to the optimal length.
More effective cross-bridges form, producing a stronger contraction.
This is the basis of the Frank–Starling mechanism.
3. Overstretching a Muscle
If a muscle is overstretched,
Actin and myosin overlap decreases.
Force generation falls.
This explains why an excessively stretched muscle feels weak.
Quick Memory Table
| Point | Sarcomere Length | Actin–Myosin Overlap | Tension |
|---|---|---|---|
| A | Too short | Excessive overlap; actin overlaps actin | Moderate (≈75–80%) |
| B | ~2.0 µm | Ideal overlap | Maximum (100%) |
| C | ~2.2 µm | Still ideal overlap | Maximum (100%) |
| D | ~3.6 µm | No overlap | Zero |
Easy Memory Trick
“Too Short → Too Crowded”
- Excessive overlap
- Cross-bridge interference
- Less force
“Just Right → Maximum Might”
- Optimal overlap
- Maximum cross-bridges
- Maximum tension
“Too Long → Too Far”
- No overlap
- No cross-bridges
- No contraction
Key Concept
The length–tension relationship shows that the force generated by a skeletal muscle depends on its initial sarcomere length. At short sarcomere lengths (Point A), excessive overlap of actin filaments and compression of myosin against the Z-discs reduce the number of effective cross-bridges, resulting in less than maximal tension. At 2.0–2.2 µm (Points B and C), actin and myosin have optimal overlap, allowing the greatest number of cross-bridges to form and producing maximum tension. As the sarcomere is stretched beyond this optimal range toward Point D, overlap progressively decreases, fewer cross-bridges can form, and tension declines. When there is no overlap between actin and myosin, no cross-bridges are formed and muscle tension falls to zero. This relationship explains why muscles generate the greatest force at an optimal resting length and underlies important physiological principles such as the Frank–Starling mechanism of the heart.
Effect of Muscle Length on Force of Contraction in the Whole Intact Muscle
- Fig. 6.9 shows the relationship between muscle length and force of contraction in the whole intact muscle.
- This graph is similar to Fig. 6.8, which shows the relationship for a single muscle fiber.
- However, the graph in Fig. 6.9 represents the entire muscle, not just one muscle fiber.
Why Is the Whole Muscle Curve Different?
- The whole muscle contains a large amount of connective tissue.
- Also, all sarcomeres in different parts of the muscle do not shorten by exactly the same amount.
- Because of these factors, the shape of the curve is slightly different from that of a single muscle fiber.
- However, the overall pattern remains the same.
Normal Resting Length Produces Maximum Force
- In a normal resting muscle, the sarcomere length is about 2.0 µm.
- At this length, the actin and myosin filaments have nearly optimal overlap.
- Therefore, when the muscle is stimulated, it produces almost the maximum possible force of contraction.
Active Tension
- The extra force produced when a resting muscle contracts is called active tension.
- Active tension is the difference between the force before contraction and the force during contraction.
- At the normal resting length (about 2.0 µm), active tension is greatest.
Stretching the Muscle Reduces Active Tension
- If the muscle is stretched beyond its normal resting length (sarcomere length greater than about 2.2 µm):
- The overlap between actin and myosin decreases.
- Fewer myosin cross-bridges can attach to actin.
- Therefore, the force produced during contraction decreases.
- This decrease in active tension is shown in Fig. 6.9 by the shorter arrow at longer muscle lengths.
Easy Conceptual Story
Imagine two people pulling a rope together.
- At the correct distance (normal resting length), both people can hold the rope firmly, so they pull with maximum force.
- If they move too far apart (muscle stretched):
- They cannot grip the rope properly.
- Their pulling force decreases.
- Similarly, when a muscle is stretched beyond its normal length, there is less actin–myosin overlap, so less force is produced.
KEY CONCEPT
- Fig. 6.9 shows the relationship between muscle length and force in the whole intact muscle.
- The whole muscle curve is slightly different from a single muscle fiber because of connective tissue and unequal shortening of sarcomeres.
- At the normal resting sarcomere length (about 2.0 µm), the muscle produces nearly maximum active tension.
- Active tension is the increase in force produced during muscle contraction.
- Stretching the muscle beyond about 2.2 µm decreases actin–myosin overlap, reducing the number of cross-bridges and lowering active tension.
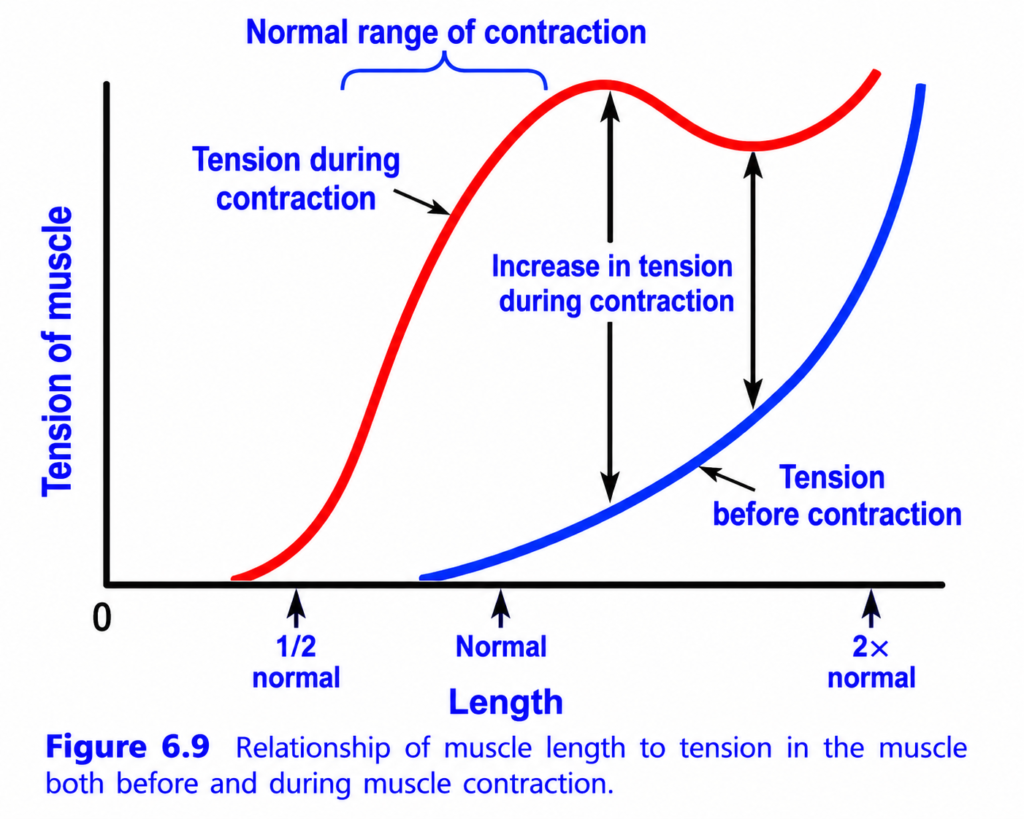
Relationship Between Muscle Length and Tension Before and During Contraction (Figure 6.9) – Easy Conceptual Summary
This figure explains how the force (tension) produced by a whole muscle changes as its length changes.
Unlike the previous graph (Figure 6.8), which showed only active tension of a single sarcomere, this graph shows both passive tension (before contraction) and total tension (during contraction) of the whole muscle.
The figure contains two curves:
- 🔵 Blue Curve = Tension before contraction (Passive Tension)
- 🔴 Red Curve = Tension during contraction (Total Tension = Passive + Active Tension)
The difference between the red and blue curves represents the active tension produced by muscle contraction.
Basic Concept
A muscle develops two types of tension:
1. Passive Tension
Produced before muscle contraction.
It develops when a muscle is stretched.
It is caused by stretching of:
- Connective tissue
- Tendons
- Sarcolemma
- Titin protein
No actin-myosin cross-bridges are involved.
2. Active Tension
Produced during muscle contraction.
It results from:
- Actin-myosin interaction
- Cross-bridge formation
- Sliding filament mechanism
3. Total Tension
This is the force measured during contraction.
Formula
Total Tension = Passive Tension + Active Tension
Understanding the Axes
X-axis (Length)
Shows muscle length.
From left to right:
Y-axis (Tension of Muscle)
Shows the force produced by the muscle.
Higher curve
➡️ Greater tension
Lower curve
➡️ Less tension
Understanding Every Curve
1. Blue Curve — Passive Tension (Before Contraction)
What happens?
At short muscle lengths,
The blue curve remains almost at zero.
As the muscle is stretched,
The blue curve rises slowly.
With further stretching,
It rises very steeply.
Why?
Initially,
The muscle is relaxed.
Its elastic tissues are loose.
Therefore,
Almost no tension is present.
As stretching continues,
The elastic tissues become tighter.
They resist further stretching.
This resistance appears as passive tension.
Easy Concept
Imagine stretching a rubber band.
Initially,
It stretches easily.
As you continue stretching,
It becomes tighter and harder to pull.
That increasing resistance is passive tension.
Key Point
Passive tension depends only on stretching, not contraction.
2. Red Curve — Total Tension During Contraction
What happens?
The red curve has three phases:
- Rapid rise
- Peak
- Gradual fall followed by another rise
Phase 1 – Rapid Rise
What happens?
As muscle length increases from a very short length,
The red curve rises rapidly.
Why?
At very short lengths,
Actin filaments overlap excessively.
Some myosin heads cannot bind effectively.
As the muscle is stretched toward its normal resting length,
Actin and myosin overlap becomes optimal.
More cross-bridges form.
Therefore,
Tension increases rapidly.
Easy Concept
Think of two strips of Velcro.
When they are too compressed,
They cannot grip properly.
Stretch them slightly,
and they attach perfectly.
Phase 2 – Maximum Tension
What happens?
The red curve reaches its highest point.
This occurs within the normal range of contraction shown by the bracket.
Why?
At this length,
Actin and myosin overlap is optimal.
Almost every myosin head can attach to actin.
Maximum cross-bridges are formed.
Therefore,
Maximum active tension develops.
Key Point
Normal skeletal muscle usually contracts within this optimal range.
Phase 3 – Decline in Tension
What happens?
As the muscle is stretched beyond the optimal length,
The red curve begins to fall.
Why?
Stretching reduces overlap between actin and myosin.
Fewer cross-bridges can form.
Therefore,
Active tension decreases.
Easy Concept
Imagine two people trying to shake hands.
As they move farther apart,
It becomes harder to reach each other.
Eventually,
They cannot touch.
Similarly,
Actin and myosin cannot interact effectively.
Why Does the Red Curve Rise Again at Very Long Lengths?
Near twice the normal muscle length,
The red curve rises again.Why?
At this stage,
Active tension is actually very low.
However,
Passive tension becomes extremely high because the muscle’s elastic tissues are stretched tightly.
Since:
Total Tension = Active + Passive
The rapidly increasing passive tension causes the total tension to rise again.
Easy Concept
Imagine pulling a very tight spring.
The spring itself produces a large resisting force,
even if the muscle fibers are no longer generating much active force.
Understanding the Vertical Arrows
The vertical arrows represent:
Increase in Tension During Contraction
This is the difference between the red curve and the blue curve.
This difference equals:
Active Tension
At Normal Muscle Length
The gap is largest.
Therefore,
Active tension is maximum.
At Very Long Muscle Length
The gap becomes smaller.
Passive tension increases,
but active tension decreases because actin and myosin overlap is reduced.
Understanding the Normal Range of Contraction
The bracket labeled Normal range of contraction indicates the length range in which skeletal muscles normally operate.
Within this range:Clinical Importance
1. Skeletal Muscle
Normally functions near its resting length.
This allows maximum active tension during daily activities.2. Cardiac Muscle
The heart usually works below its optimal length.
When more blood enters the ventricles,
Muscle fibers stretch closer to the optimal length.
This increases active tension and stroke volume.
This is the Frank–Starling mechanism.
3. Overstretching
If a muscle is stretched too much:
- Active tension decreases because cross-bridge formation is reduced.
- Passive tension increases because elastic tissues resist stretching.
Comparison of the Two Curves
| Feature | Blue Curve (Passive Tension) | Red Curve (Total Tension During Contraction) |
|---|---|---|
| Produced by | Elastic tissues (titin, connective tissue, tendons) | Passive tension + active contraction |
| Present before contraction | ✔ Yes | ✘ No (measured during contraction) |
| Cross-bridges required | ✘ No | ✔ Yes (for the active component) |
| Effect of stretching | Increases continuously | Rises to a peak, falls as active tension decreases, then rises again because passive tension dominates |
Quick Memory Table
| Muscle Length | Passive Tension | Active Tension | Total Tension |
|---|---|---|---|
| Very Short | Very low | Low (too much filament overlap) | Low |
| Normal Length | Low | Maximum | Maximum |
| Moderately Stretched | Moderate | Decreasing | Moderate |
| Very Long | Very high | Very low | Increases again because passive tension becomes dominant |
Easy Memory Trick
Blue Curve = “Before”
- Before contraction
- Stretch only
- Passive tension
- Elastic tissues
Red Curve = “During”
- During contraction
- Active + Passive tension
- Maximum near normal muscle length
Greatest Gap Between Red and Blue = Greatest Active Tension
The vertical distance between the red and blue curves represents the force produced by actin-myosin cross-bridges. The larger the gap, the greater the active tension.
Key Concept
This figure demonstrates that a whole muscle develops passive tension, active tension, and total tension. The blue curve represents passive tension, which is present before contraction and increases as the muscle is stretched because of the elastic properties of titin, connective tissue, and tendons. The red curve represents the total tension during contraction, which equals active tension plus passive tension. Active tension is greatest at the normal resting muscle length, where actin and myosin have optimal overlap, allowing the maximum number of cross-bridges to form. As the muscle is stretched beyond this optimal length, active tension decreases because filament overlap is reduced. However, passive tension increases sharply with further stretching, causing the total tension to rise again even though active force is falling. Thus, the vertical distance between the red and blue curves represents active tension, and it is largest at the normal muscle length, where skeletal muscle generates its greatest force.
Relation of Velocity of Contraction to Load
- The speed (velocity) of muscle contraction depends on the load (weight or resistance) against which the muscle contracts.
- The lighter the load, the faster the muscle contracts.
- The heavier the load, the slower the muscle contracts.
Contraction Without a Load
- When a skeletal muscle contracts without any load, it shortens very rapidly.
- An average skeletal muscle reaches full contraction in about 0.1 second.
- Since nothing opposes the contraction, the muscle shortens at its maximum velocity.
Effect of Increasing Load
- As more load is applied to the muscle, the velocity of contraction decreases progressively (Fig. 6.10).
- This means:
- Small load → Fast contraction
- Moderate load → Slower contraction
- Heavy load → Very slow contraction
Maximum Load
- If the load becomes equal to the maximum force that the muscle can produce:
- The velocity of contraction becomes zero.
- The muscle cannot shorten, even though it is fully activated.
- This is called an isometric contraction, where:
- The muscle develops tension.
- But its length does not change.
Why Does Velocity Decrease With Increasing Load?
- A load acts as a force that opposes muscle contraction.
- This opposing force is called a reverse force.
- As the load increases, more of the muscle’s force is used to overcome the resistance.
- Therefore, less force remains to shorten the muscle.
- As a result, the velocity of shortening decreases.
Easy Conceptual Story
Imagine lifting different objects with your arm.
- No object in your hand: You can move your arm very quickly.
- A light book: You can still lift it fast.
- A heavy suitcase: You lift it slowly.
- An object that is too heavy: Your muscles become tense, but you cannot lift it at all.
The same thing happens in skeletal muscle:
- No load → Maximum speed
- Light load → Fast speed
- Heavy load → Slow speed
- Maximum load → No shortening
KEY CONCEPT
- The velocity of muscle contraction is inversely related to the load (Fig. 6.10).
- Without a load, a skeletal muscle contracts rapidly and reaches full contraction in about 0.1 second.
- As the load increases, the velocity of contraction decreases progressively.
- When the load equals the maximum force the muscle can generate, the velocity becomes zero, and the muscle cannot shorten despite being activated.
- A heavier load opposes the contractile force, leaving less net force available for muscle shortening.
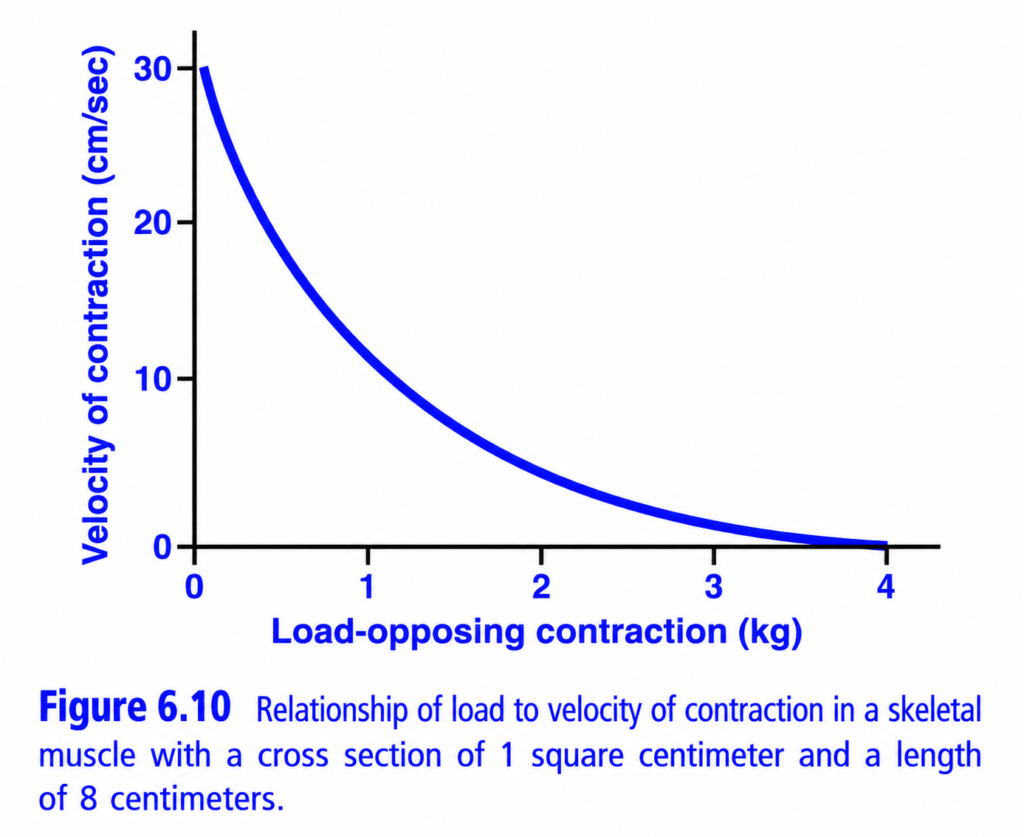
Relationship Between Load and Velocity of Skeletal Muscle Contraction (Figure 6.10) – Easy Conceptual Summary
This graph explains how the speed (velocity) of muscle contraction changes when the muscle has to lift different loads.
It demonstrates a fundamental principle of muscle physiology:
The heavier the load on a muscle, the slower the muscle contracts.
This is called the Load–Velocity Relationship.
Basic Concept
When a skeletal muscle contracts, it usually has to lift or move a load (weight or resistance).
Examples:
- Lifting a pen → Small load
- Lifting a heavy suitcase → Large load
- Lifting a barbell → Very large load
The amount of load determines how fast the muscle can shorten.
Golden Rule
Load ↑ → Velocity ↓
or
Heavier load = Slower contraction
Understanding the Graph
X-axis (Load Opposing Contraction, kg)
This shows the weight or resistance that the muscle is trying to lift.
Moving to the right means:
➡️ The load becomes heavier.
Y-axis (Velocity of Contraction, cm/sec)
This shows how fast the muscle shortens.
Higher value
➡️ Faster contraction
Lower value
➡️ Slower contraction
Understanding the Curve
The blue curve slopes downward from left to right.
This means:
As the load increases,
➡️ Velocity decreases.
Let’s understand each part of the curve.
1. Beginning of the Curve (Almost No Load)
What happens?
At 0 kg load,
The muscle contracts at its maximum velocity.
In this graph,
The velocity is about 30 cm/sec.
Why?
Since there is almost no resistance,
The muscle does not waste force lifting weight.
Almost all of its energy is used for shortening.
Therefore,
Contraction is extremely fast.
Easy Concept
Imagine waving your empty hand in the air.
Since nothing is being lifted,
Your hand moves very quickly.
Key Point
No load = Maximum shortening velocity (Vmax).
2. Middle of the Curve (Moderate Load)
What happens?
As the load increases,
The contraction becomes progressively slower.
Why?
Now,
Part of the muscle force is used to overcome the load.
Less force remains available for shortening.
Therefore,
Velocity decreases.
Easy Concept
Imagine carrying:
- A school bag
- A bucket of water
You can still lift both,
but the bucket is lifted more slowly because it is heavier.
Key Point
Moderate load = Moderate contraction velocity.
3. End of the Curve (Maximum Load)
What happens?
At about 4 kg,
Velocity becomes zero.
Why?
The load equals the maximum force that the muscle can produce.
The muscle develops tension,
but it cannot shorten.
This is called an:
Isometric contraction.
Easy Concept
Imagine trying to push a wall.
Your muscles become tense,
but the wall does not move.
The muscle contracts internally,
yet its length does not change.
Key Point
Maximum load = Zero shortening velocity (Isometric contraction).
Why Does Velocity Decrease as Load Increases?
During contraction,
Myosin heads repeatedly:
- Attach to actin.
- Pull the actin filament.
- Detach.
- Repeat.
When the load is small,
Each power stroke moves the actin filament easily.
When the load is heavy,
Each power stroke must overcome much greater resistance.
Therefore,
The cross-bridge cycle slows,
and the muscle shortens more slowly.
Easy Concept
Imagine riding a bicycle.
On a flat road
You pedal quickly.
Speed is high.
Going uphill
The hill provides resistance.
You pedal more slowly.
Speed decreases.
Very steep hill
You pedal with great effort,
but the bicycle hardly moves.
Velocity approaches zero.
This is exactly how muscles behave.
Types of Muscle Contraction Explained by the Graph
1. Isotonic Contraction
The muscle:
- Shortens
- Moves the load
Occurs when:
The load is less than the muscle’s maximum force.
Examples:
- Picking up a book
- Walking
- Running
2. Isometric Contraction
The muscle:
- Develops tension
- Does not shorten
Occurs when:
The load equals or exceeds the muscle’s maximum force.
Examples:
- Pushing against a wall
- Trying to lift an immovable object
Clinical Importance
Light Weights
Muscles shorten rapidly.
Useful for:
- Fast movements
- Sprinting
- Throwing
Heavy Weights
Muscles shorten slowly.
Useful for:
- Weightlifting
- Resistance training
- Strength development
Maximum Weight
The muscle cannot shorten.
Only tension develops.
Comparison of Different Loads
| Load | Velocity | Type of Contraction |
|---|---|---|
| Very small | Very high | Rapid isotonic contraction |
| Moderate | Moderate | Slower isotonic contraction |
| Heavy | Very slow | Slow isotonic contraction |
| Maximum | Zero | Isometric contraction |
Quick Memory Table
| Load | Muscle Behavior |
|---|---|
| No load | Maximum shortening velocity (Vmax) |
| Increasing load | Velocity gradually decreases |
| Maximum load | No shortening, only tension develops |
| Beyond maximum force | Muscle cannot move the load |
Easy Memory Trick
“Light = Lightning” ⚡
- Light load
- Fast shortening
“Heavy = Slow” 🏋️
- Heavy load
- Slow shortening
“Impossible = Isometric” 🧱
- Load too heavy
- No movement
- Muscle develops tension only
How This Graph Relates to Daily Life
| Activity | Load | Velocity |
|---|---|---|
| Waving your hand | Very low | Very fast |
| Lifting a water bottle | Low | Fast |
| Lifting a suitcase | Moderate | Moderate |
| Lifting a heavy barbell | High | Slow |
| Trying to lift an object that cannot move | Maximum | Zero |
Key Concept
The load–velocity relationship states that the speed of skeletal muscle shortening is inversely related to the load it must overcome. When there is little or no load, the muscle shortens at its maximum velocity (Vmax) because almost all of its energy is used for shortening rather than overcoming resistance. As the load increases, a greater proportion of the muscle’s force is required to oppose the resistance, so the velocity of shortening progressively decreases. When the load equals the maximum force the muscle can generate, the muscle develops tension but cannot shorten, resulting in an isometric contraction with zero shortening velocity. Thus, light loads produce fast contractions, whereas heavy loads produce slow contractions, making the load–velocity relationship a fundamental principle of skeletal muscle mechanics.
PREPARE AND MADE BY SELF LEARNING DR SHEEN
