


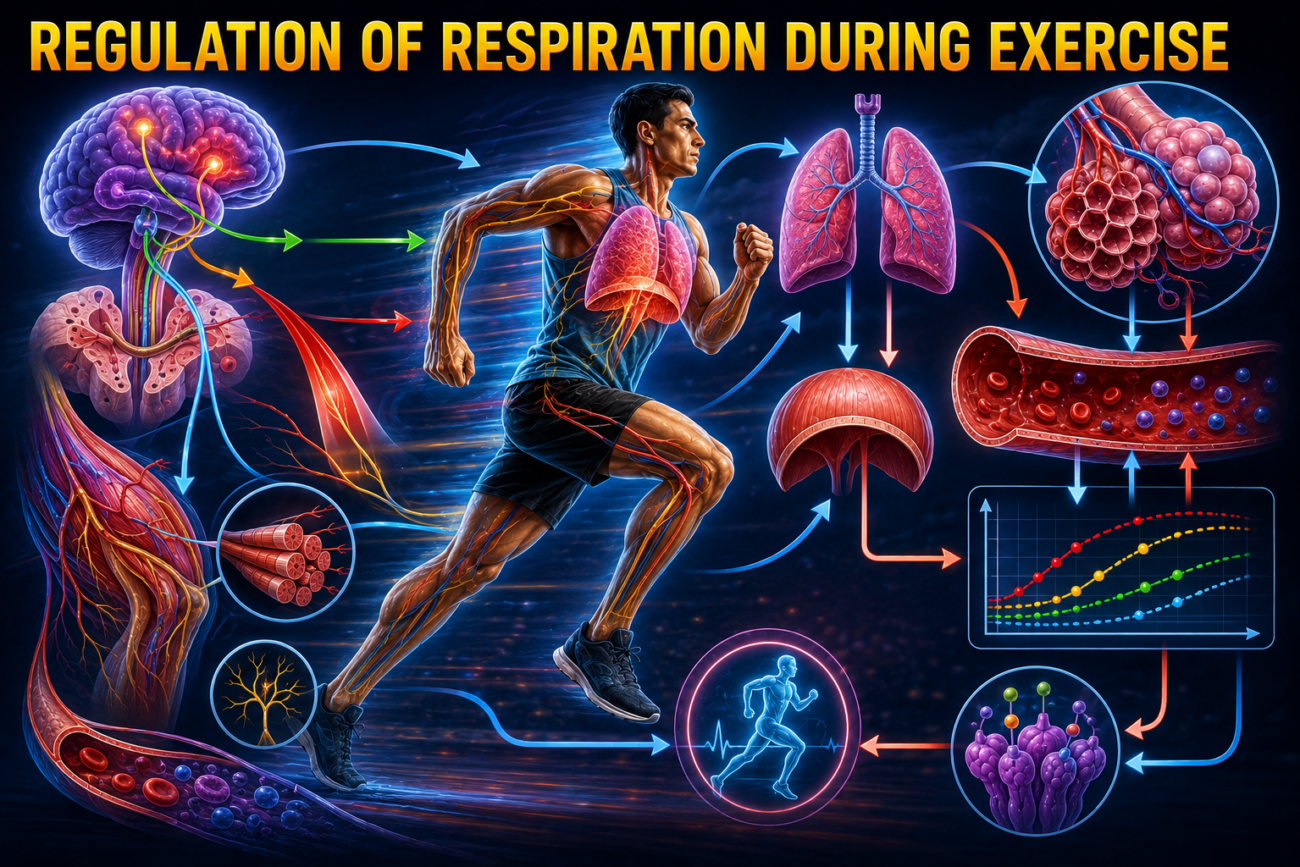
- During strenuous exercise, oxygen (O₂) consumption and carbon dioxide (CO₂) production can increase up to 20 times.
- In healthy athletes, alveolar ventilation increases almost exactly in proportion to the increase in oxygen metabolism. (Fig. 42.9)
- As a result:
- Arterial PO₂ remains nearly normal.
- Arterial PCO₂ remains nearly normal.
- Arterial pH remains nearly normal.
- Measurements show that arterial PCO₂, pH, and PO₂ do not change enough during exercise to explain the large increase in breathing.
- Therefore, these blood chemical changes are not the main cause of the intense ventilation during strenuous exercise.
- The most important cause is believed to be signals from the brain.
- When the brain sends motor impulses to the exercising muscles, it simultaneously sends collateral impulses to the brainstem respiratory center.
- These collateral impulses stimulate the respiratory center and increase ventilation.
- This mechanism is similar to the stimulation of the vasomotor center, which increases arterial blood pressure during exercise.
- When exercise begins, ventilation increases almost immediately.
- This rapid increase occurs before blood gases or pH have enough time to change.
- Therefore, most of the initial increase in breathing is produced by neurogenic signals from the brain.
- These signals reach the respiratory center at the same time that motor signals are sent to the muscles to produce contraction.
KEY CONCEPT
- During exercise, O₂ consumption and CO₂ production can increase up to 20-fold.
- Alveolar ventilation increases in proportion to oxygen metabolism. (Fig. 42.9)
- Arterial PO₂, PCO₂, and pH remain nearly normal during exercise.
- The main stimulus for increased ventilation is neurogenic signals from the brain, not changes in blood gases.
- Breathing increases immediately when exercise starts because the brain activates the respiratory center and skeletal muscles simultaneously.
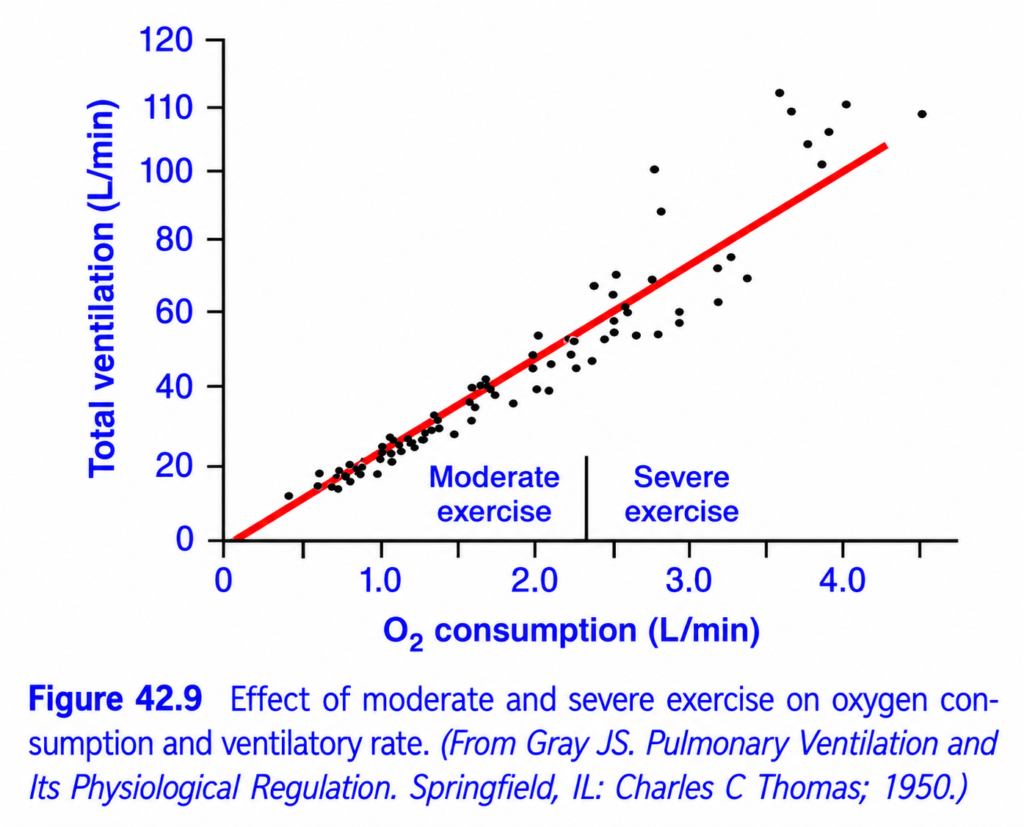
Effect of Exercise on Ventilation (Guyton Fig. 42.9) – Easiest & Most Conceptual Explanation with Dr sheen
🎯 One-Line Concept
As exercise intensity increases, oxygen consumption increases, and the lungs automatically increase ventilation almost proportionally to supply more oxygen and remove more carbon dioxide.
💡 Golden Rule
More Exercise → More O₂ Needed → More CO₂ Produced → More Breathing
Think of your lungs as the engine’s air intake system.
- 🚶 Walking → Small amount of air needed.
- 🏃 Running → Large amount of air needed.
Step 1: Understand the Graph
The graph compares:
- Oxygen Consumption (X-axis)
- Total Ventilation (Y-axis)
It shows:
As oxygen consumption increases, ventilation also increases.
Step 2: Understand the Axes
X-Axis (Horizontal)
Shows
Oxygen Consumption (O₂ consumption)
Measured in
L/min
0 ───────────────► 4.5 L/minMoving to the right means
➡ Exercise intensity is increasing.
Y-Axis (Vertical)
Shows
Total Ventilation
Measured in
L/min
0
20
40
60
80
100
120
Moving upward means
➡ Breathing becomes faster and deeper.
Step 3: What Do the Black Dots Mean?
Each black dot represents
One person’s measurement
during exercise.
Different people breathe slightly differently,
so the dots are scattered.
Step 4: What Does the Red Line Mean?
The red line shows the
Average Relationship
between
Oxygen consumption
and
Ventilation.
The important observation is:
The line is almost straight.
This means
Ventilation increases almost directly in proportion to oxygen consumption.
Moderate Exercise
This region is shown on the left side.
Examples
- Walking
- Slow jogging
- Cycling slowly
Suppose
O₂ consumption increases from
1 L/min

↓

2 L/min
Ventilation also approximately doubles.
20 L/min

↓

40 L/min
The body increases breathing just enough to meet the muscles’ needs.
Severe Exercise
Now imagine
Fast running
Swimming
Football
Heavy cycling
Oxygen consumption continues increasing.
2.5

↓

4 L/min
Ventilation also increases greatly.
60

↓

100 L/min
During severe exercise,
breathing becomes
- Faster
- Deeper
Why Does Breathing Increase During Exercise?
Working muscles need
✅ More oxygen
and produce
✅ More carbon dioxide
Therefore,
the respiratory center increases ventilation.
Exercise
      ↓
Muscles work harder
      ↓
O₂ consumption ↑
CO₂ production ↑
      ↓
Brain increases ventilation
      ↓
More O₂ enters
More CO₂ leaves
Important Concept
Many students think
“Breathing increases because CO₂ rises.”
Actually,
during moderate exercise
arterial
PCO₂ remains almost normal.
PO₂ also remains almost normal.
pH remains almost normal.
Yet
Breathing increases enormously.
Why?
Because
The brain receives signals from
- Motor cortex (central command)
- Exercising muscles and joints (proprioceptors)
- Chemoreceptors (especially during intense exercise)
These signals increase ventilation before blood gases change significantly.
Why Is the Relationship Almost Linear?
Suppose
Exercise doubles.
Exercise ×2Then
Oxygen requirement approximately doubles.
O₂ need ×2Therefore,
Breathing also approximately doubles.
Ventilation ×2This is why the graph shows
a nearly straight line.
What Happens During Very Severe Exercise?
At very high exercise intensity,
the black dots become more scattered.
Why?
Because people differ in
- Fitness
- Lung capacity
- Muscle efficiency
- Training level
Elite athletes may achieve much higher ventilation than untrained individuals.
Complete Flow Chart
Exercise Begins
        │
        ▼
Muscles Need More ATP
        │
        ▼
O₂ Consumption Increases
        │
        ▼
CO₂ Production Increases
        │
        ▼
Brain & Muscle Signals
        │
        ▼
Respiratory Center Activated
        │
        ▼
Ventilation Increases
        │
        ▼
More O₂ Delivered
More CO₂ Removed
Everyday Analogy
Imagine
A factory.
🏭 Small factory
Needs
One delivery truck.
🏭 Large factory
Needs
Five delivery trucks.
Similarly,
Small exercise
↓
Little breathing
Large exercise
↓
Much more breathing
Why Doesn’t Blood PO₂ Fall During Exercise?
Because
The lungs increase ventilation almost exactly as much as the muscles increase oxygen consumption.
Therefore,
Arterial PO₂ remains almost normal.
Why Doesn’t PCO₂ Rise?
Because
Extra CO₂ produced by muscles
is immediately removed by increased ventilation.
Therefore,
Arterial PCO₂ remains close to 40 mm Hg during moderate exercise.High-Yield MBBS Points
| During Exercise | Effect |
|---|---|
| O₂ consumption ↑ | Ventilation ↑ |
| CO₂ production ↑ | Ventilation ↑ |
| Moderate exercise | Ventilation increases almost linearly with O₂ consumption |
| Arterial PO₂ | Remains nearly normal |
| Arterial PCO₂ | Remains nearly normal |
| Very heavy exercise | Ventilation increases markedly and lactic acidosis contributes to further stimulation of breathing |
Understanding the Moderate and Severe Exercise Labels
Moderate Exercise
- Walking
- Jogging
- Easy cycling
Characteristics:
- Ventilation increases proportionally.
- Blood gases remain nearly normal.
Severe Exercise
- Sprinting
- Heavy cycling
- Competitive sports
Characteristics:
- Very high ventilation.
- Additional stimulation from lactic acid (metabolic acidosis) and increased H⁺.
- Greater individual variation.
🌟 Super Memory Summary
Exercise
      │
      ▼
Muscles Need More O₂
      │
Produce More CO₂
      │
      ▼
Respiratory Center Stimulated
      │
      ▼
Ventilation Increases
      │
      ▼
More O₂ Enters Blood
More CO₂ Leaves Blood
      │
      ▼
Blood Gases Remain Nearly Normal
🧠 Easy Mnemonic
“Exercise = O₂ Up = Breathing Up”
Or remember:
Work More → Breathe More
💎 Golden Rule
During exercise, ventilation increases almost in direct proportion to oxygen consumption. This proportional increase allows arterial PO₂, arterial PCO₂, and blood pH to remain close to normal despite the greatly increased metabolic demands of the exercising muscles.
Interrelationship Between Chemical and Nervous Factors in Controlling Respiration During Exercise
- During exercise, direct nervous signals stimulate the respiratory center.
- These signals increase breathing by almost the correct amount to supply the extra O₂ needed and remove the extra CO₂ produced.
- Sometimes, the nervous respiratory signals are too strong or too weak.
- In these situations, chemical factors make the final adjustment in breathing.
- These adjustments keep the O₂, CO₂, and H⁺ concentrations of body fluids as close to normal as possible.
- This process is shown in Fig. 42.10.
- The lower curve shows changes in alveolar ventilation during 1 minute of exercise.
- The upper curve shows changes in arterial PCO₂.
- At the beginning of exercise, alveolar ventilation increases almost immediately, even before arterial PCO₂ increases.
- Initially, ventilation increases so much that it temporarily lowers arterial PCO₂ below normal.
- This happens because the brain gives an anticipatory stimulation to the respiratory center at the start of exercise.
- Therefore, extra ventilation begins even before it is actually needed.
- After about 30–40 seconds, the CO₂ released from the active muscles becomes approximately equal to the increased ventilation.
- As exercise continues, arterial PCO₂ returns to nearly its normal value.
- This is shown toward the end of the first minute of exercise.
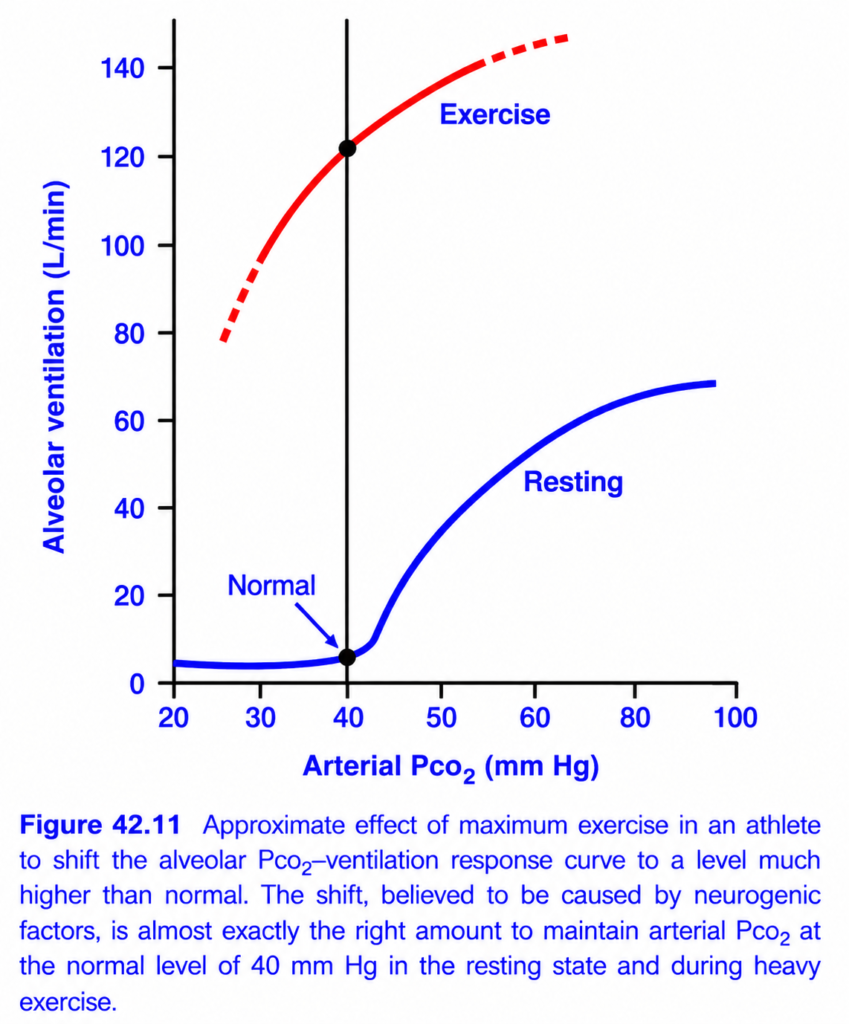
- Fig. 42.11 shows the control of respiration during exercise in a more quantitative way.
- The lower curve shows the relationship between arterial PCO₂ and alveolar ventilation when the body is at rest.
- The upper curve shows the upward shift in the ventilation curve caused by neurogenic stimulation during heavy exercise.
- The marked points show arterial PCO₂ during rest and exercise.
- In both conditions, arterial PCO₂ remains at the normal value of 40 mm Hg.
- The neurogenic factor shifts the ventilation curve about 20-fold upward.
- This increase in ventilation almost matches the rate of CO₂ release.
- As a result, arterial PCO₂ remains close to its normal value.
- If arterial PCO₂ becomes greater than 40 mm Hg during exercise, it further stimulates ventilation.
- If arterial PCO₂ becomes less than 40 mm Hg, it reduces ventilation.
KEY CONCEPT
- Direct nervous signals cause the immediate increase in breathing during exercise.
- Chemical factors fine-tune breathing to keep O₂, CO₂, and H⁺ levels nearly normal.
- At the start of exercise, ventilation increases before arterial PCO₂ rises because of anticipatory brain stimulation. (Fig. 42.10)
- After 30–40 seconds, ventilation matches CO₂ production and arterial PCO₂ returns to normal.
- During heavy exercise, neurogenic stimulation shifts the ventilation response upward about 20-fold, keeping arterial PCO₂ near 40 mm Hg. (Fig. 42.11)
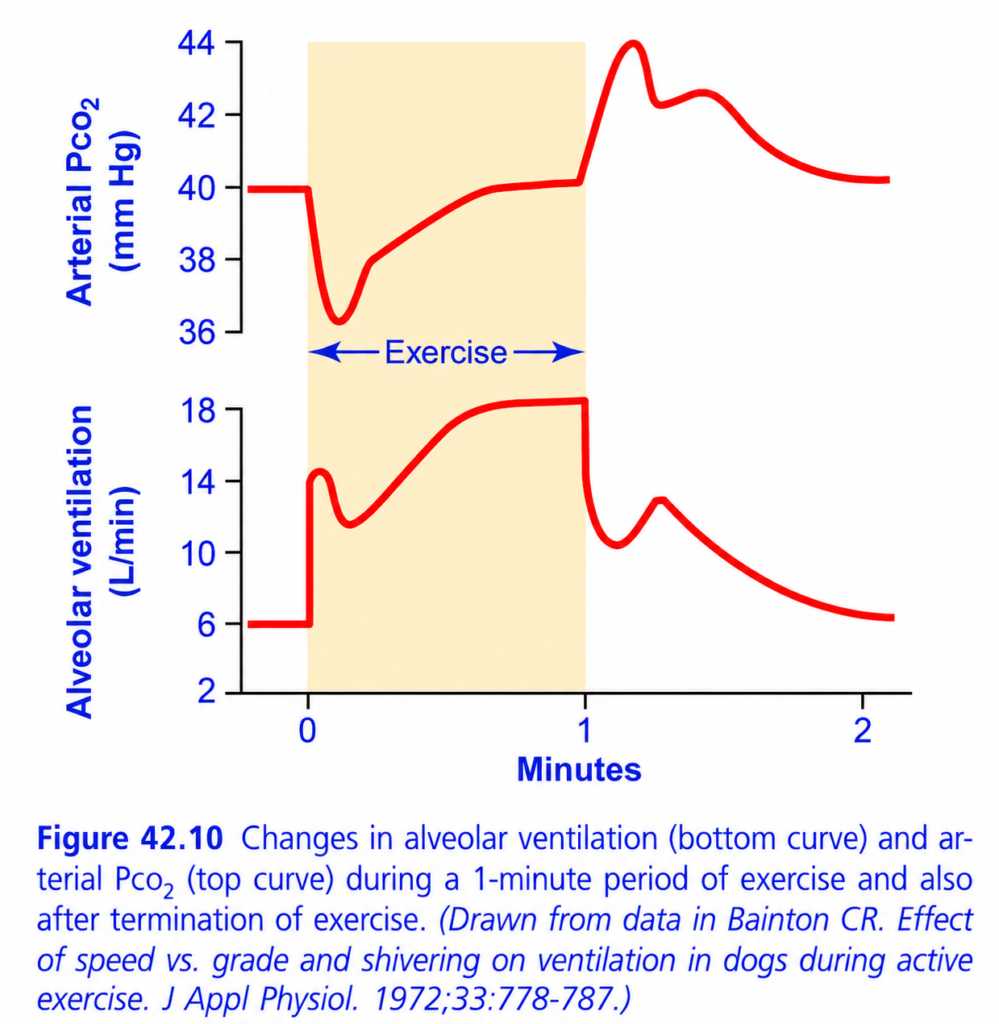
This is Figure 42.10 from Guyton Physiology, and it explains how breathing (alveolar ventilation) and arterial PCO₂ change during exercise and immediately after exercise stops.
This figure is very important for MBBS students because it explains why ventilation increases immediately at the start of exercise, even before CO₂ changes.
⭐ Figure 42.10: Changes in Alveolar Ventilation and Arterial PCO₂ During Exercise with Dr sheen.
🎯 One-Line Concept
During exercise, ventilation increases almost immediately due to nervous stimulation, keeping arterial PCO₂ nearly normal despite increased CO₂ production.
Simply,
Exercise starts
        ↓
Brain stimulates breathing immediately
        ↓
Ventilation increases rapidly
        ↓
CO₂ produced by muscles is removed
        ↓
Arterial PCO₂ remains near normal
STEP 1: Understand the Graph
This figure contains two graphs.
Upper Graph
Shows
Arterial PCO₂ (mmHg)
Normal value
≈ 40 mmHg
Lower Graph
Shows
Alveolar Ventilation (L/min)
Normal resting ventilation
≈ 6 L/min
X-Axis
Shows
Time (minutes)
The yellow shaded area represents
⭐ Exercise Period
Exercise begins at
0 minute
Exercise ends at
1 minute
FIRST LOOK AT THE LOWER GRAPH (Ventilation)
This graph is easier to understand first.
Before Exercise
Time
Before 0 minute
Ventilation
≈6 L/min
This is
normal resting breathing.
Exercise Starts (0 Minute)
Look carefully.
Ventilation suddenly jumps from
6
↓
about
14 L/min.
Why Does It Increase So Quickly?
Has CO₂ increased yet?
❌ No.
Has oxygen fallen yet?
❌ No.
So why?
Because
the motor cortex sends signals simultaneously to:
- Skeletal muscles
- Respiratory center in the medulla
This is called
Feed-Forward (Central Command)
The brain anticipates the need for more oxygen and starts increasing breathing immediately.
Easy Memory
Brain says:
“Exercise is starting—breathe faster now!”
Small Dip After the Initial Rise
After the sudden increase,
ventilation falls slightly.
Why?
The first nervous signal is stronger than needed.
The body then adjusts ventilation.
This is a temporary correction.
Gradual Rise
Now
ventilation slowly rises again
to about
18 L/min.
Why?
Now chemical factors begin to contribute.
Muscles produce
- More CO₂
- More H⁺
- Slightly lower PO₂ locally
Peripheral and central chemoreceptors help fine-tune breathing.
Result
Ventilation reaches the exact level needed.
During Exercise
Ventilation remains stable at
about
18 L/min.Why?
Because
CO₂ production
and
CO₂ removal
become balanced.
Exercise Stops (1 Minute)
Now look carefully.
Ventilation suddenly falls.
Why?
The brain immediately stops sending exercise-related signals.
So,
the nervous stimulation disappears.
Easy Memory
Exercise OFF
↓
Brain command OFF
↓
Ventilation decreases immediately.
Small Rise After the Fall
Notice
ventilation rises slightly again.
Why?
Muscles are still producing extra CO₂ for a short time.
The chemoreceptors detect this
and temporarily increase breathing.
Gradual Return to Normal
Eventually,
CO₂ production returns to normal.
Ventilation gradually falls back to
6 L/min.
NOW LOOK AT THE UPPER GRAPH (PCO₂)
Before Exercise
Arterial PCO₂
=
40 mmHg
Normal.
Exercise Starts
Surprisingly,
PCO₂
falls
to about
36 mmHg.
Why?
Because
ventilation increased
before
muscles produced much extra CO₂.
Therefore,
more CO₂ is exhaled than produced initially.
This causes a brief drop in arterial PCO₂.
Easy Memory
Breathing starts first.
CO₂ production catches up later.
Gradual Rise During Exercise
Now
muscles begin producing large amounts of CO₂.
PCO₂ gradually rises back toward
40 mmHg.
Why?
Ventilation adjusts perfectly.
Extra CO₂ production is matched by extra CO₂ removal.
Important Point
Even during heavy exercise,
arterial PCO₂ remains
almost
normal.
Exercise Stops
Now look carefully.
PCO₂ suddenly rises to about
44 mmHg.
Why?
Breathing decreases immediately,
but
muscles are still releasing CO₂.
For a short time,
CO₂ accumulates.
Result
Arterial PCO₂ increases.
Gradual Fall
As breathing continues
and muscles stop producing excess CO₂,
PCO₂ gradually returns to
40 mmHg.
Why Is This Figure Important?
It proves that
exercise hyperventilation
is NOT caused initially by CO₂.
Instead,
it is caused by
Nervous Signals
Later,
chemical factors fine-tune ventilation.
Step-by-Step Sequence
Exercise Begins
↓
Brain stimulates respiratory center.
↓
Ventilation increases immediately.
↓
CO₂ falls briefly.
↓
Muscles begin producing more CO₂.
↓
Chemoreceptors adjust ventilation.
↓
PCO₂ returns to normal.ercise Ends
↓
Brain command stops.
↓
Ventilation decreases immediately.
↓
CO₂ temporarily accumulates.
↓
Chemoreceptors increase breathing slightly.
↓
Everything returns to normal.
Clinical Correlation
1. Normal Exercise
Ventilation increases
3–20 times
depending on exercise intensity.
Despite this,
arterial PCO₂ usually remains close to normal because ventilation matches metabolic CO₂ production.
2. Anxiety Before Exercise
The brain may increase breathing
even before movement begins.
This is another example of
central command.
3. Trained Athletes
Their respiratory control is more efficient.
They maintain
normal arterial PCO₂
even during intense exercise.
High-Yield MBBS Viva Points
Rest
Ventilation
≈6 L/min
PCO₂
≈40 mmHg
Exercise Starts
Ventilation
↑ immediately
↓
PCO₂ briefly falls
During Exercise
Ventilation
↑↑
↓
PCO₂ remains near
40 mmHg
Exercise Stops
Ventilation
↓
immediately
↓
PCO₂ rises briefly
↓
Returns to normal
Compare the Two Graphs
| Time | Ventilation | Arterial PCO₂ |
|---|---|---|
| Rest | Normal | 40 mmHg |
| Exercise begins | Sudden increase | Brief decrease |
| During exercise | High and stable | Returns near 40 mmHg |
| Exercise ends | Sudden decrease | Brief increase |
| Recovery | Normal | 40 mmHg |
Super Easy Memory Story
Imagine
You start running.
Step 1
Your brain immediately tells your lungs:
“Start breathing faster!”
Even before your muscles have produced much CO₂.
So,
ventilation rises first,
and CO₂ briefly falls.
Step 2
After a few seconds,
your muscles begin producing large amounts of CO₂.
Your increased breathing removes it efficiently,
keeping arterial PCO₂ close to normal.
Step 3
You suddenly stop running.
The brain immediately says:
“Slow your breathing.”
Breathing decreases before all the extra CO₂ has been removed.
So,
CO₂ rises briefly.
Then,
as metabolism returns to resting levels,
both ventilation and arterial PCO₂ return to normal.
🎯 MBBS Golden Rule
During Exercise
- Brain (central command) increases ventilation immediately.
- Chemical factors (CO₂, H⁺, and to a lesser extent O₂) fine-tune the response.
- Arterial PCO₂ stays close to 40 mmHg because ventilation matches CO₂ production.
Final Concept to Never Forget
The key message of Figure 42.10 is that exercise hyperventilation is initiated mainly by nervous signals from the brain (feed-forward control), not by an initial rise in CO₂.
- At the start of exercise, ventilation increases immediately, causing a brief fall in arterial PCO₂.
- During steady exercise, increased ventilation matches increased CO₂ production, so arterial PCO₂ remains almost normal (≈40 mmHg).
- When exercise stops, ventilation decreases immediately, producing a brief rise in arterial PCO₂ before both ventilation and PCO₂ gradually return to resting values.
This demonstrates the coordinated action of neural control (rapid response) and chemical control (fine adjustment) in regulating respiration during exercise.
This is Figure 42.11 from Guyton Physiology, and it explains how exercise changes the body’s response to carbon dioxide (CO₂).
This is one of the highest-yield MBBS physiology graphs because it explains why athletes can breathe much more during exercise without increasing arterial PCO₂.
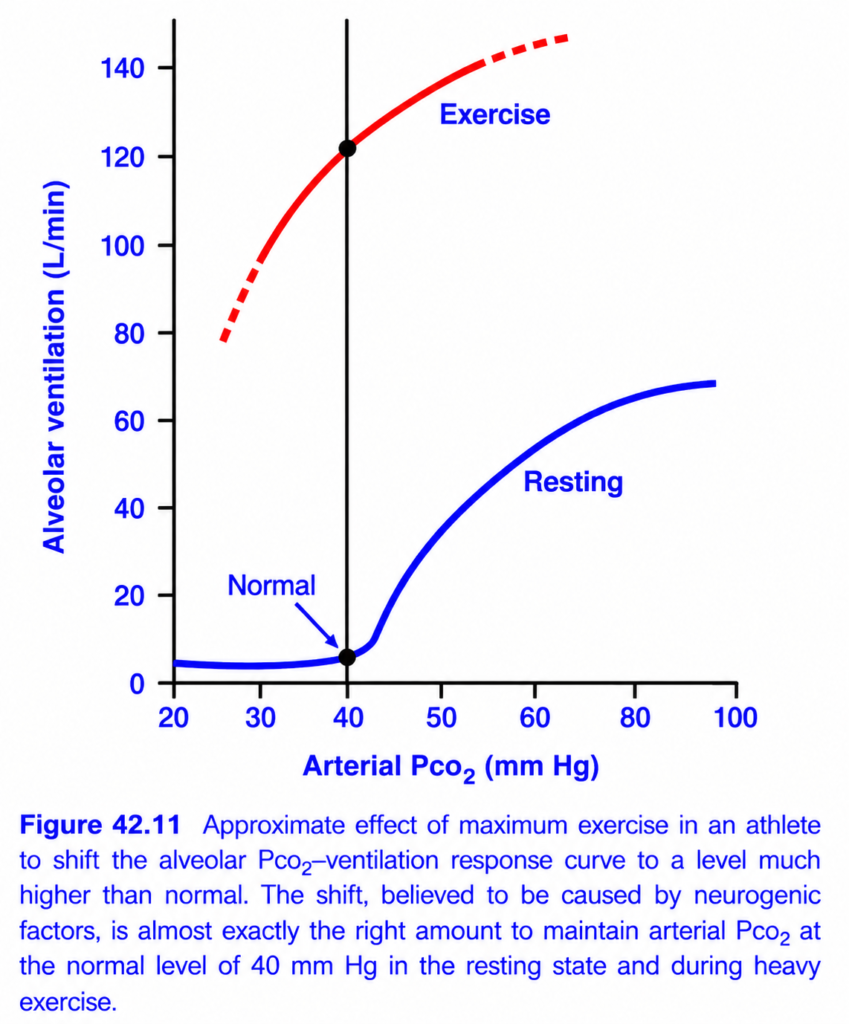
⭐ Figure 42.11: Effect of Exercise on the CO₂–Ventilation Response Curve with Dr sheen.
🎯 One-Line Concept
During exercise, the entire CO₂–ventilation response curve shifts upward, allowing much greater ventilation while arterial PCO₂ remains normal (≈40 mmHg).
Simply,
Rest
PCO₂ = 40 mmHg
        ↓
Ventilation ≈ 6 L/min

Exercise
PCO₂ = 40 mmHg
        ↓
Ventilation ≈120 L/min
Same PCO₂, but much greater ventilation!
STEP 1: Understand the Axes
X-Axis (Horizontal)
Arterial PCO₂ (mmHg)
This shows
Carbon dioxide pressure in arterial blood.
Normal value
≈ 40 mmHg
Easy Memory
Move right
↓
Higher CO₂
Move left
↓
Lower CO₂
Y-Axis (Vertical)
Alveolar Ventilation (L/min)
This shows
How much air enters the alveoli each minute.
Higher value
↓
More breathing
Lower value
↓
Less breathing
STEP 2: Understand the Two Curves
There are two curves.
🔵 Blue Curve
Resting State
This is the normal CO₂-ventilation relationship.
🔴 Red Curve
Exercise
This is the CO₂-ventilation relationship during heavy exercise.
Notice that the entire curve has shifted upward.
That is the key message of the graph.
STEP 3: Understand the Blue Curve (Resting)
Look at the black dot on the blue curve.
It is labeled Normal.
What does it represent?
At rest,
Arterial PCO₂
=
40 mmHg
Ventilation
≈ 6 L/min
This is the normal resting condition.
What happens if PCO₂ increases?
Suppose
PCO₂
40
↓
50 mmHg.
The blue curve rises.
Ventilation increases.
Why?
CO₂ stimulates the
- Central chemoreceptors
- Peripheral chemoreceptors
which increase breathing.
STEP 4: Understand the Red Curve (Exercise)
Now look at the red curve.
Notice something very important.
It is much higher than the blue curve.
What does this mean?
During exercise,
for the same arterial PCO₂,
ventilation is much greater.xample
At
PCO₂ = 40 mmHg
Rest
↓
Ventilation ≈6 L/min
Exercise
↓
Ventilation ≈120 L/min
Question
Did PCO₂ increase?
❌ No.
It stayed
40 mmHg.
Then why is ventilation so high?
Because
the brain resets the respiratory center during exercise.
STEP 5: Why Does the Curve Shift Upward?
This is the most important concept.
During exercise,
the respiratory center receives extra stimulation from:
1. Motor Cortex (Central Command)
When the brain sends signals to muscles,
it simultaneously sends signals to the respiratory center.
This increases breathing immediately, even before CO₂ changes.
2. Proprioceptors
Movement of
- Muscles
- Tendons
- Joints
sends additional signals to the respiratory center.
3. Chemical Factors
As exercise continues,
- CO₂ production increases.
- H⁺ increases.
- Temperature increases.
These help fine-tune ventilation.
Result
The whole ventilation curve shifts upward.Why Is Arterial PCO₂ Still 40 mmHg?
This is the key question.
During exercise,
muscles produce much more CO₂.
One might expect
PCO₂ to rise.
But it usually doesn’t.
Why?
Because
ventilation increases by almost exactly the same amount as CO₂ production.
So,
Extra CO₂ produced
=
Extra CO₂ exhaled.
Therefore,
arterial PCO₂ remains close to
40 mmHg.
Understanding the Black Dot on the Red Curve
This dot represents
Heavy exercise.
Notice
PCO₂
is still
40 mmHg.
But
ventilation is
≈120 L/min.
Meaning
The athlete is breathing about
20 times
more than at rest,
yet arterial PCO₂ remains normal.
This demonstrates the remarkable matching of ventilation to metabolic demand.pare Rest vs Exercise
| Parameter | Rest | Heavy Exercise |
|---|---|---|
| Arterial PCO₂ | 40 mmHg | 40 mmHg |
| Ventilation | ≈6 L/min | ≈120 L/min |
| CO₂ Production | Normal | Greatly increased |
| CO₂ Removal | Normal | Greatly increased |
Why Doesn’t the Red Curve Start at 6 L/min?
Because
during exercise,
the respiratory center has already been activated by neural mechanisms.
Therefore,
even before CO₂ becomes an important stimulus,
ventilation is already high.
Clinical Correlation
1. Healthy Athlete
Ventilation increases enormously during maximal exercise.
Yet,
arterial PCO₂ remains almost normal.
2. Poor Physical Fitness
Ventilation may not match metabolic demand as efficiently.
The person becomes breathless earlier.
3. Lung Disease
Patients with COPD or restrictive lung disease may be unable to increase ventilation sufficiently during exercise.
As a result,
arterial PCO₂ may rise and exercise tolerance decreases.
High-Yield MBBS Viva Points
Normal Rest
- PCO₂ = 40 mmHg
- Ventilation ≈ 6 L/min
Heavy Exercise
- PCO₂ ≈ 40 mmHg
- Ventilation ≈ 120 L/min
Main Cause of Upward Shift
Neurogenic stimulation
- Motor cortex (central command)
- Muscle and joint proprioceptors
Purpose
Maintain
Normal arterial PCO₂
despite markedly increased CO₂ production.
Easy Story
Imagine
Your lungs are a factory exhaust fan.
Rest
The factory produces little smoke (CO₂).
A small fan
(6 L/min)
is enough.
Exercise
The factory now produces huge amounts of smoke.
Instead of waiting for smoke to fill the room,
the manager immediately switches on a giant exhaust fan
(≈120 L/min).
The smoke never accumulates.
Therefore,
PCO₂ remains normal.
Exactly what this graph shows.
Difference Between Rest and Exercise Curves
| Resting Curve | Exercise Curve |
|---|---|
| Normal breathing | Very high breathing |
| Ventilation mainly responds to CO₂ | Ventilation increased by neural drive plus chemical feedback |
| 40 mmHg → ~6 L/min | 40 mmHg → ~120 L/min |
| Lower curve | Upward-shifted curve |
🎯 MBBS Golden Rule
During Exercise
- The CO₂–ventilation response curve shifts upward.
- Ventilation increases enormously because of neurogenic stimulation.
- Arterial PCO₂ remains close to 40 mmHg because increased ventilation matches increased CO₂ production.
Final Concept to Never Forget
The key message of Figure 42.11 is that exercise does not simply make the lungs respond more strongly to rising CO₂; instead, it raises the entire level of ventilation through neural mechanisms.
- At rest, a PCO₂ of 40 mmHg is associated with a ventilation of about 6 L/min.
- During heavy exercise, the same PCO₂ of 40 mmHg is associated with a ventilation of about 120 L/min because the respiratory center receives powerful feed-forward neural stimulation from the motor cortex and proprioceptors.
- This upward shift allows the body to eliminate the large amounts of CO₂ produced by exercising muscles while keeping arterial PCO₂ nearly constant, ensuring efficient gas exchange throughout exercise.
Neurogenic Control of Ventilation During Exercise May Be Partly a Learned Response
- Many experiments suggest that the brain’s ability to shift the ventilatory response curve during exercise is partly a learned response. (Fig. 42.11)
- With repeated periods of exercise, the brain gradually becomes better at sending the correct respiratory signals.
- These signals help keep the arterial PCO₂ at its normal level during exercise.
- The cerebral cortex appears to play an important role in this learning process.
- Experiments show that blocking only the cerebral cortex also blocks the learned respiratory response.
KEY CONCEPT
- The neurogenic control of ventilation during exercise is partly a learned response.
- Repeated exercise improves the brain’s ability to regulate breathing.
- This learned response helps maintain normal arterial PCO₂ during exercise.
- The cerebral cortex is involved in developing this learned respiratory response. (Fig. 42.11)
Other Factors That Affect Respiration
Effect of Irritant Receptors in the Airways
- The trachea, bronchi, and bronchioles contain sensory nerve endings called pulmonary irritant receptors (airway nociceptors).
- These receptors are stimulated by:
- Irritants, such as capsaicin from chili peppers or acid from stomach contents.
- Respiratory pathogens and inflammatory mediators, such as cytokines and bradykinin.
- Mechanical stimuli, such as accumulated airway mucus or inhaled particulate matter.
- These receptors trigger coughing or sneezing.
- They may also cause bronchial constriction in diseases such as asthma and emphysema.
- Irritant stimuli are detected by:
- G-protein coupled receptors.
- Transient receptor potential (TRP) channels, which are ion channel receptors on respiratory sensory neurons.
Function of Lung J Receptors
- J receptors are sensory nerve endings located in the alveolar walls next to the pulmonary capillaries.
- They are stimulated when:
- Pulmonary capillaries become engorged with blood.
- Pulmonary edema occurs, such as in congestive heart failure.
- The exact function of J receptors is not completely known.
- Their stimulation may produce a feeling of dyspnea (shortness of breath).
- They may also increase the respiratory rate.
Brain Edema Depresses the Respiratory Center
- Acute brain edema can depress or completely inactivate the respiratory center.
- Brain edema may occur after a brain concussion.
- Damaged brain tissue swells and compresses the cerebral arteries, reducing the brain’s blood supply.
- Respiratory depression caused by brain edema may be temporarily relieved by intravenous hypertonic solutions, such as highly concentrated mannitol.
- These solutions remove water from the brain by osmosis.
- This reduces intracranial pressure and may restore respiration within a few minutes.
Overdosage of Anesthetics and Narcotics
- Overdose of anesthetics or narcotics is one of the most common causes of respiratory depression and respiratory arrest.
- Sodium pentobarbital depresses the respiratory center more than many other anesthetics, such as halothane.
- Morphine was once used as an anesthetic.
- Now, morphine is used only as an adjunct to anesthetics because it greatly depresses the respiratory center while producing less anesthesia of the cerebral cortex.
- Because opioids can depress respiration, they are responsible for many fatal drug overdoses worldwide.
- In the United States, more than 100,000 people die each year from drug overdose, mainly because of respiratory arrest.
Periodic Breathing
- Periodic breathing is an abnormal pattern of respiration seen in several diseases.
- The person breathes deeply for a short time, followed by shallow breathing or no breathing, and the cycle repeats.
- One type is Cheyne-Stokes breathing.
- It is characterized by gradually increasing and decreasing respiration every 40–60 seconds. (Fig. 42.12)
Basic Mechanism of Cheyne-Stokes Breathing
- When a person overbreathes, too much CO₂ is removed from the pulmonary blood while O₂ increases.
- It takes several seconds for these blood gas changes to reach the brain and reduce the excessive ventilation.
- During this delay, the person continues to overventilate.
- When the overventilated blood reaches the respiratory center, the center becomes excessively depressed.
- Then the opposite changes occur:
- CO₂ increases.
- O₂ decreases in the alveoli.
- Again, the brain takes a few seconds to respond.
- When the brain responds, the person breathes deeply again, and the cycle repeats.
- The basic mechanism of Cheyne-Stokes breathing exists in everyone.
- Under normal conditions, this mechanism is strongly damped.
- Blood and respiratory center fluids contain large amounts of dissolved and chemically bound CO₂ and O₂.
- Therefore, the lungs normally do not produce large enough changes in CO₂ or O₂ within a few seconds to start another breathing cycle.
- However, Cheyne-Stokes breathing occurs under two conditions:
- Delayed blood transport from the lungs to the brain
- Blood takes longer than normal to reach the brain.
- Changes in CO₂ and O₂ continue for a longer time.
- The storage capacity of the alveoli and pulmonary blood is exceeded.
- The respiratory drive becomes excessive, and Cheyne-Stokes breathing begins.
- This commonly occurs in severe cardiac failure because blood flow is slow.
- In chronic heart failure, it may occur on and off for months.
- Increased negative feedback gain of the respiratory control system
- Small changes in blood CO₂ or O₂ produce much larger changes in ventilation than normal.
- Normally, a 3 mm Hg rise in PCO₂ increases ventilation 2–3 times.
- In this condition, the same 3 mm Hg rise in PCO₂ may increase ventilation 10–20 times.
- This strong feedback can produce Cheyne-Stokes breathing even without delayed blood flow.
- This type mainly occurs in patients with damage to the respiratory centers of the brain.
- Brain damage may stop respiration for a few seconds.
- Then a large increase in blood CO₂ restarts breathing with great force.
- This type of Cheyne-Stokes breathing is often a prelude to death from brain malfunction.
- During Cheyne-Stokes breathing, the PCO₂ of the pulmonary blood changes before the PCO₂ of the respiratory center neurons. (Fig. 42.12)
- The depth of respiration depends on the PCO₂ in the brain, not on the PCO₂ in the pulmonary blood.
KEY CONCEPT
- Pulmonary irritant receptors trigger coughing, sneezing, and bronchoconstriction.
- J receptors respond to pulmonary congestion or edema and may cause dyspnea and increased respiration.
- Brain edema and overdose of anesthetics or opioids can depress the respiratory center.
- Cheyne-Stokes breathing is a periodic breathing pattern with waxing and waning respiration every 40–60 seconds. (Fig. 42.12)
- It occurs due to delayed blood transport to the brain or increased respiratory feedback gain.
- During Cheyne-Stokes breathing, the depth of breathing is controlled by brain PCO₂, not pulmonary blood PCO₂.
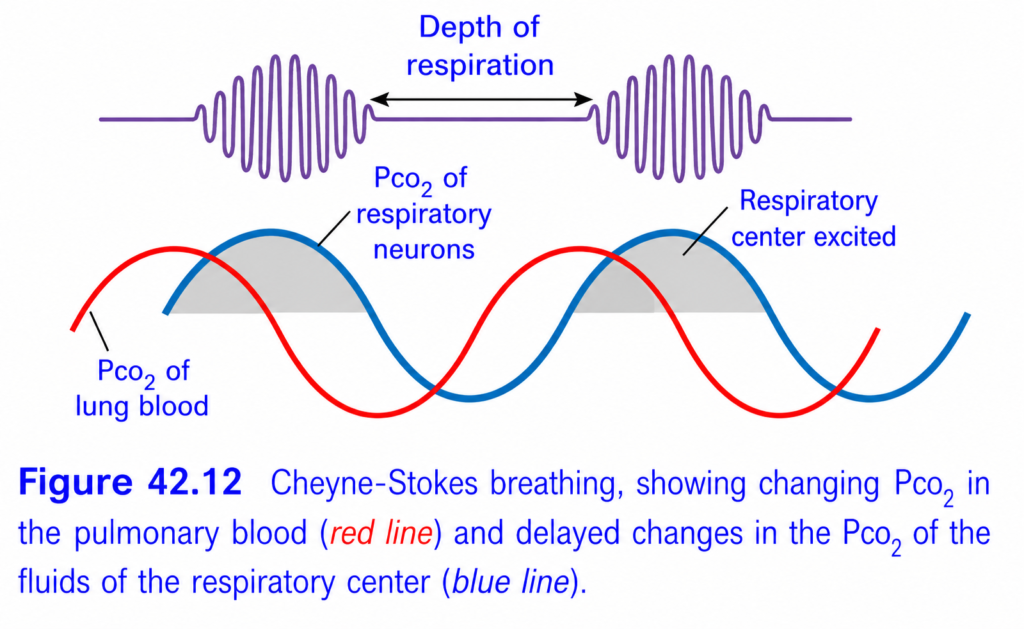
This is Figure 42.12 from Guyton Physiology, and it explains one of the most important abnormal breathing patterns in physiology:
⭐ Cheyne–Stokes Breathing
This graph explains:
Why breathing becomes cyclic (waxing and waning), with periods of deep breathing followed by no breathing (apnea).
This occurs because there is a delay between changes in blood CO₂ and the respiratory center detecting those changes.
🎯 One-Line Concept
Cheyne–Stokes breathing occurs because delayed feedback causes the respiratory center to overcorrect ventilation, producing alternating hyperventilation and apnea.
Simply,
CO₂ ↑
   ↓
Brain responds late
   ↓
Hyperventilation
   ↓
CO₂ falls too much
   ↓
Brain responds late again
   ↓
Apnea
   ↓
CO₂ rises again
   ↓
Cycle repeats
STEP 1: Understand the Figure
This figure has three parts.
① Purple Wave (Top)
This represents
⭐ Depth of Respiration
It shows
How deep the person is breathing.
Notice the pattern.
- Small breaths
- Bigger breaths
- Biggest breaths
- Smaller breaths
- No breathing (flat line)
- Then the cycle repeats.
This waxing and waning pattern is called
⭐ Cheyne–Stokes Respiration
② Red Curve
This represents
⭐ PCO₂ of Lung Blood
This is
the CO₂ level in the pulmonary blood.
③ Blue Curve
This represents
⭐ PCO₂ Around the Respiratory Neurons
This is
the CO₂ level in the brain (medulla) near the respiratory center.
THE MOST IMPORTANT THING
Look carefully.
The
🔴 Red Curve
changes
first.
The
🔵 Blue Curve
changes
later.
Why?
Because
blood takes time
to travel
from the lungs
↓
to the brain.
Therefore,
the respiratory center always receives
old information.
This delay is the main cause of Cheyne–Stokes breathing.
STEP 2: Understand the Purple Wave
Look at the top.
First
Breathing becomes
deeper
and
deeper
and
deeper.
This is called
Waxing
Then
breathing becomes
smaller
and
smaller.
This is called
Waning
Eventually,
breathing stops completely.
This is
Apnea
After a few seconds,
breathing starts again.
The cycle repeats.
Easy Memory
Small
↓

Bigger
↓

Biggest
↓

Smaller
↓

No breathing

↓

Repeat
STEP 3: Understanding the Red Curve
This is
CO₂
in lung blood.
Suppose
apnea occurs.
What happens?
No breathing.
↓
CO₂ cannot leave the lungs.
↓
Blood CO₂ rises.
Therefore,
the red curve rises.
Then
Hyperventilation begins.
Now
lots of CO₂ is exhaled.
↓
Blood CO₂ falls rapidly.
↓
Red curve falls.
This cycle repeats.
STEP 4: Understanding the Blue Curve
This is
the most important curve.
Notice
It follows the red curve
but
later.
Why?
Because
blood carrying CO₂
must travel
from
lungs
↓
heart
↓
brain.
This takes time.
Therefore,
brain CO₂
changes
later.
Easy Memory
Blue curve
=
Delayed copy
of
red curve.
STEP 5: Understanding the Gray Shaded Area
This shaded region represents
Respiratory Center Excited
What excites the respiratory center?
High
CO₂
around the medulla.
Notice
When
the blue curve becomes high,
the gray area appears.
Meaning
Brain CO₂
is high.
↓
Respiratory center becomes excited.
↓
Breathing increases.
STEP 6: Whole Cycle Step by Step
Let’s follow one complete cycle.
Stage 1
Apnea
No breathing.
↓
CO₂ accumulates.
↓
Red curve rises.
Stage 2
Blood reaches brain.
↓
Blue curve rises.
↓
Respiratory center becomes excited.
↓
Gray area appears.
Stage 3
Hyperventilation
Breathing becomes
deeper
and
deeper.
↓
CO₂ is washed out.
↓
Red curve falls.
Stage 4
Brain has not yet noticed.
Because of delay,
it keeps stimulating breathing.
↓
Person overbreathes.
↓
Too much CO₂ is removed.
Stage 5
Finally,
low CO₂ reaches the brain.
↓
Blue curve falls.
↓
Respiratory center is inhibited.
↓
Breathing becomes smaller.
↓
Eventually
apnea develops.
Stage 6
Apnea
↓
CO₂ rises again.
↓
Whole cycle repeats.
Why Doesn’t the Brain Stop at the Correct Time?
Because
the respiratory center
is always reacting to
old CO₂ levels.
Imagine
driving a car
while seeing the road
5 seconds late.
You would
steer too much
one way,
then
too much
the other way.
Exactly the same happens here.
Easy Analogy
Imagine
A shower.
Water becomes hot.
You wait too long.
Then
you suddenly make it cold.
Again
you wait too long.
Then
you suddenly make it hot.
Because of delay,
temperature keeps oscillating.
Exactly like
Cheyne–Stokes breathing.
Why Does This Happen?
Normally,
feedback is rapid.
In Cheyne–Stokes,
feedback is delayed.
Therefore,
the respiratory center
always
overcorrects.
Causes of Cheyne–Stokes Breathing
1. Congestive Heart Failure (CHF)
Most common cause.
Why?
Blood circulates slowly.
↓
Longer delay
between lungs
and
brain.
↓
Respiratory center receives delayed CO₂ information.
↓
Cheyne–Stokes breathing develops.2. Brain Injury
Stroke
Head trauma
Brain tumors
↓
Respiratory center becomes unstable.
3. High Altitude
Hypoxia increases respiratory drive.
Combined with delayed feedback,
periodic breathing may occur, especially during sleep.
4. During Sleep
Can occur in
heart failure
or
neurological disease.
Clinical Features
Patient shows
- Gradually deeper breathing
- Then gradually shallower breathing
- Then apnea
- Then breathing starts again
Repeated over and over.
High-Yield MBBS Viva Points
Cheyne–Stokes Breathing
Definition
Cyclic breathing characterized by waxing and waning ventilation with intermittent apnea.
Mechanism
Delayed feedback
between
lungs
and
respiratory center.
Major Cause
Congestive heart failure.
Other Causes
- Stroke
- Brain injury
- Brain tumors
- High altitude
- Central sleep apnea
Compare Normal and Cheyne–Stokes
| Normal Breathing | Cheyne–Stokes Breathing |
|---|---|
| Regular depth | Waxing and waning depth |
| No apnea | Recurrent apnea |
| Rapid feedback | Delayed feedback |
| Stable CO₂ | Oscillating CO₂ |
Super Easy Memory Story
Imagine
A teacher
and
a student.
The teacher receives exam results
10 minutes late.
Whenever marks are low,
she overreacts.
Whenever marks are high,
she overreacts again.
Because the information is delayed,
she never gives the correct response.
Exactly the same happens to the respiratory center.
🎯 MBBS Golden Rule
Cheyne–Stokes Breathing
Delayed CO₂ feedback
↓
Respiratory center overcorrects
↓
Hyperventilation
↓
Hypocapnia
↓
Apnea
↓
Hypercapnia
↓
Cycle repeats
Final Concept to Never Forget
The key message of Figure 42.12 is that Cheyne–Stokes breathing is caused by instability in the respiratory control system due to delayed feedback.
- During apnea, CO₂ accumulates in the blood.
- Because it takes time for this blood to reach the medullary respiratory center, the brain responds late.
- The delayed response causes excessive hyperventilation, which lowers CO₂ too much.
- Again, because of the delay, breathing continues longer than necessary, eventually causing apnea.
- This repeating cycle produces the characteristic waxing and waning pattern of breathing seen in Cheyne–Stokes respiration, commonly associated with congestive heart failure, brain disorders, and central sleep apnea.
Sleep Apnea
Sleep Apnea
- Apnea means absence of spontaneous breathing.
- Occasional apnea can occur during normal sleep.
- In sleep apnea, the frequency and duration of apnea increase greatly.
- Episodes of apnea usually last 10 seconds or longer.
- These episodes may occur 300 to 500 times each night.
- Sleep apnea may be caused by:
- Obstruction of the upper airway, especially the pharynx.
- Impaired respiratory drive from the central nervous system.
Obstructive Sleep Apnea Is Caused By Blockage of the Upper Airway
- Normally, the pharyngeal muscles keep the airway open during inspiration.
- During sleep, these muscles relax.
- Even after relaxation, the airway usually remains open enough for adequate airflow.
- Some people have an especially narrow pharyngeal airway.
- In these people, muscle relaxation during sleep causes the pharynx to close completely.
- As a result, air cannot flow into the lungs.
- Soon after falling asleep, people with obstructive sleep apnea develop loud snoring and labored breathing.
- The snoring usually becomes progressively louder.
- It is then interrupted by a long silent period with no breathing (apnea).
- During apnea:
- PO₂ decreases significantly.
- PCO₂ increases significantly.
- These changes strongly stimulate respiration.
- This stimulation causes sudden attempts to breathe.
- These attempts produce loud snorts and gasps.
- Snoring then returns, followed by another episode of apnea.
- This cycle repeats several hundred times during the night.
- Repeated apnea causes fragmented and restless sleep.
- Therefore, patients usually develop:
- Excessive daytime drowsiness.
- Increased sympathetic activity.
- High heart rate.
- Pulmonary hypertension.
- Systemic hypertension.
- Greatly increased risk of cardiovascular disease.
- Obstructive sleep apnea commonly occurs in older people.
- It is also common in obese people.
- In these individuals, fat deposition in the soft tissues of the pharynx can narrow the airway.
- Excess fat in the neck may also compress the pharynx.
- In some people, sleep apnea may also be associated with:
- Nasal obstruction.
- A very large tongue.
- Enlarged tonsils.
- Certain shapes of the palate that greatly increase airway resistance during inspiration.
- Common treatments of obstructive sleep apnea include:
- Surgery to remove excess fat tissue from the back of the throat (uvulopalatopharyngoplasty).
- Removal of enlarged tonsils or adenoids.
- Tracheostomy to bypass the obstructed airway during sleep.
- Continuous positive airway pressure (CPAP) through nasal ventilation.
KEY CONCEPT
- Sleep apnea is repeated absence of breathing during sleep.
- It is caused by upper airway obstruction or impaired central respiratory drive.
- Obstructive sleep apnea occurs when relaxation of the pharyngeal muscles blocks a narrow airway.
- Apnea causes decreased PO₂ and increased PCO₂, which strongly stimulate breathing.
- Repeated apnea leads to fragmented sleep, daytime drowsiness, hypertension, and increased cardiovascular risk.
- Treatment includes surgery to remove airway obstruction or nasal CPAP.
Sleep Apnea
“Central” Sleep Apnea Occurs When the Neural Drive to Respiratory Muscles Is Transiently Abolished
- In some people with sleep apnea, the central nervous system temporarily stops sending signals to the respiratory muscles.
- This temporary loss of respiratory drive causes central sleep apnea.
- Disorders that can cause this include:
- Damage to the central respiratory centers.
- Abnormalities of the respiratory neuromuscular apparatus.
- Patients with central sleep apnea may have reduced ventilation even while awake.
- However, they are still able to breathe normally when they breathe voluntarily.
- During sleep, the breathing disorder usually becomes worse.
- This leads to more frequent episodes of apnea.
- During apnea:
- PO₂ decreases.
- PCO₂ increases.
- These changes continue until they reach a critical level that stimulates respiration again.
- These repeated changes in breathing cause restless sleep.
- They also produce clinical features similar to obstructive sleep apnea.
- In most patients with central sleep apnea, the cause is unknown.
- Instability of the respiratory drive may result from:
- Stroke.
- Other disorders that make the respiratory centers less responsive to CO₂ and H⁺.
- These patients are extremely sensitive to small doses of sedatives or narcotics.
- These drugs further reduce the responsiveness of the respiratory centers to CO₂.
- Medications that stimulate the respiratory centers may sometimes be helpful.
- However, nighttime ventilation with CPAP is usually required.
- In some patients, sleep apnea is caused by both obstructive and central mechanisms.
- This is called mixed sleep apnea.
- Mixed sleep apnea accounts for about 15% of all sleep apnea cases.
- Pure central sleep apnea accounts for less than 1% of cases.
- The most common cause of sleep apnea is obstruction of the upper airway.
Voluntary Control of Respiration
- Respiration is controlled mainly by the involuntary respiratory control system.
- However, breathing can also be controlled voluntarily for short periods.
- A person can hyperventilate or hypoventilate voluntarily.
- This can produce serious changes in blood PCO₂, pH, and PO₂.
- The reported world record for voluntary breath-holding under resting conditions, without hyperventilating with pure oxygen beforehand, is 11 minutes and 54 seconds.
- Hyperventilating with pure oxygen and removing large amounts of CO₂ before breath-holding has allowed some people to hold their breath underwater for more than 24 minutes.
- Ultra-elite apnea competitors can suppress the urge to breathe until oxygen saturation falls to about 50%.
- Unconsciousness eventually limits the duration of voluntary breath-holding.
KEY CONCEPT
- Central sleep apnea occurs when the brain temporarily stops sending respiratory signals to the breathing muscles.
- It causes repeated apnea, decreased PO₂, increased PCO₂, and restless sleep.
- The cause is often unknown, but stroke or damage to the respiratory centers can reduce their response to CO₂ and H⁺.
- CPAP is usually required for treatment, and mixed sleep apnea accounts for about 15% of cases, whereas pure central sleep apnea accounts for less than 1%.
- Breathing can be voluntarily controlled for short periods, but prolonged breath-holding eventually ends because of unconsciousness.
PREPARE AND MADE SELF LEARNING BY DR SHEEN
