


- Nephrotic syndrome is characterized by the loss of large amounts of plasma proteins into the urine.
- It develops in many patients with kidney disease.
- In some patients, nephrotic syndrome occurs without other major abnormalities of kidney function.
- However, it is usually associated with some degree of Chronic Kidney Disease (CKD).
- The main cause of protein loss in the urine is increased permeability of the glomerular membrane.
- Therefore, any disease that increases glomerular permeability can cause nephrotic syndrome.
Causes of Nephrotic Syndrome
- Chronic glomerulonephritis
- Primarily affects the glomeruli.
- Often causes markedly increased glomerular permeability.
- Amyloidosis
- Caused by deposition of an abnormal proteinoid substance in the walls of blood vessels.
- This seriously damages the glomerular basement membrane.
- Minimal-change nephrotic syndrome
- Associated with an abnormal immune response.
- Causes increased T-cell secretion of cytokines.
- Cytokines produce podocyte injury.
- Podocyte injury increases glomerular permeability.
- Increased permeability mainly affects low molecular weight proteins, such as albumin.
Minimal-Change Nephropathy
- Minimal-change nephropathy can occur in adults.
- It occurs more commonly in children between 2 and 6 years of age.
- Increased permeability of the glomerular capillary membrane may allow up to 40 grams of plasma protein to be lost in the urine each day.
- This is an extremely large amount of protein loss, especially in a young child.
- As a result, the plasma protein concentration may decrease to less than 2 g/dL.
- The plasma colloid osmotic pressure decreases:
- Normal value: 28 mm Hg
- Reduced value: Less than 10 mm Hg
Effects of Low Plasma Colloid Osmotic Pressure
- Low plasma colloid osmotic pressure causes large amounts of fluid to leave the capillaries.
- The fluid moves into tissues throughout the body.
- This results in severe edema.
- The mechanism of edema is discussed in Chapter 25.
KEY CONCEPT
- Nephrotic syndrome is characterized by massive loss of plasma proteins in the urine.
- The main cause is increased permeability of the glomerular membrane.
- Major causes include:
- Chronic glomerulonephritis
- Amyloidosis
- Minimal-change nephrotic syndrome
- Minimal-change nephropathy is most common in children aged 2–6 years.
- Protein loss may reach 40 g/day.
- Plasma protein concentration may decrease to less than 2 g/dL.
- Plasma colloid osmotic pressure falls from 28 mm Hg to less than 10 mm Hg.
- The reduced colloid osmotic pressure causes fluid movement into tissues, resulting in severe edema.
NEPHRON FUNCTION IN CKD
- Loss of functional nephrons requires the remaining nephrons to excrete more water and solutes.
- It might be expected that a decrease in the number of functional nephrons would greatly reduce renal excretion of water and solutes.
- This is because loss of nephrons reduces the Glomerular Filtration Rate (GFR).
- However, patients who have lost 75% to 80% of their nephrons can still excrete normal amounts of water and electrolytes.
- Therefore, they usually do not develop serious accumulation of fluid or most electrolytes in the body fluids.
- If the number of functional nephrons decreases further:
- Electrolytes begin to accumulate.
- Fluid retention develops.
- Death usually occurs when functional nephrons decrease to less than 5% to 10% of normal.
Excretion of Metabolic Waste Products
- Unlike electrolytes, metabolic waste products accumulate almost in proportion to the number of nephrons lost.
- Examples include:
- Urea
- Creatinine
- These substances depend mainly on glomerular filtration for their excretion.
- They are not reabsorbed as extensively as electrolytes.
- Creatinine is not reabsorbed at all.
- Therefore, the creatinine excretion rate is approximately equal to the creatinine filtration rate.
- (The small amount of creatinine secretion is ignored.)
Mathematical Equation
Creatinine Filtration Rate=GFR×Plasma Creatinine Concentration Creatinine Filtration Rate=Creatinine Excretion Rate
Effect of Decreased GFR
- When GFR decreases, the creatinine excretion rate temporarily decreases.
- As a result, creatinine accumulates in the body fluids.
- This causes the plasma creatinine concentration to increase.
- Plasma creatinine continues to rise until the creatinine excretion rate again equals the rate of creatinine production.
- Under steady-state conditions:
- Creatinine excretion rate = Creatinine production rate
- This normal excretion is achieved at the expense of an increased plasma creatinine concentration.
- This relationship is shown in:
- Figure 32.4
- Curve A of Figure 32.5
Regulation of Other Solutes
- Some solutes remain near the normal plasma concentration until GFR decreases below 20% to 30% of normal.
- These solutes include:
- Phosphate
- Urate
- Hydrogen ions
- When GFR decreases below 20% to 30%, the plasma concentrations of these solutes increase.
- However, they do not increase in direct proportion to the fall in GFR.
- This relationship is shown in Curve B of Figure 32.5.
- Near-normal plasma concentrations are maintained by:
- Excreting a larger fraction of the filtered load.
- Reducing tubular reabsorption.
- In some cases, increasing tubular secretion.
Regulation of Sodium and Chloride
- Plasma sodium and chloride concentrations remain almost constant, even with severe reductions in GFR.
- This relationship is shown in Curve C of Figure 32.5.
- This occurs because the kidneys greatly reduce tubular reabsorption of sodium and chloride.
Adaptation of Surviving Nephrons
- With a 75% loss of functional nephrons:
- Each surviving nephron must excrete 4 times more sodium.
- Each surviving nephron must excrete 4 times more water (volume) than under normal conditions.
- These changes are summarized in Table 32.6.
- Part of this adaptation occurs because:
- Blood flow increases in each surviving nephron.
- GFR increases in each surviving nephron.
- These changes result from:
- Hypertrophy of blood vessels
- Hypertrophy of glomeruli
- Functional vasodilation of blood vessels
- Even when total GFR decreases markedly, the kidneys can still maintain normal rates of excretion.
- This is achieved by decreasing tubular reabsorption of water and solutes.
KEY CONCEPT
- Loss of functional nephrons forces the remaining nephrons to excrete larger amounts of water and solutes.
- Patients can lose 75–80% of nephrons while still maintaining normal water and electrolyte balance.
- Death usually occurs when functional nephrons decrease below 5–10% of normal.
- Creatinine and urea accumulate because they depend mainly on glomerular filtration for excretion.
- Creatinine is not reabsorbed, so:
- Creatinine Filtration Rate = GFR × Plasma Creatinine Concentration
- Creatinine Filtration Rate = Creatinine Excretion Rate
- As GFR decreases, plasma creatinine concentration increases until excretion again equals production.
- Phosphate, urate, and hydrogen ions remain near normal until GFR falls below 20–30% of normal.
- Sodium and chloride remain nearly constant because tubular reabsorption decreases markedly.
- With 75% nephron loss, each surviving nephron excretes 4 times more sodium and water.
- Figures Mentioned: Figure 32.4, Figure 32.5 (Curve A, B, and C)
- Table Mentioned: Table 32.6
- Mathematical Equation:
- Creatinine Filtration Rate = GFR × Plasma Creatinine Concentration
- Creatinine Filtration Rate = Creatinine Excretion Rate
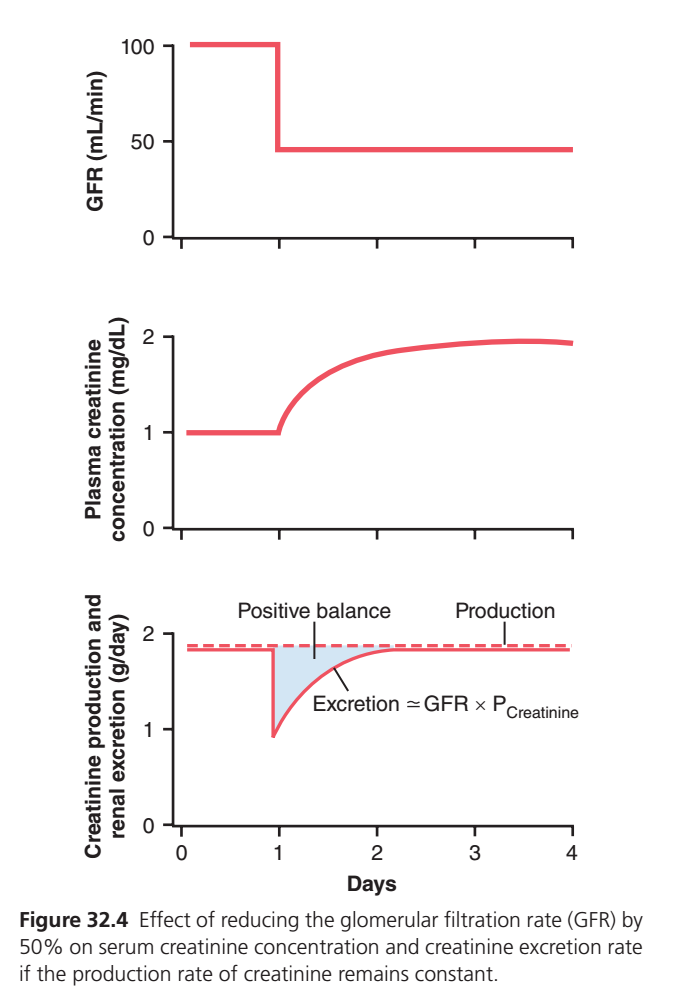
Figure 32.4: Effect of Reducing GFR by 50% on Plasma Creatinine and Creatinine Excretion
(Guyton Physiology, 15th Edition – Chapter 32)
Complete Easy & Conceptual Explanation of Every Line, Curve, and Shaded Area
This is one of the most important graphs in renal physiology because it explains why serum creatinine increases when GFR decreases.
The easiest way to understand this graph is to remember one simple principle:
Creatinine production by muscles remains almost constant every day.
If the kidneys suddenly filter less blood (↓ GFR), they cannot remove all the creatinine.
Creatinine accumulates in the blood until its blood level rises enough that the kidneys can again excrete the same amount being produced.
This graph shows how the body reaches this new balance.
Before Understanding the Graph
Let’s learn three important terms.
1. GFR (Glomerular Filtration Rate)
GFR means
How much blood the kidneys filter every minute.
Normal GFR
≈100–125 mL/minHigher GFR
↓
More filtration
↓
More creatinine removed.
Lower GFR
↓
Less filtration
↓
Less creatinine removed.
2. Creatinine
Creatinine is
- Produced by muscles
- Produced continuously every day
- Removed almost entirely by the kidneys
Think of creatinine as daily garbage produced by the body.
Muscles

↓

Creatinine produced every day

↓

Kidneys remove it
3. Balance
Normally
Creatinine Produced

=

Creatinine Excreted
So
Blood creatinine stays constant.
Overall Structure of the Figure
The figure has three graphs.
Top Graph
Shows
GFR
Middle Graph
Shows
Plasma creatinine concentration
Bottom Graph
Shows
Creatinine production and excretion
TOP GRAPH
Y-axis
GFR (mL/min)
This tells us
How much blood is filtered every minute.
X-axis
Time (Days)
The graph follows the patient over several days.
Red Horizontal Line Before Day 1
Notice
The red line is flat.
──────────It stays at about
100 mL/minMeaning
Kidneys are normal.
Nothing changes.During This Period
Normal GFR

↓

Normal filtration

↓

Normal creatinine removal

↓

Normal blood creatinine
Sudden Vertical Drop
At about Day 1
The red line suddenly falls.
─────│
     │
     │
This is the most important event.
It means
GFR suddenly decreases by 50%.
Example
Before

100 mL/min

↓

After

50 mL/min
The kidneys are suddenly filtering only half as much blood.
Imagine
A factory had
100 workersSuddenly
Only
50 workersremain.
The factory now removes waste much more slowly.
Exactly the same happens in the kidney.
Flat Line After the Drop
Notice
After the sudden fall,
the line becomes flat again.
This means
The GFR stays low.
It does not recover.
It remains around
50 mL/minMIDDLE GRAPH
Y-axis
Plasma Creatinine Concentration
(mg/dL)
This means
How much creatinine is present in the blood.
Before Day 1
The red line is flat.
Approximately
1 mg/dLEverything is normal.
Why?
Because
Production

=

Excretion
What Happens Immediately After GFR Falls?
The kidneys suddenly filter only half as much blood.
Therefore
They immediately excrete less creatinine.
But
Muscles continue producing the same amount.
Imagine
Every day
Produced

2 bags of garbage
Normally
Garbage truck removes
2 bagsEverything stays clean.
Now
Truck removes
Only
1 bagBut
People still produce
2 bagsResult
Garbage begins accumulating.
Exactly the same happens with creatinine.
Why Does Plasma Creatinine Rise?
Because
Production

>

Excretion
Extra creatinine stays inside the blood.
Day after day
More accumulates.
Therefore
Blood creatinine gradually rises.
Why Doesn’t It Rise Forever?
Very important concept.
As plasma creatinine increases,
there is more creatinine available to be filtered by each milliliter of GFR.
Remember
Creatinine excretion approximately equals
Excretion ≈ GFR × Plasma CreatinineInitially
50 × 1

=

50 units
Too little.
Later
50 × 2

=

100 units
Now
Even though GFR is still only half,
the higher plasma creatinine concentration allows the kidneys to excrete the original amount again.
Final Flat Portion
The line levels off around
2 mg/dLWhy?
Because
A new balance has been reached.
Now
Production

=

Excretion
again.
BOTTOM GRAPH
This graph explains why the middle graph rises.
Y-axis
Creatinine Production and Renal Excretion
(g/day)
Dashed Horizontal Line
Notice
The dashed line never changes.
This represents
Creatinine Production
The muscles produce
the same amount
every day.
Example
Day 1

2 g
Day 2
2 gDay 3
2 gNo change.
Why Doesn’t Production Change?
Because
The kidneys do not produce creatinine.
Muscles do.
Muscles continue producing it at nearly the same rate.
Solid Red Line
This represents
Creatinine Excretion
Before Day 1
The solid line equals the dashed line.
Meaning
Production

=

Excretion
Everything is balanced.
Sudden Drop
When GFR suddenly falls,
creatinine excretion immediately falls.
Why?
Because
The kidneys cannot filter enough blood.
Imagine
Before
Produce 2

Remove 2
After kidney injury
Produce 2

Remove only 1
Blue Shaded Area
This blue shaded region is extremely important.
It is labeled
Positive Balance
Many students misunderstand this.
Positive balance means
More creatinine is entering the body (being produced) than leaving it (being excreted).
So
Production

>

Excretion
The extra creatinine stays inside the blood.
Imagine
Every day
Produced

2 kg
Removed
1 kgExtra
1 kgremains inside.
Day after day,
this extra creatinine accumulates.
That accumulation is represented by the blue shaded area.
It shows the total amount of creatinine retained in the body during the period before a new steady state is reached.
Curved Rise of the Solid Red Line
Notice
The excretion line gradually rises.
Why?
Because
Plasma creatinine is rising.
Higher plasma creatinine means
more creatinine is filtered per milliliter of GFR.
So even though GFR remains low,
creatinine excretion slowly increases.
Why Does It Finally Meet the Dashed Line?
Eventually
Excretion

=

Production
again.
At that moment
No more creatinine accumulates.
Positive balance ends.
Blood creatinine becomes stable.
Formula Written on the Graph
The graph says
Excretion ≈ GFR × Plasma CreatinineThis is the key equation.
Suppose
Initially
GFR

100
Creatinine
1Then
Excretion

100 ×1

=

100
Now
GFR falls
50Initially
Creatinine is still
1So
50 ×1

=

50
Too little.
Creatinine accumulates.
Later
Blood creatinine rises to
2Now
50 ×2

=

100
The kidneys are once again excreting the same amount of creatinine that the muscles produce.
Relationship Between All Three Graphs
Everything happens in this order:
GFR suddenly decreases by 50%
           ↓
Kidneys excrete less creatinine
           ↓
Creatinine production remains unchanged
           ↓
More creatinine stays in the blood
           ↓
Plasma creatinine concentration rises
           ↓
Higher plasma creatinine increases filtered creatinine
           ↓
Creatinine excretion gradually increases
           ↓
Excretion again equals production
           ↓
Plasma creatinine stabilizes at a higher level
One-Line Explanation of Every Line
| Graph Part | Meaning |
|---|---|
| Top flat line | Normal GFR (~100 mL/min); kidneys filter blood normally. |
| Sudden vertical drop | GFR abruptly decreases by 50%, such as after loss of kidney function. |
| Lower flat line | GFR remains permanently reduced (~50 mL/min). |
| Middle flat line | Plasma creatinine is initially normal (~1 mg/dL). |
| Middle upward curve | Creatinine accumulates in the blood because excretion is initially less than production. |
| Middle final flat line | Plasma creatinine reaches a new steady state (~2 mg/dL), where excretion again equals production. |
| Bottom dashed line | Creatinine production by muscles remains constant every day. |
| Bottom solid red line | Creatinine excretion. It falls immediately after GFR decreases, then gradually rises as plasma creatinine increases. |
| Blue shaded area (Positive balance) | Represents the amount of creatinine retained in the body because production temporarily exceeds excretion. |
| Equation: Excretion ≈ GFR × Plasma Creatinine | Shows that creatinine excretion depends on both GFR and plasma creatinine concentration. A fall in GFR must be offset by a rise in plasma creatinine to restore balance. |
KEY CONCEPT (Exam Point)
- Creatinine production remains nearly constant because it depends mainly on muscle metabolism.
- A sudden 50% reduction in GFR immediately decreases creatinine excretion, while creatinine production does not change.
- This creates a positive creatinine balance, causing creatinine to accumulate in the blood and plasma creatinine concentration to rise.
- As plasma creatinine rises, creatinine excretion gradually increases because Creatinine Excretion ≈ GFR × Plasma Creatinine.
- A new steady state is reached when creatinine excretion once again equals creatinine production. In this example, halving the GFR approximately doubles the plasma creatinine concentration, making serum creatinine a useful indicator of changes in GFR.
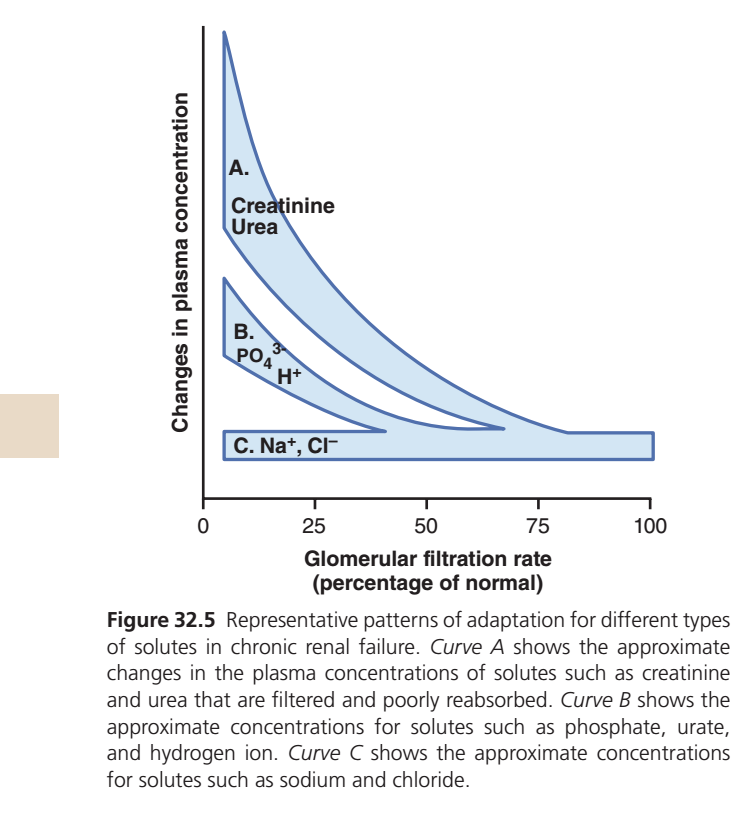
Figure 32.5: Adaptation of Different Solutes in Chronic Kidney Disease (CKD)
(Guyton Physiology, 15th Edition – Chapter 32)
Complete Easy & Conceptual Explanation of Every Curve, Every Line, and Every Shaded Area
This is one of the most conceptual graphs in renal physiology. It explains:
When GFR decreases in Chronic Kidney Disease (CKD), why do some substances increase a lot in the blood, some increase only a little, and some remain almost normal?
Many students memorize this graph, but the real understanding comes from one simple idea:
Every substance is handled differently by the kidney.
Some substances are not reabsorbed, some are partly reabsorbed, and some are very tightly regulated.
That is why each substance follows a different curve.
First Understand the Two Axes
X-Axis (Horizontal Axis)
Glomerular Filtration Rate (Percentage of Normal)
This axis shows how well the kidneys are filtering blood.
Look carefully:
100%
│
│ Normal kidney function
│
75%
│ Mild CKD
│
50%
│ Moderate CKD
│
25%
│ Severe CKD
│
0%
│ Kidney failure
Notice something important.
The graph goes from
100%

↓

0%
as you move from right to left.
That means:
- Right side = Healthy kidneys
- Left side = Severe kidney failure
Y-Axis (Vertical Axis)
Changes in Plasma Concentration
This tells us
How much the level of a substance in the blood changes.
Higher on the graph
↓
Higher blood concentration.
Lower on the graph
↓
Normal blood concentration.
Before Understanding the Curves
Imagine the kidney is a garbage disposal system.
Every day,
different wastes are produced.
Some wastes
- are removed easily,
- some are partly removed,
- some are carefully controlled.
When kidney function decreases,
each waste behaves differently.
That is exactly what this graph shows.
There Are Three Curves
The graph divides all substances into
Curve A
Curve B
Curve C
Let’s study each one separately.
CURVE A
Creatinine
Urea
These are written inside the upper shaded area.
What Are Creatinine and Urea?
Both are waste products.
Creatinine
Produced by muscles.
Urea
Produced from protein metabolism.
Their job is simple.
Produced

↓

Kidney removes them

↓

They leave in urine
Are They Reabsorbed?
Very little.
Especially creatinine.
Therefore,
their removal depends almost entirely on GFR.
What Happens When GFR Falls?
Imagine
Normal kidney
100 garbage bags

↓

100 removed
Now kidney function decreases.
100 garbage bags

↓

Only 40 removed
What happens?
Garbage accumulates.
Exactly the same happens with
- Creatinine
- Urea
Why Does Curve A Rise So High?
Because
The kidneys cannot remove these wastes.
So they continue accumulating in the blood.
The lower the GFR,
the higher the blood level.
That is why
Curve A rises very steeply.
Meaning of the Curve
GFR ↓

↓

Creatinine ↑↑↑

↓

Urea ↑↑↑
This is why
patients with CKD have
- high serum creatinine
- high blood urea.
Why Is Creatinine Used to Measure Kidney Function?
Because
Creatinine depends almost entirely on GFR.
It is
- filtered
- minimally reabsorbed
- produced continuously.
Therefore
When GFR falls,
Creatinine rises.
CURVE B
Notice
Curve B rises,
but
not as much as Curve A.
Substances included
- Phosphate (PO₄³⁻)
- Urate
- Hydrogen ions (H⁺)
Why Don’t These Increase As Much?
Because
The kidney adapts.
Instead of simply allowing them to accumulate,
the remaining nephrons increase their excretion.
This is called
Adaptive increase in excretion per nephron.
Imagine
Initially
100 workers.
Each removes
10 boxesNow
Only
50 workers remain.
Instead of removing
10 boxes,
each worker removes
20 boxes.
The total work becomes almost normal.
Exactly the same happens.
Each surviving nephron works harder.
Example
Phosphate
Normally
Much phosphate is reabsorbed.
In CKD
The kidneys reduce phosphate reabsorption.
More phosphate enters urine.
Therefore
Blood phosphate rises,
but not as dramatically as creatinine.
Hydrogen Ion (H⁺)
The remaining nephrons
increase acid secretion.
Therefore
Acidosis develops,
but more slowly.
Urate
Remaining nephrons
increase urate excretion.
Again,
blood level rises only moderately.Meaning of Curve B
GFR ↓

↓

Moderate increase

↓

Body partially compensates
CURVE C
This is the lowest curve.
Notice
It is almost flat.
Substances included
- Sodium (Na⁺)
- Chloride (Cl⁻)
Why Don’t Sodium and Chloride Increase?
This is the most important concept.
The body controls
Sodium
very precisely.
Suppose
Kidney function decreases.
Does sodium immediately rise?
No.
Why?
Because
The kidneys change sodium excretion.
The body also adjusts:
- thirst,
- water intake,
- hormones,
- RAAS,
- ANP,
- sympathetic activity.
These mechanisms keep sodium concentration almost normal.
Think About Salt
Imagine
Today you eat
10 teaspoonsTomorrow
Kidney removes
almost exactly
10 teaspoons.
Even in CKD,
the kidneys adjust over time so that sodium excretion again equals sodium intake, although this may require changes in extracellular fluid volume and blood pressure.
Therefore
Blood sodium remains
around
135–145 mEq/LMost CKD patients have nearly normal sodium concentration unless another problem develops (such as dehydration, excess water intake, or severe kidney failure).
Same for Chloride
Chloride follows sodium.
Therefore
it also remains almost constant.
Meaning of Curve C
GFR ↓

↓

Hormonal compensation

↓

Sodium stays nearly normal
Why Is Curve C Almost Horizontal?
Because
Even when kidney function decreases,
the body strongly defends sodium concentration.
Instead of allowing sodium concentration to rise,
it changes
- sodium excretion,
- water balance,
- hormone secretion.
Therefore
the concentration changes very little.
The Blue Shaded Areas
Notice
The blue shaded regions lie above each curve.
They visually represent the increase in plasma concentration as GFR decreases.
Large shaded area (Curve A)
Means
Very large increase
Examples
- Creatinine
- Urea
Medium shaded area (Curve B)
Means
Moderate increase
Examples
- Phosphate
- Urate
- Hydrogen ions
Very small shaded area (Curve C)
Means
Very little change
Examples
- Sodium
- Chloride
Easy Way to Remember
Imagine three buckets.
Bucket A
No control.
Waste simply accumulates.
Creatinine

Urea
Huge increase.
Bucket B
Partial control.
The kidney adapts.
Phosphate

Urate

Hydrogen ions
Moderate increase.
Bucket C
Very strict control.
The body protects these substances.
Sodium

Chloride
Almost no increase.
Clinical Importance
This graph explains many findings in CKD:
Creatinine and Urea
These rise markedly, making them useful indicators of declining GFR.
Phosphate
Moderately elevated phosphate contributes to mineral and bone disorders in CKD.
Hydrogen ions
Retention of H⁺ causes metabolic acidosis, although the kidneys initially compensate by increasing acid excretion per remaining nephron.
Sodium
Plasma sodium concentration is often normal because the body regulates it tightly. However, CKD patients may still retain excess total-body sodium and water, leading to edema and hypertension despite a normal serum sodium concentration.
Complete Flow
CKD develops

↓

GFR decreases

↓

Kidneys filter less blood

↓

Different substances behave differently

↓

Creatinine & Urea
Huge accumulation

↓

Phosphate, Urate, H⁺
Moderate accumulation
because remaining nephrons adapt

↓

Na⁺ & Cl⁻
Hormonal regulation keeps plasma
concentrations nearly normal
One-Line Explanation of Every Part
| Graph Part | Meaning |
|---|---|
| X-axis | Percentage of normal GFR. Moving left indicates worsening kidney function. |
| Y-axis | Change in the plasma concentration of different solutes. Higher position means a higher blood concentration. |
| Curve A | Creatinine and urea increase markedly as GFR falls because they depend mainly on filtration for removal and are poorly reabsorbed. |
| Curve B | Phosphate (PO₄³⁻), urate, and H⁺ increase moderately because surviving nephrons increase their excretion, partially compensating for the reduced GFR. |
| Curve C | Sodium (Na⁺) and chloride (Cl⁻) remain close to normal because powerful hormonal and renal mechanisms tightly regulate their plasma concentrations. |
| Large shaded area (A) | Represents a large rise in plasma concentration with declining GFR. |
| Medium shaded area (B) | Represents a moderate rise due to partial renal adaptation. |
| Small shaded area (C) | Represents minimal change because homeostatic regulation maintains near-normal plasma concentrations. |
KEY CONCEPT (Exam Point)
- As GFR decreases in CKD, different solutes accumulate in the blood to different extents depending on how the kidneys normally handle them.
- Curve A (Creatinine and Urea): These are filtered and minimally reabsorbed, so their plasma concentrations rise markedly as GFR falls.
- Curve B (Phosphate, Urate, H⁺): These rise moderately because surviving nephrons increase their excretion, providing partial compensation.
- Curve C (Na⁺ and Cl⁻): Plasma concentrations remain nearly normal because powerful homeostatic mechanisms regulate sodium and chloride balance, even though total-body sodium and water may increase.
- The key message: A fall in GFR does not produce the same rise in every solute. The extent of accumulation depends on renal handling of that solute and the body’s compensatory mechanisms.
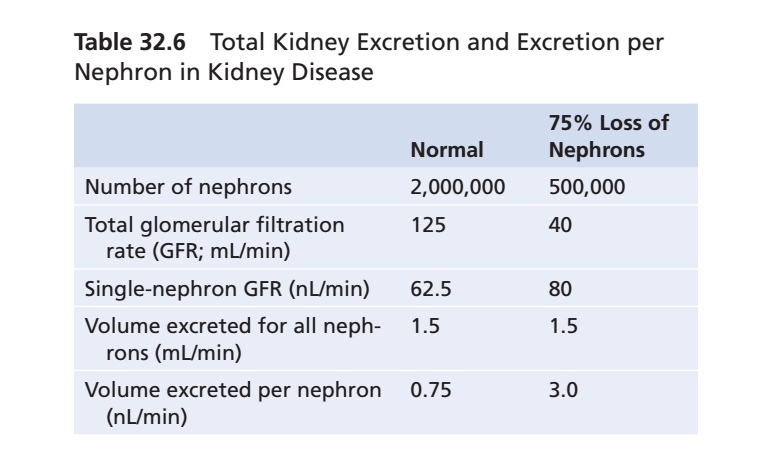
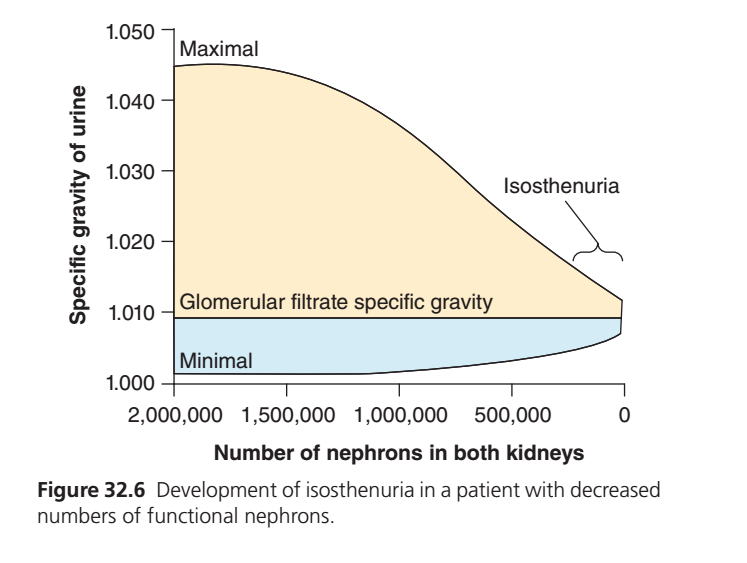
Figure 32.6 — Development of Isosthenuria with Decreasing Number of Functional Nephrons
This figure explains how the kidney gradually loses its ability to concentrate or dilute urine as nephrons are lost in Chronic Kidney Disease (CKD).
Step 1: What is the main idea of this graph?
👉 The graph shows one important concept:
As the number of working nephrons decreases, the kidney loses its ability to make urine either very concentrated or very dilute.
Eventually, the kidney produces urine with almost the same specific gravity as glomerular filtrate, a condition called Isosthenuria.
Step 2: X-Axis (Horizontal Line)
Number of nephrons in both kidneys
2,000,000 -------------------------------> 0
Normal kidneys                         Almost no nephrons
What does it mean?
- Left side = Healthy kidneys
- Right side = Severe CKD
Normally both kidneys contain about
≈ 2 million nephrons
As CKD progresses,
2,000,000
 ↓
1,500,000
 ↓
1,000,000
 ↓
500,000
 ↓
Almost 0
The kidney gradually loses functioning nephrons.
Step 3: Y-Axis (Vertical Line)
Specific Gravity of Urine
1.050
↑
1.040
↑
1.030
↑
1.020
↑
1.010
↑
1.000
Specific gravity tells us
How concentrated or dilute urine is compared with pure water.
Normal values
Pure water
1.000Very dilute urine
≈1.001–1.005Average urine
≈1.015–1.025Very concentrated urine
≈1.040–1.050Step 4: Upper Black Curved Line (Maximum)
Maximal
──────────────╮
              │
             ╱
           ╱
        ╱
     ╱
  ╱
This line represents
Maximum urine concentrating ability
It answers the question
“How concentrated can the kidney make urine?”
Left Side (Healthy Kidney)
Healthy kidneys can conserve water.
If a person
- does not drink water
- is dehydrated
- sweats a lot
the kidney produces
Very concentrated urine

Specific gravity
≈1.045
That is why the upper line starts very high.
Moving Right
As nephrons die,
the kidney loses concentrating ability.
The line falls.
Healthy

1.045
↓

1.040
↓

1.035
↓

1.030
↓

1.025
↓

1.020
↓

1.012
The kidney can no longer concentrate urine.
Step 5: Lower Black Curved Line (Minimal)
Minimal
────────────╯
This line shows
Maximum urine dilution ability
It answers
“How dilute can the kidney make urine?”
Healthy Kidney
When someone drinks lots of water
the kidney removes excess water.
It makes
Very dilute urine
Specific gravity

≈1.001
Therefore,
the lower line begins very close to
1.000Moving Right
As CKD worsens,
the kidney loses the ability to dilute urine.
So this line gradually rises.
1.001

↓

1.002

↓

1.003

↓

1.004

↓

1.006

↓

1.008
Eventually,
even dilute urine cannot be produced.
Step 6: Horizontal Line
Glomerular filtrate specific gravity

──────────────
≈1.010
This is one of the most important lines.
This line represents
Specific gravity of freshly filtered fluid
This is the fluid entering
Bowman’s capsule
before the tubules modify it.
Normally,
glomerular filtrate has
Specific gravity

≈1.010
Healthy Kidney
The tubules change this filtrate.
They can make it
Very dilute

OR

Very concentrated
Diseased Kidney
Tubules lose this ability.
Urine remains almost identical to filtrate.
Therefore,
urine specific gravity stays around
1.010Step 7: Yellow Shaded Area
This large yellow area represents
Ability to concentrate urine
Healthy kidney
Can increase urine concentration

from

1.010

to

1.045
Very large range.
As nephrons die
the yellow area becomes
smaller
↓
smaller
↓
smaller
↓
almost disappears.
Meaning
The kidney gradually loses the ability to save water.
Step 8: Blue Shaded Area
Blue area represents
Ability to dilute urine
Healthy kidney
Can decrease urine concentration

from

1.010

down to

1.001
Again,
this ability becomes
smaller
↓
smaller
↓
smaller
↓
almost disappears.
Meaning
The kidney cannot remove excess water efficiently.
Step 9: Why Both Shaded Areas Become Narrow?
Healthy kidney has
Large concentrating ability

+

Large diluting ability
CKD destroys nephrons.
Surviving nephrons work harder,
but eventually they cannot
- concentrate urine
- dilute urine
Therefore
both shaded areas become narrower.
Step 10: Isosthenuria (Bracket on Right)
Isosthenuria
     }
This is the most important concept in the figure.
Meaning
Iso = Same
Sthenuria = Urine concentration
So,
Isosthenuria = Urine always has nearly the same concentration.
Specific gravity remains approximately
1.010regardless of whether the patient
- drinks a lot of water
- is dehydrated
- sweats
- receives IV fluids
The kidneys cannot adjust urine concentration anymore.
Step 11: What Happens in Healthy vs CKD Kidneys?
| Healthy Kidney | CKD Kidney |
|---|---|
| Can concentrate urine | Cannot concentrate urine |
| Can dilute urine | Cannot dilute urine |
| Urine SG varies from about 1.001–1.045 | Urine SG stays near 1.010 |
| Tubules work normally | Tubules lose function |
| Water balance is maintained | Water balance becomes difficult |
Step 12: Easy Memory Trick
Imagine a tap with two controls.
Healthy Kidney
You can turn the tap:
- Very hot (high concentration)
- Very cold (low concentration)
There is a wide range of adjustment.
CKD Kidney
The tap becomes stuck in the middle.
No matter what you do:
- Drink lots of water ❌
- Become dehydrated ❌
The tap always gives lukewarm water.
Similarly, the kidney always produces urine with a specific gravity of about 1.010.
That fixed urine concentration is called Isosthenuria.
KEY CONCEPT
- The x-axis shows the progressive loss of functional nephrons.
- The y-axis shows the specific gravity (concentration) of urine.
- The upper black curve represents the maximum urine concentrating ability, which decreases as nephrons are lost.
- The lower black curve represents the maximum urine diluting ability, which also decreases as nephrons are lost.
- The horizontal line at ~1.010 represents the specific gravity of glomerular filtrate.
- The yellow shaded area shows the kidney’s ability to concentrate urine.
- The blue shaded area shows the kidney’s ability to dilute urine.
- As CKD progresses, both shaded areas become narrower, showing loss of concentrating and diluting capacity.
- In advanced CKD, urine specific gravity remains close to 1.010, a condition called isosthenuria.
Isosthenuria—Inability of the Kidney to Concentrate or Dilute the Urine
Isosthenuria—Inability of the Kidney to Concentrate or Dilute the Urine
- In diseased kidneys, the remaining nephrons have a rapid tubular flow rate.
- This rapid flow causes the renal tubules to lose their ability to fully concentrate or dilute urine.
Why the Concentrating Ability Decreases
- The kidney’s concentrating ability becomes impaired because:
- (1) Rapid flow of tubular fluid through the collecting ducts reduces the percentage of tubular fluid that can be reabsorbed.
- (2) Rapid flow through the loop of Henle and collecting ducts prevents the countercurrent mechanism from working effectively.
- As a result, the medullary interstitial fluid cannot become highly concentrated.
- As more nephrons are destroyed:
- The kidney’s maximum concentrating ability gradually decreases.
- Urine osmolarity approaches the osmolarity of the glomerular filtrate.
- Urine specific gravity approaches the specific gravity of the glomerular filtrate.
- (Figure 32.6)
Diluting Mechanism Also Becomes Impaired
- The kidney’s ability to dilute urine also decreases when the number of nephrons becomes markedly reduced.
- Rapid flushing of fluid through the loops of Henle occurs.
- A high load of solutes, such as urea, remains in the tubular fluid of this nephron segment.
- Therefore, the kidney cannot dilute urine effectively.
- The minimum urine osmolality approaches that of the glomerular filtrate.
- The minimum urine specific gravity also approaches that of the glomerular filtrate.
Clinical Test of Renal Function
- In chronic kidney disease (CKD), the concentrating mechanism is impaired more than the diluting mechanism.
- A useful clinical test is to measure how well the kidneys concentrate urine.
- This test is performed after restricting water intake for 12 hours or more.
Plasma Concentration Changes of Different Solutes
- Creatinine and urea
- Their excretion rate becomes equal to their production rate despite reduced GFR.
- This occurs at the cost of an increased plasma creatinine concentration.
- (Figure 32.4 and Figure 32.5, Curve A)
- Phosphate, urate, and hydrogen ions
- Their plasma concentrations remain near normal until GFR falls below 20%–30% of normal.
- After that, their plasma concentrations increase.
- However, the increase is not proportional to the fall in GFR.
- (Figure 32.5, Curve B)
- The kidney maintains these concentrations by:
- Decreasing tubular reabsorption.
- In some cases, increasing tubular secretion.
- Sodium and chloride
- Their plasma concentrations remain virtually constant, even with severe reductions in GFR.
- (Figure 32.5, Curve C)
- This is achieved by greatly decreasing tubular reabsorption of these electrolytes.
Adaptation of the Remaining Nephrons
- If 75% of functional nephrons are lost:
- Each surviving nephron must excrete:
- 4 times more sodium.
- 4 times more fluid volume than under normal conditions.
- (Table 32.6)
- Each surviving nephron must excrete:
- This adaptation occurs because:
- Blood flow increases in the surviving nephrons.
- GFR increases in each surviving nephron.
- Blood vessels and glomeruli undergo hypertrophy.
- Functional changes also occur.
Table 32.6
Total Kidney Excretion and Excretion per Nephron in Kidney Disease
- Number of nephrons
- Normal = 2,000,000
- After 75% loss = 500,000
- Total GFR
- Normal = 125 mL/min
- After 75% loss = 40 mL/min
- Single-nephron GFR
- Normal = 62.5 nL/min
- After 75% loss = 80 nL/min
- Total volume excreted
- Normal = 1.5 mL/min
- After 75% loss = 1.5 mL/min
- Volume excreted per nephron
- Normal = 0.75 nL/min
- After 75% loss = 3.0 nL/min
Mathematical Calculation
Increase in volume excreted per nephron:
- Normal = 0.75 nL/min
- After 75% nephron loss = 3.0 nL/min
Calculation:0.753.0=4
Answer: Each surviving nephron excretes 4 times more volume.
KEY CONCEPT
- Rapid tubular flow in diseased kidneys reduces both urine concentrating and diluting abilities.
- Rapid flow prevents the countercurrent mechanism from working effectively.
- As nephron loss increases, urine osmolarity and specific gravity approach those of the glomerular filtrate (Figure 32.6).
- Creatinine and urea increase markedly as GFR falls (Figure 32.4, Figure 32.5 Curve A).
- Phosphate, urate, and hydrogen ions remain near normal until GFR falls below 20%–30%, then increase (Figure 32.5 Curve B).
- Sodium and chloride concentrations remain nearly constant because tubular reabsorption decreases (Figure 32.5 Curve C).
- After 75% nephron loss, each remaining nephron excretes 4 times more sodium and fluid (Table 32.6).
- Restricting water intake for 12 hours or more is a useful clinical test for assessing the kidney’s urine-concentrating ability in CKD.
Effects of Renal Failure on the Body Fluids—Uremia
Effects of Renal Failure on the Body Fluids—Uremia
- The effects of chronic kidney disease (CKD) on body fluids depend on:
- Water intake.
- Food intake.
- Degree of kidney function impairment.
- If a person has complete renal failure but continues taking the same amounts of food and water:
- The concentrations of different substances in the extracellular fluid change.
- (Figure 32.7)
Important Effects of Renal Failure
Water Retention and Development of Edema in CKD
- If water intake is restricted immediately after kidney injury begins:
- Total body fluid increases only slightly.
- If fluid intake is not restricted:
- The patient drinks according to the normal thirst mechanism.
- Body fluids increase rapidly.
- As long as salt and fluid intake are not excessive:
- Fluid accumulation may not become severe until kidney function falls to 25% of normal or less.
- This occurs because:
- The surviving nephrons excrete larger amounts of salt and water.
- Even a small amount of fluid retention:
- Along with increased renin secretion.
- And increased angiotensin II (Ang II) formation in ischemic kidney disease.
- Can cause severe hypertension.
- When kidney function decreases enough to require dialysis:
- Hypertension almost always develops.
- In many patients:
- Severe restriction of salt intake.
- Or removal of extracellular fluid by dialysis.
- Controls hypertension.
- Some patients continue to have hypertension even after excess sodium is removed by dialysis.
- In these patients:
- Removal of the ischemic kidneys usually corrects hypertension.
- This is effective if dialysis prevents fluid retention.
- Removal of the kidneys eliminates excessive renin secretion.
- This also reduces excessive Ang II formation.
Increase in Urea and Other Nonprotein Nitrogens (Azotemia)
- Nonprotein nitrogens include:
- Urea.
- Uric acid.
- Creatinine.
- A few other compounds.
- These substances are the end products of protein metabolism.
- They must be removed to maintain normal protein metabolism in cells.
- During total renal failure:
- The concentration of nonprotein nitrogens, especially urea, may rise to 10 times the normal level within 1–2 weeks.
- In CKD:
- Their concentrations increase approximately in proportion to the reduction in GFR.
- Measuring:
- Urea.
- Creatinine.
- Provides an important method for assessing the severity of CKD.
Acidosis in CKD
- Each day, the body normally produces about 50–80 millimoles more metabolic acid than metabolic alkali.
- When the kidneys fail:
- Acid accumulates in the body fluids.
- Body fluid buffers can normally neutralize:
- 500–1000 millimoles of acid.
- Phosphate compounds in bone can buffer:
- An additional few thousand millimoles of H⁺.
- When the buffering capacity is exhausted:
- Blood pH falls markedly.
- If blood pH falls below about 6.8:
- The patient becomes comatose.
- Death occurs.
Anemia in CKD Caused By Decreased Erythropoietin Secretion
- Severe CKD almost always causes anemia.
- The main cause is:
- Decreased secretion of erythropoietin by the kidneys.
- Erythropoietin normally stimulates the bone marrow to produce red blood cells.
- Severely damaged kidneys cannot produce enough erythropoietin.
- This decreases red blood cell production.
- As a result:
- Anemia develops.
- Since 1989:
- Recombinant erythropoietin has been available for treating anemia in patients with chronic renal failure.
Osteomalacia in CKD Caused By Decreased Production of Active Vitamin D and By Phosphate Retention By the Kidneys
- Prolonged CKD causes osteomalacia.
- In osteomalacia:
- Bones are partially absorbed.
- Bones become greatly weakened.
- Vitamin D must be activated in two stages:
- First in the liver.
- Then in the kidneys.
- The active form is 1,25-dihydroxycholecalciferol.
- Active vitamin D promotes calcium absorption from the intestine.
- Serious kidney damage greatly reduces the production of active vitamin D.
- Reduced active vitamin D:
- Decreases intestinal calcium absorption.
- Reduces calcium available for bones.
- Another cause of bone demineralization is:
- Increased serum phosphate due to decreased GFR.
- Increased serum phosphate:
- Binds with calcium in plasma.
- Lowers ionized calcium concentration.
- Low plasma ionized calcium:
- Stimulates parathyroid hormone secretion.
- Secondary hyperparathyroidism:
- Stimulates calcium release from bones.
- Causes further bone demineralization.
Figure 32.7
Effect of Kidney Failure on Extracellular Fluid Constituents
- During kidney shutdown:
- Increase:
- Water.
- Nonprotein nitrogens (NPN).
- Phenols.
- Sulfate.
- Phosphate.
- Potassium.
- Hydrogen ions.
- Decrease:
- Bicarbonate (HCO₃⁻).
- Increase:
- Sodium (Na⁺) changes very little.
- (Figure 32.7)
KEY CONCEPT
- The effects of CKD on body fluids depend on water intake, food intake, and the severity of kidney failure.
- Uremia is caused by accumulation of urea and other waste products because the kidneys cannot excrete them.
- Major effects include edema, acidosis, increased nonprotein nitrogens, and accumulation of other kidney-excreted substances (Figure 32.7).
- Fluid retention and increased renin–Ang II activity commonly cause hypertension.
- Urea and creatinine levels increase with decreasing GFR and help assess CKD severity.
- The body normally produces 50–80 mmol more metabolic acid than alkali each day; blood pH below 6.8 is life-threatening.
- Severe CKD causes anemia due to reduced erythropoietin production.
- CKD causes osteomalacia because of reduced active vitamin D production and phosphate retention, leading to secondary hyperparathyroidism and bone demineralization.
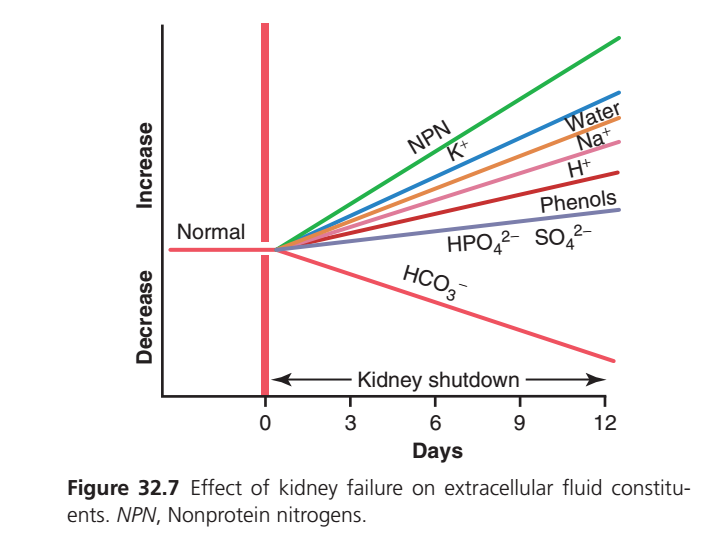
Figure 32.7: Effect of Complete Kidney Failure (Kidney Shutdown) on Extracellular Fluid Constituents
(Guyton Physiology, 15th Edition – Chapter 32)
Complete Easy & Conceptual Explanation of Every Line, Curve, Label, and Axis
This figure explains what happens to different substances in the blood after the kidneys completely stop working (complete renal failure).
The easiest way to understand this graph is to remember one simple rule:
When the kidneys stop working, substances that are normally removed by the kidneys accumulate in the blood, while substances normally regenerated by the kidneys (such as bicarbonate) decrease.
Think of the kidneys as a garbage disposal and balancing system.
Normally
Body produces wastes
        ↓
Kidneys remove wastes
        ↓
Blood stays normal
After kidney shutdown
Body keeps producing wastes
        ↓
Kidneys cannot remove them
        ↓
Wastes accumulate in blood
First Understand the Axes
X-Axis (Horizontal Axis)
Days
This axis shows time after the kidneys stop working completely.
Day 0
│
Kidneys suddenly stop working

↓

Day 3

↓

Day 6

↓

Day 9

↓

Day 12
As you move from left to right, more time passes.
Arrow Below the X-axis
It is labeled
Kidney Shutdown
This means
During this entire period,
the kidneys are not functioning at all.
Imagine
Normal kidney

↓

OFF

↓

No urine formation

↓

No filtration

↓

No waste removal
Y-Axis (Vertical Axis)
The vertical axis has two directions.
Upper Half
Increase
Means
Blood concentration increases.
Lower Half
Decrease
Means
Blood concentration decreases.
Horizontal Black Line
It is labeled
Normal
This is the starting point.
Before kidney failure
Every substance is at its
normal blood concentration.
Think of this line as
Healthy person

↓

Everything is normal
Thick Vertical Red Line at Day 0
This is one of the most important lines.
It represents
Sudden Kidney Failure
At this point
Kidneys stop working

↓

No filtration

↓

No excretion
Everything changes after this moment.
Now Let’s Study Every Colored Line
1. Green Line
NPN (Nonprotein Nitrogen)
Notice
The green line rises the fastest.
It becomes the highest line.
What is NPN?
NPN means
Nonprotein Nitrogen
It includes nitrogen-containing waste products such as:
- Urea
- Creatinine
- Uric acid
- Other nitrogenous wastes
Why Does It Increase So Much?
Normally
Kidneys remove nitrogen wastes every day.
After kidney shutdown
Nitrogen waste produced

↓

Kidneys cannot remove it

↓

It accumulates

↓

Blood level rises continuously
That is why
NPN has the steepest upward slope.
Clinical Meaning
High NPN causes
Uremia
Patients develop
- nausea
- vomiting
- fatigue
- confusion
- coma (in severe cases)
2. Blue Line
Potassium (K⁺)
Notice
Potassium also rises rapidly.
Why?
Every day,
our cells release potassium.
Normally
Kidneys excrete excess potassium.
After kidney failure
Potassium produced

↓

Cannot leave the body

↓

Accumulates

↓

Blood potassium rises
Why Is High Potassium Dangerous?
Because
High potassium affects the heart.
It can cause
- arrhythmias
- cardiac arrest
- sudden death
This is often the most immediately life-threatening electrolyte abnormality in severe kidney failure.
3. Orange Line
Water
Notice
Water gradually increases.
Why?
People continue drinking water.
Normally
Kidneys remove excess water.
After kidney shutdown
Drink water

↓

Cannot excrete water

↓

Water accumulates

↓

Body fluid increases
Result
Patients develop
- edema
- swollen legs
- pulmonary edema
- weight gain
4. Brown Line
Sodium (Na⁺)
Notice
Sodium also increases,
but
less than water.
Why?
People continue eating salt.
Normally
Kidneys remove extra sodium.
Without kidneys
Salt intake

↓

No sodium excretion

↓

Total body sodium increases
Important: The graph represents the amount retained in the body (total body sodium). The serum sodium concentration may not increase proportionally because retained water dilutes sodium. Therefore, CKD patients can have increased total body sodium with a normal or even low serum sodium concentration.esult
Extra sodium causes
Water retention

↓

Edema

↓

High blood pressure
5. Pink Line
Hydrogen Ion (H⁺)
Notice
Hydrogen ions rise gradually.
Why?
Every day
the body produces acids.
Normally
Kidneys remove H⁺.
After kidney shutdown
Acid produced

↓

Cannot be excreted

↓

Hydrogen ions accumulate
Result
The patient develops
Metabolic Acidosis
Symptoms include
- deep breathing
- weakness
- fatigue
- confusion
6. Dark Red Line
Phenols
Phenols are
toxic metabolic waste products.
Normally
Kidneys remove them.
Without kidneys
they accumulate.
These toxins contribute to
uremia.
7. Purple Line
HPO₄²⁻ (Phosphate)
Notice
Phosphate rises,
but
more slowly.
Why?
Normally
Kidneys remove phosphate.
After kidney shutdown
Phosphate intake

↓

No excretion

↓

Blood phosphate rises
High Phosphate Causes
↓

Calcium

↓

Bone disease

↓

Itching

↓

Vascular calcification
8. Sulfate (SO₄²⁻)
Sulfate behaves similarly.
Normally
Kidneys remove sulfate.
After failure
It accumulates.
9. The Only Line That Goes Down
HCO₃⁻ (Bicarbonate)
Notice
This line slopes downward.
It is the only major line that decreases.
Why Does Bicarbonate Decrease?
Normally
The kidneys:
- reabsorb filtered bicarbonate,
- generate new bicarbonate,
- excrete hydrogen ions.
These processes help maintain blood pH.
When the kidneys fail,
they can no longer
- regenerate bicarbonate,
- adequately excrete acid.
Meanwhile,
acids continue to be produced.
These acids consume bicarbonate.
Acids ↑

↓

Bicarbonate used up

↓

HCO₃⁻ decreases
Result
↓

Blood pH

↓

Metabolic acidosis
Why Do Most Lines Keep Rising?
Imagine
A house produces
10 bags of garbage every day.
Normally
Garbage truck removes
10 bags.
House stays clean.
Now
Garbage truck stops coming.
Day 1

10 bags

↓

Day 2

20 bags

↓

Day 3

30 bags

↓

Day 12

Huge pile
Exactly the same happens inside the body.
Why Does Bicarbonate Fall Instead?
Imagine
Bicarbonate is
a sponge.
Every day
acids are spilled.
Normally
The kidney gives you a new sponge.
Now
Kidneys stop working.
The sponge keeps absorbing acid,
but
no new sponge is supplied.
Eventually
the sponge disappears.
That is why bicarbonate falls.
Relationship Between All Lines
Kidneys stop working
        ↓
Waste cannot leave the body
        ↓
Nitrogen waste ↑
Potassium ↑
Water ↑
Sodium retention ↑
Hydrogen ions ↑
Phosphate ↑
Sulfate ↑
Phenols ↑
        ↓
Only bicarbonate ↓
        ↓
Uremia
Hyperkalemia
Fluid overload
Metabolic acidosis
One-Line Explanation of Every Line
| Graph Part | Meaning |
|---|---|
| Green line (NPN) | Nonprotein nitrogen wastes (urea, creatinine, etc.) accumulate rapidly because the kidneys cannot excrete them. |
| Blue line (K⁺) | Potassium rises quickly because renal potassium excretion stops, increasing the risk of dangerous cardiac arrhythmias. |
| Orange line (Water) | Water accumulates because intake continues but excretion stops, causing fluid overload and edema. |
| Brown line (Na⁺) | Total body sodium increases because it cannot be excreted, contributing to edema and hypertension. |
| Pink line (H⁺) | Hydrogen ions accumulate, leading to metabolic acidosis. |
| Dark red line (Phenols) | Toxic waste products accumulate and contribute to uremic symptoms. |
| Purple line (HPO₄²⁻, SO₄²⁻) | Phosphate and sulfate accumulate because renal excretion stops, contributing to CKD complications such as bone disease. |
| Downward pink/red line (HCO₃⁻) | Bicarbonate decreases because it is consumed buffering acids and the kidneys cannot regenerate or conserve it adequately. |
| Horizontal “Normal” line | Represents normal plasma concentrations before kidney failure. |
| Vertical red line (Day 0) | Marks the sudden onset of complete kidney shutdown. |
| Arrow “Kidney shutdown” | Indicates the entire period during which the kidneys remain nonfunctional. |
KEY CONCEPT (Exam Point)
- Complete kidney failure prevents the excretion of metabolic wastes, electrolytes, and excess water.
- Consequently, nonprotein nitrogen (NPN), potassium (K⁺), water, total body sodium, hydrogen ions (H⁺), phosphate (HPO₄²⁻), sulfate (SO₄²⁻), and other uremic toxins (e.g., phenols) progressively accumulate in the body.
- Bicarbonate (HCO₃⁻) is the major exception: its concentration falls because it is consumed buffering retained acids and the failing kidneys cannot regenerate or conserve it effectively.
- These changes explain the major complications of renal failure:
- Uremia (NPN accumulation),
- Hyperkalemia (↑ K⁺),
- Fluid overload and edema (↑ water and total body sodium),
- Metabolic acidosis (↑ H⁺ with ↓ HCO₃⁻),
- Hyperphosphatemia (↑ phosphate).
Hypertension and Kidney Disease
Hypertension and Kidney Disease
- Hypertension worsens injury to the glomeruli and renal blood vessels.
- Hypertension is a major cause of end-stage renal disease (ESRD).
- Kidney disease can also cause hypertension.
- Therefore, hypertension and kidney disease can create a vicious cycle:
- Primary kidney damage increases blood pressure.
- High blood pressure causes more kidney damage.
- More kidney damage further increases blood pressure.
- This cycle continues until ESRD develops.
- Not all kidney diseases cause hypertension.
- Some kidney diseases cause uremia without hypertension.
- Some types of renal damage are especially likely to cause hypertension.
Renal Lesions That Reduce the Ability of the Kidneys to Excrete Sodium and Water Promote Hypertension
- Renal lesions that reduce sodium and water excretion almost always cause hypertension.
- Lesions that:
- Decrease GFR.
- Increase tubular reabsorption.
- Usually lead to hypertension of varying severity.
Types of Renal Abnormalities That Cause Hypertension
1. Increased Renal Vascular Resistance
- Increased renal vascular resistance decreases:
- Renal blood flow.
- GFR.
- Example:
- Hypertension caused by renal artery stenosis.
2. Decreased Glomerular Capillary Filtration Coefficient
- A reduced filtration coefficient decreases GFR.
- Example:
- Chronic glomerulonephritis.
- Chronic glomerulonephritis causes:
- Inflammation of the glomerular capillaries.
- Thickening of the glomerular capillary membranes.
- These changes reduce the glomerular filtration coefficient.
3. Excessive Tubular Sodium Reabsorption
- Excessive sodium reabsorption causes hypertension.
- Example:
- Excessive aldosterone secretion.
- Aldosterone mainly increases sodium reabsorption in the:
- Cortical collecting tubules.
Changes After Hypertension Develops
- Once hypertension develops:
- Renal sodium excretion returns to normal.
- Renal water excretion also returns to normal.
- This occurs because:
- High arterial pressure causes pressure natriuresis.
- High arterial pressure causes pressure diuresis.
- Sodium intake and output become balanced again.
- Even when:
- Renal vascular resistance is greatly increased.
- Glomerular filtration coefficient is greatly decreased.
- GFR may return to nearly normal after arterial pressure rises.
- When tubular reabsorption is increased, such as with excessive aldosterone:
- Urinary sodium excretion decreases initially.
- Later, urinary excretion returns to normal as arterial pressure increases.
- After hypertension develops:
- Hypertension may be the only obvious sign of impaired sodium and water excretion.
- Normal sodium and water excretion at an elevated arterial pressure means:
- Pressure natriuresis and pressure diuresis have been reset to a higher arterial pressure.
Hypertension Caused By Patchy Renal Damage and Increased Renal Secretion of Renin
- If a kidney becomes ischemic:
- It secretes large amounts of renin.
- Increased renin causes:
- Increased formation of angiotensin II (Ang II).
- Increased Ang II can produce hypertension.
Sequence of Events
- (1) The ischemic kidney excretes less water and salt than normal.
- (2) Renin released from the ischemic kidney increases Ang II formation.
- (3) Ang II acts on the nonischemic kidney.
- (4) The nonischemic kidney also retains salt and water.
- (5) Excess salt and water produce hypertension.
Patchy Renal Ischemia
- Hypertension can also occur when:
- Patchy areas of one or both kidneys become ischemic.
- Causes include:
- Arteriosclerosis.
- Vascular injury.
- Ischemic nephrons:
- Excrete less salt and water.
- Secrete more renin.
- Increased renin causes increased Ang II formation.
- High Ang II levels reduce the ability of surrounding normal nephrons to excrete sodium and water.
- Hypertension develops.
- High blood pressure restores overall sodium and water excretion.
- Salt and water intake again become balanced.
- This balance occurs at the expense of elevated blood pressure.
Kidney Diseases That Cause Loss of Entire Nephrons Lead to CKD but May Not Cause Hypertension
- Loss of large numbers of entire nephrons usually causes CKD.
- Example:
- Loss of one kidney and part of the other kidney.
- If enough kidney tissue is lost:
- CKD develops.
- If the remaining nephrons are normal:
- And salt intake is not excessive.
- Clinically significant hypertension may not develop.
- This occurs because:
- Even a small increase in blood pressure.
- Combined with decreased formation of Ang II and aldosterone.
- Increases sodium and water excretion by the remaining nephrons.
- This maintains sodium and water balance.
- Patients with this type of CKD may become hypertensive if:
- Salt intake becomes excessive.
- In this situation:
- The remaining nephrons cannot excrete enough sodium at a normal blood pressure.
- Increased blood pressure restores sodium and water excretion.
- Under steady-state conditions:
- Salt intake again matches salt excretion.
Treatment of Hypertension
- Effective treatment improves the kidneys’ ability to excrete sodium and water.
- This can be achieved by:
- Increasing GFR.
- Decreasing tubular reabsorption.
- These changes allow sodium and water balance to occur at a lower blood pressure.
Methods of Treatment
- Drugs that block nervous and hormonal signals causing salt and water retention:
- β-adrenergic blockers.
- Ang II receptor antagonists.
- ACE inhibitors.
- Mineralocorticoid receptor antagonists.
- Drugs that dilate the renal blood vessels and increase GFR:
- Calcium channel blockers.
- Diuretic drugs:
- Directly inhibit renal tubular reabsorption of sodium and water.
KEY CONCEPT
- Hypertension damages the kidneys, and kidney disease can also cause hypertension, creating a vicious cycle that may progress to ESRD.
- Renal lesions that decrease GFR or increase tubular sodium reabsorption usually cause hypertension.
- Major causes include increased renal vascular resistance, decreased glomerular filtration coefficient, and excessive aldosterone-induced sodium reabsorption.
- After hypertension develops, pressure natriuresis and pressure diuresis restore sodium and water balance at a higher arterial pressure.
- Ischemic kidneys release excess renin, increasing Ang II, which promotes sodium retention and hypertension.
- Loss of entire nephrons causes CKD, but hypertension may not occur unless sodium excretion becomes inadequate, especially with high salt intake.
- Hypertension is treated by increasing renal sodium and water excretion through increasing GFR, decreasing tubular reabsorption, or using antihypertensive and diuretic drugs.
Specific Tubular Disorders
Specific Tubular Disorders
- Different substances are transported across the renal tubular epithelial membrane by specific transport mechanisms.
- Each cellular enzyme and each carrier protein is produced according to a specific gene in the nucleus.
- If a gene is defective (for example, due to a mutation):
- The tubules may lack the required carrier protein.
- Or they may lack the enzyme needed for tubular transport.
- In some disorders:
- Too much of an enzyme or carrier protein may be produced.
- Many hereditary tubular disorders occur because of abnormal transport of one or more substances across the tubular membrane.
- Renal tubular disorders may also be acquired because of:
- Toxins.
- Inflammation.
- Ischemia.
- These factors damage the renal tubular epithelial membrane.
Nondiabetic Renal Glycosuria—Failure of the Kidneys to Reabsorb Glucose
- In nondiabetic renal glycosuria:
- Blood glucose concentration is usually normal.
- The tubular transport mechanism for glucose reabsorption is greatly reduced or absent.
- As a result:
- Large amounts of glucose are excreted in the urine despite a normal blood glucose level.
- Because diabetes mellitus also causes glucose in the urine:
- Nondiabetic renal glycosuria must be excluded before diagnosing diabetes mellitus.
- Nondiabetic renal glycosuria may be hereditary.
- It may result from mutations in the sodium-glucose transporter 2 (SGLT2).
- Glycosuria may also be acquired because of:
- Disorders causing generalized proximal tubule dysfunction (e.g., Fanconi syndrome or tubulointerstitial nephritis).
- Medications that reduce proximal tubular glucose reabsorption (e.g., SGLT2 inhibitors).
- Glycosuria causes:
- Increased urine volume due to osmotic diuresis.
- Compensatory increase in thirst.
- Increased susceptibility to genital infections.
- Increased susceptibility to urinary tract infections.
Aminoaciduria—Failure of the Kidneys to Reabsorb Amino Acids
- Some amino acids share the same transport systems for reabsorption.
- Other amino acids have separate transport systems.
- Rarely:
- Generalized aminoaciduria occurs because all amino acids are poorly reabsorbed.
- More commonly:
- Defects involve specific carrier systems.
- These include:
- (1) Essential cystinuria:
- Large amounts of cystine are not reabsorbed.
- Cystine crystallizes in urine.
- Renal stones may form.
- (2) Simple glycinuria:
- Glycine is not reabsorbed.
- (3) Beta-aminoisobutyricaciduria:
- Occurs in about 5% of the population.
- Usually has no major clinical significance.
- (1) Essential cystinuria:
Renal Hypophosphatemia—Failure of the Kidneys to Reabsorb Phosphate
- In renal hypophosphatemia:
- The renal tubules fail to reabsorb enough phosphate.
- This occurs even when body phosphate levels are very low.
- Several rare syndromes cause primary renal phosphate wasting.
- Mutations of the sodium-phosphate co-transporter gene:
- Increase phosphate excretion.
- Cause hypophosphatemia.
- Gain-of-function mutations in genes encoding fibroblast growth factor-23 (FGF-23):
- Suppress phosphate reabsorption by the kidneys.
- Cause hypophosphatemia.
- Renal hypophosphatemia usually does not produce serious immediate abnormalities.
- This is because extracellular phosphate concentration can vary widely without causing major cellular dysfunction.
- Over a long period:
- Low phosphate causes decreased bone calcification.
- Rickets develops.
- This form of rickets:
- Does not respond to vitamin D therapy.
- This differs from the usual form of rickets, which responds rapidly to vitamin D.
Renal Tubular Acidosis—Reduced Tubular Secretion of Hydrogen Ions
- In renal tubular acidosis:
- The renal tubules cannot secrete enough hydrogen ions.
- As a result:
- Large amounts of sodium bicarbonate are continuously lost in the urine.
- This causes:
- Persistent metabolic acidosis.
- Renal tubular acidosis may result from:
- Hereditary disorders.
- Widespread injury to the renal tubules.
Nephrogenic Diabetes Insipidus—Failure of the Kidneys to Respond to Antidiuretic Hormone
- In nephrogenic diabetes insipidus:
- The renal tubules do not respond to antidiuretic hormone (ADH).
- As a result:
- Large amounts of dilute urine are excreted.
- If enough water is available:
- Serious problems usually do not occur.
- If adequate water is not available:
- Rapid dehydration develops.
Fanconi Syndrome—Generalized Reabsorptive Defect of the Renal Tubules
- Fanconi syndrome is usually associated with increased urinary excretion of:
- Almost all amino acids.
- Glucose.
- Phosphate.
- In severe cases:
- (1) Sodium bicarbonate is not reabsorbed.
- This causes metabolic acidosis.
- (2) Potassium excretion increases.
- Calcium excretion may also increase.
- (3) Nephrogenic diabetes insipidus may develop.
- (1) Sodium bicarbonate is not reabsorbed.
- Fanconi syndrome results from a generalized inability of renal tubular cells to transport many substances.
- Causes include:
- (1) Hereditary defects in cell transport mechanisms.
- (2) Toxins or drugs that damage renal tubular epithelial cells.
- (3) Ischemic injury or inflammatory disorders affecting renal tubular cells.
- The proximal tubular cells are especially affected in Fanconi syndrome caused by tubular injury.
- This is because proximal tubular cells:
- Reabsorb many drugs and toxins.
- Secrete many drugs and toxins.
- Therefore, these cells are more susceptible to damage.
KEY CONCEPT
- Specific tubular disorders occur because of hereditary gene mutations or acquired injury to renal tubular epithelial cells.
- Nondiabetic renal glycosuria causes glucose loss in urine despite normal blood glucose due to defective glucose reabsorption.
- Aminoaciduria results from defective amino acid transport and may cause cystine stones in cystinuria.
- Renal hypophosphatemia causes excessive phosphate loss and can lead to vitamin D–resistant rickets.
- Renal tubular acidosis results from impaired hydrogen ion secretion and persistent metabolic acidosis.
- Nephrogenic diabetes insipidus occurs because the kidneys fail to respond to ADH, producing large volumes of dilute urine.
- Fanconi syndrome is a generalized proximal tubular reabsorptive defect causing urinary loss of amino acids, glucose, phosphate, bicarbonate, potassium, and sometimes calcium, with metabolic acidosis and nephrogenic diabetes insipidus in severe cases.
Bartter Syndrome—Decreased Sodium, Chloride, and Potassium Reabsorption in the Loops of Henle
Bartter Syndrome—Decreased Sodium, Chloride, and Potassium Reabsorption in the Loops of Henle
- Bartter syndrome is a rare group of kidney disorders.
- It is caused by mutations that:
- Impair the 1-sodium, 2-chloride, 1-potassium (Na⁺-K⁺-2Cl⁻) co-transporter.
- Or affect potassium channels in the luminal membrane.
- Or affect chloride channels in the basolateral membrane of the thick ascending loop of Henle.
- At least five mutations have been identified.
- These mutations are usually inherited in an autosomal-recessive manner.
- These disorders cause increased urinary excretion of:
- Water.
- Sodium.
- Chloride.
- Potassium.
- Calcium.
- Loss of salt and water causes:
- Mild volume depletion.
- Activation of the renin-angiotensin-aldosterone system (RAAS).
- Increased aldosterone and increased distal tubular flow:
- Stimulate potassium secretion.
- Stimulate hydrogen ion secretion in the collecting tubules.
- This leads to:
- Hypokalemia.
- Metabolic alkalosis.
Gitelman Syndrome—Decreased Sodium Chloride Reabsorption in the Distal Tubules
- Gitelman syndrome is an autosomal-recessive disorder.
- It affects the thiazide-sensitive sodium-chloride co-transporter in the distal tubules.
- Patients with Gitelman syndrome have features similar to Bartter syndrome:
- Salt loss.
- Water loss.
- Mild volume depletion.
- Activation of the RAAS.
- These abnormalities are usually less severe than in Bartter syndrome.
- Because the tubular defects cannot currently be corrected:
- Treatment focuses on replacing:
- Sodium chloride.
- Potassium.
- Treatment focuses on replacing:
- Some studies suggest that:
- Nonsteroidal anti-inflammatory drugs (NSAIDs) that block prostaglandin synthesis may help.
- Aldosterone antagonists, such as spironolactone, may help correct hypokalemia.
Liddle Syndrome—Increased Sodium Reabsorption
- Liddle syndrome is a rare autosomal-dominant disorder.
- It is caused by mutations in the amiloride-sensitive epithelial sodium channel (ENaC).
- ENaC is located in the:
- Distal tubules.
- Collecting tubules.
- These mutations cause excessive ENaC activity.
- As a result:
- Sodium reabsorption increases.
- Water reabsorption increases.
- This causes:
- Hypertension.
- Metabolic alkalosis.
- These changes resemble those seen in primary aldosteronism.
- However, patients with Liddle syndrome have:
- Decreased renin secretion.
- Decreased angiotensin II (Ang II) levels.
- Decreased aldosterone secretion.
- Liddle syndrome can be treated with:
- Amiloride.
- Amiloride blocks the excessive activity of ENaC.
Treatment of Renal Failure By Transplantation or Dialysis With an Artificial Kidney
- Severe acute or chronic loss of kidney function is life-threatening.
- Treatment requires:
- Removal of toxic waste products.
- Restoration of body fluid volume.
- Restoration of body fluid composition toward normal.
- This can be achieved by:
- Kidney transplantation.
- Dialysis with an artificial kidney.
- More than 800,000 patients in the United States receive some form of ESRD therapy.
Kidney Transplantation
- Successful transplantation of one donor kidney can:
- Restore kidney function sufficiently.
- Maintain nearly normal body fluid and electrolyte homeostasis.
- About 25,000 kidney transplantations are performed each year in the United States.
- This number represents only a small percentage of patients waiting for donor kidneys.
- Patients receiving kidney transplants usually:
- Live longer.
- Have fewer health problems than patients maintained on dialysis.
- Most transplant recipients require:
- Continuous immunosuppressive therapy.
- Immunosuppressive drugs help:
- Prevent acute rejection.
- Prevent loss of the transplanted kidney.
- Side effects of immunosuppressive drugs include:
- Increased risk of infections.
- Increased risk of some cancers.
- Over time:
- The amount of immunosuppressive therapy can usually be reduced.
- This greatly lowers these risks.
Dialysis With an Artificial Kidney
- Most patients with chronic kidney failure are treated with dialysis.
- This is mainly because donor kidneys are limited.
- Dialysis is also used in certain types of acute kidney injury (AKI).
- Dialysis supports the patient until kidney function recovers.
- If kidney damage is irreversible:
- Dialysis must be continued throughout life.
- Dialysis cannot:
- Completely maintain normal body fluid composition.
- Replace all kidney functions.
- Therefore:
- Patients receiving dialysis usually continue to have significant health impairment.
Basic Principles of Dialysis
- Blood passes through very small blood channels.
- These channels are separated from dialyzing fluid by a thin membrane.
- Waste products move:
- From blood to dialyzing fluid.
- By diffusion.
- (Figure 32.8)
- In one type of artificial kidney:
- Blood flows continuously between two thin cellophane membranes.
- Dialyzing fluid is present outside the membrane.
- The cellophane membrane is porous.
- Plasma constituents can diffuse through the membrane except:
- Plasma proteins.
- Diffusion occurs:
- From plasma to dialyzing fluid.
- Or from dialyzing fluid to plasma.
- If the plasma concentration of a substance is higher than that in the dialyzing fluid:
- The substance diffuses into the dialyzing fluid.
Factors Affecting Solute Movement Across the Dialysis Membrane
- The rate of solute movement depends on:
- (1) Concentration gradient between blood and dialyzing fluid.
- (2) Membrane permeability.
- (3) Membrane surface area.
- (4) Duration of contact between blood and the membrane.
- Solute transfer is greatest:
- At the beginning of dialysis.
- When the concentration gradient is highest.
- Solute transfer slows:
- As the concentration gradient decreases.
- During hemodialysis:
- Increasing blood flow.
- Increasing dialysate flow.
- Or increasing both.
- Helps maintain the concentration gradient.
- This improves diffusion across the membrane.
Operation of the Artificial Kidney
- Blood flows continuously or intermittently back into the vein.
- The amount of blood inside the artificial kidney at one time is usually:
- Less than 500 mL.
- Blood flow rate may be:
- Several hundred milliliters per minute.
- Total diffusion surface area is:
- 0.6–2.5 m².
- A small amount of heparin is infused into the blood.
- Heparin prevents blood coagulation inside the artificial kidney.
- Besides diffusion:
- Solutes and water can also move by filtration.
- Filtration occurs when hydrostatic pressure forces fluid and solutes across the membrane.
- This process is called:
- Bulk flow.
- Hemofiltration.
Dialyzing Fluid
- Table 32.7 compares the composition of:
- Normal plasma.
- Uremic plasma.
- Typical dialyzing fluid.
- The concentrations of substances in dialyzing fluid are:
- Not the same as normal plasma.
- Not the same as uremic plasma.
- They are adjusted to:
- Produce the desired movement of water and solutes during dialysis.
- Dialyzing fluid contains no:
- Phosphate.
- Urea.
- Urate.
- Sulfate.
- Creatinine.
- These substances are present in high concentrations in uremic blood.
- During dialysis:
- These substances diffuse from blood into the dialyzing fluid.
Effectiveness of the Artificial Kidney
- Effectiveness is measured by:
- The amount of plasma cleared of a substance each minute.
- Most artificial kidneys clear urea at:
- 100–225 mL/min.
- Two normal kidneys clear urea at:
- 70 mL/min.
- Artificial kidneys are usually used for:
- 4–6 hours per day.
- Three times each week.
- Therefore:
- Overall plasma clearance remains limited.
- Artificial kidneys cannot replace all kidney functions.
- For example:
- They cannot secrete erythropoietin.
- Erythropoietin is necessary for:
- Red blood cell production.
KEY CONCEPT
- Bartter syndrome is caused by defects in the Na⁺-K⁺-2Cl⁻ transporter or associated ion channels in the thick ascending loop of Henle, leading to salt wasting, hypokalemia, metabolic alkalosis, and RAAS activation.
- Gitelman syndrome is caused by a defect in the thiazide-sensitive Na⁺-Cl⁻ co-transporter of the distal tubule and produces a milder form of salt wasting with RAAS activation.
- Liddle syndrome is caused by excessive ENaC activity, resulting in increased sodium reabsorption, hypertension, metabolic alkalosis, low renin, low Ang II, and low aldosterone; it is treated with amiloride.
- Severe renal failure is treated by kidney transplantation or dialysis.
- Kidney transplantation restores near-normal kidney function but requires lifelong immunosuppressive therapy.
- Dialysis removes waste products by diffusion across a semipermeable membrane (Figure 32.8).
- Solute movement during dialysis depends on the concentration gradient, membrane permeability, membrane surface area, and contact time.
- Artificial kidneys clear urea at 100–225 mL/min but cannot replace endocrine kidney functions such as erythropoietin secretion.
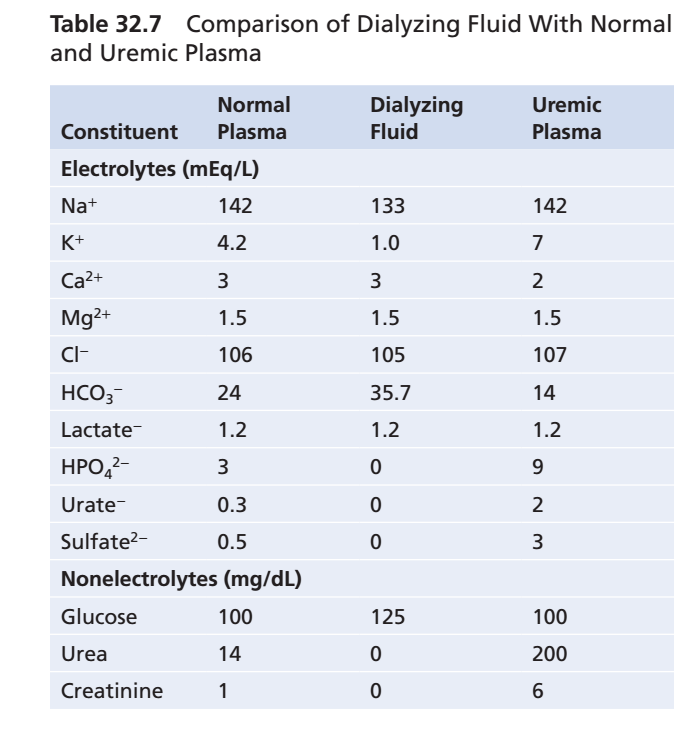
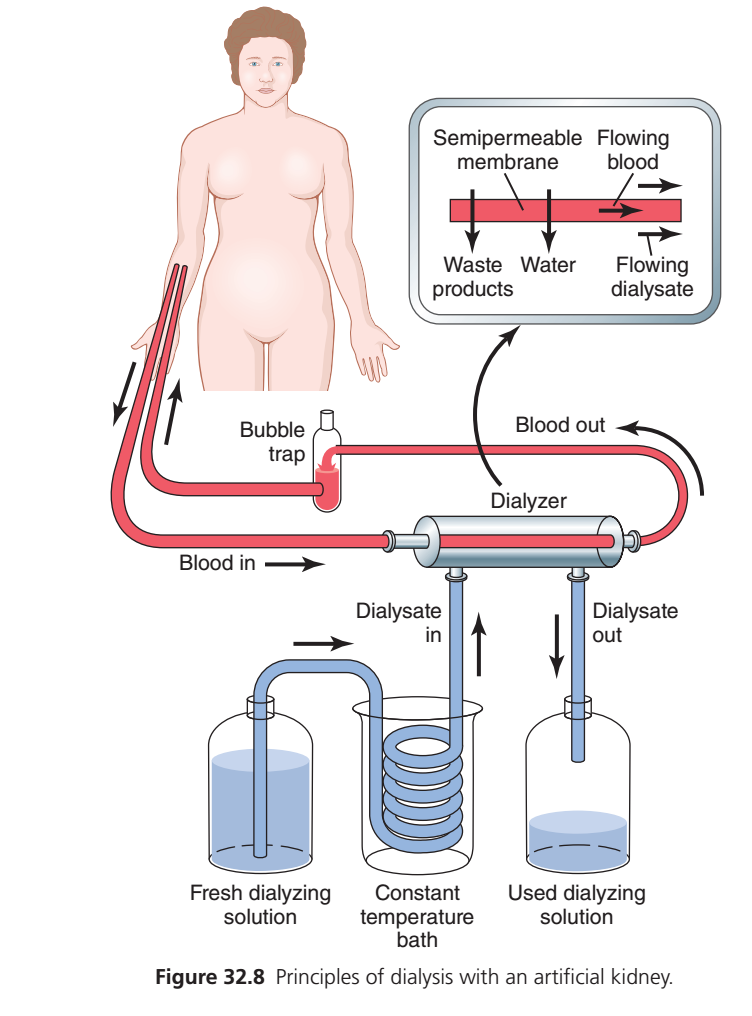
Figure 32.8: Principles of Hemodialysis (Artificial Kidney)
(Guyton Physiology, 15th Edition – Chapter 32)
Complete Easy & Conceptual Explanation of Every Label, Tube, Arrow, Container, and Membrane
This figure explains how an artificial kidney (hemodialysis machine) cleans the blood when the kidneys fail.
This is one of the most important diagrams in renal physiology.
The easiest way to understand dialysis is to remember one sentence:
Hemodialysis works like an artificial kidney. It removes waste products and excess water from the blood through a semipermeable membrane while keeping useful substances (like blood cells and proteins) inside the blood.
Think of dialysis as a water purifier.
Dirty water enters
↓
Filter removes dirt
↓
Clean water comes out
Exactly the same happens here.
Dirty Blood
      ↓
Artificial Kidney (Dialyzer)
      ↓
Clean Blood
First Look at the Whole Diagram
The picture has three major parts.
Patient
      ↓
Blood tubing
      ↓
Dialyzer (Artificial Kidney)
      ↓
Clean blood returns to patient
At the same time
Fresh Dialysate
       ↓
Dialyzer
       ↓
Waste-filled Dialysate
So there are two different fluids flowing:
1. Blood
Flows inside the dialyzer.
2. Dialysate
Flows outside the blood compartment.
These two fluids never mix directly.
They are separated by a semipermeable membrane.
PART 1: The Patient
The picture starts with a patient.
The kidneys are no longer working properly.
Normally kidneys remove
- Urea
- Creatinine
- Potassium
- Excess water
- Toxins
Since the kidneys have failed,
the dialysis machine performs these functions.
Blood Access (The Tubes Connected to the Arm)
Notice the red tube coming from the patient’s arm.
This tube carries
Blood Out of the Body
The arrow shows
Patient

↓

Blood leaves body

↓

Dialysis machine
This blood is
dirty blood
because it containsBlood In
The tube labeled
Blood In
means
Blood enters the dialyzer.
This is still
unclean blood.ialyzer
This is the heart of the machine.
The dialyzer is called the
Artificial Kidney
Inside it are
thousands of tiny hollow fibers.
Each fiber acts like
a nephron filter.
Think of it like
Thousands of tiny drinking straws

↓

Blood flows inside

↓

Dialysate flows outside
These tiny fibers provide a very large surface area for exchange.
Blood Out
After passing through the dialyzer,
the blood has been cleaned.
Now
the blood leaves the dialyzer.
The arrow shows
Dialyzer

↓

Clean blood

↓

Patient
Bubble Trap
Notice the small chamber labeled
Bubble Trap
This is a very important safety device.
Why?
Sometimes tiny air bubbles enter the blood tubing.
If these bubbles entered the bloodstream,
they could cause an
air embolism, which can be life-threatening.
The bubble trap removes air before the blood returns to the patient.
Think of it like
Blood

↓

Air bubble removed

↓

Safe blood returns
PART 2: Fresh Dialyzing Solution
Look at the left bottle.
It contains
Fresh Dialyzing Solution (Dialysate)
This is a specially prepared liquid.
It contains
- Water
- Sodium
- Chloride
- Bicarbonate
- Glucose (in some formulations)
Importantly,
it contains little or no urea, creatinine, or excess potassium.
Why?
Because diffusion moves substances
from
higher concentration
↓
to
lower concentration.
Imagine
Blood
Urea = HighDialysate
Urea = ZeroResult
Urea

Blood

↓

Dialysate
This is exactly how waste is removed.
Dialysate In
The fresh dialysate enters the dialyzer.
Notice the arrow.
Fresh solution

↓

Dialyzer
Constant Temperature Bath
Notice the coil immersed in water.
This is called the
Constant Temperature Bath
Why is it needed?
Blood normally remains around
37°C (98.6°F).
If the dialysate were too cold,
the patient’s blood would cool.
If it were too hot,
blood cells could be damaged.
Therefore
the dialysate is warmed to body temperature before entering the dialyzer.
Think of it as
Cold solution

↓

Heated

↓

Body temperature

↓

Dialyzer
Dialysate Out
After collecting wastes,
the dialysate leaves.
Now it contains
- Urea
- Creatinine
- Potassium
- Excess water
- Other toxins
This is
used dialysate.Used Dialyzing Solution Bottle
This bottle collects
the dirty dialysate.
Think of it as
the garbage container.
Fresh solution

↓

Collects waste

↓

Dirty solution discarded
PART 3: The Enlarged Box (Top Right)
This is the most important part of the figure.
It explains
how dialysis actually works.
Semipermeable Membrane
This thin membrane separates
Blood
from
Dialysate.
The membrane has tiny pores.
These pores allow
- Water
- Small waste molecules
- Electrolytes (to a controlled extent)
to pass through.
But they do not allow
- Red blood cells
- White blood cells
- Platelets
- Most plasma proteins
to cross.
So the membrane is selectively permeable.
Flowing Blood
Notice the blood moves in one direction.
It carries
- Urea
- Creatinine
- Potassium
- Water
toward the membrane.
Flowing Dialysate
Notice
The dialysate flows in the opposite direction.
This is called
Countercurrent Flow
Why use opposite directions?
Because it keeps a concentration difference along the entire length of the membrane.
That means
diffusion continues efficiently from beginning to end.
Imagine
Blood →
← Dialysate
Instead of
Blood →
Dialysate →
Countercurrent flow makes waste removal much more effective.
Waste Products Arrow
The downward arrow labeled
Waste Products
shows
Blood

↓

Membrane

↓

Dialysate
Waste products diffuse into the dialysate because their concentration is higher in blood.
Examples include
- Urea
- Creatinine
- Uric acid
Water Arrow
Another arrow shows
Water moving
from
blood
↓
dialysate.
This removes
extra body fluid.
Water removal is achieved by creating a pressure difference (ultrafiltration) across the membrane in the dialysis machine, so water is pulled from the blood into the dialysate.
This helps treat
- Edema
- High blood pressure
- Pulmonary edema
Why Don’t Blood Cells Leave?
Because
Blood cells are much larger than the membrane pores.
Imagine
A sieve.
Sand

↓

Passes through
Stone
Too large

↓

Cannot pass
Similarly
Red blood cells
↓
Remain inside blood.
Why Don’t Plasma Proteins Leave?
Proteins are also too large.
Therefore
Important proteins like albumin remain in the bloodstream.
Complete Flow of Blood
Patient

↓

Dirty blood leaves body

↓

Blood enters dialyzer

↓

Waste diffuses into dialysate

↓

Excess water removed

↓

Clean blood leaves dialyzer

↓

Bubble trap removes air

↓

Clean blood returns to patient
Complete Flow of Dialysate
Fresh dialysate

↓

Heated to body temperature

↓

Enters dialyzer

↓

Collects wastes

↓

Becomes dirty dialysate

↓

Leaves dialyzer

↓

Discarded
Why Is Dialysis Life-Saving?
Without functioning kidneys,
the following accumulate:
- Urea
- Creatinine
- Potassium
- Hydrogen ions
- Water
These cause
- Uremia
- Hyperkalemia
- Metabolic acidosis
- Fluid overload
Dialysis removes many of these abnormalities and helps restore a safer internal environment until kidney function recovers or a kidney transplant is performed.
One-Line Explanation of Every Label
| Label | Meaning |
|---|---|
| Patient | Person whose kidneys are not functioning adequately. |
| Blood In | Unfiltered blood carrying wastes enters the dialyzer. |
| Dialyzer | Artificial kidney where blood is cleaned. |
| Blood Out | Cleaned blood returns to the patient. |
| Bubble Trap | Removes air bubbles before blood re-enters the body, preventing air embolism. |
| Fresh Dialyzing Solution | Clean dialysate containing appropriate electrolytes but little or no urea, creatinine, or excess potassium. |
| Dialysate In | Fresh dialysate enters the dialyzer. |
| Constant Temperature Bath | Warms the dialysate to approximately body temperature. |
| Dialysate Out | Waste-filled dialysate leaves the dialyzer. |
| Used Dialyzing Solution | Collects dialysate containing removed waste products and excess water. |
| Semipermeable Membrane | Selectively permeable barrier that allows small solutes and water to cross but retains blood cells and plasma proteins. |
| Flowing Blood | Blood travels through the hollow fibers inside the dialyzer. |
| Flowing Dialysate | Dialysate flows in the opposite direction (countercurrent flow) to maximize diffusion. |
| Waste Products Arrow | Shows diffusion of urea, creatinine, and other small waste molecules from blood into dialysate. |
| Water Arrow | Shows removal of excess water from the blood by ultrafiltration. |
KEY CONCEPT (Exam Point)
- Hemodialysis uses an artificial kidney (dialyzer) to replace part of the filtering function of failed kidneys.
- Blood flows inside hollow fibers, while dialysate flows outside them in the opposite direction (countercurrent flow), separated by a semipermeable membrane.
- Small waste products (urea, creatinine, uric acid) diffuse from blood into the dialysate because of concentration gradients.
- Excess water is removed by ultrafiltration, created by a pressure difference across the membrane.
- Blood cells and plasma proteins remain in the blood because they are too large to cross the semipermeable membrane.
- The bubble trap prevents air from entering the bloodstream, and the temperature bath keeps the dialysate close to body temperature.
- Hemodialysis helps correct uremia, hyperkalemia, metabolic acidosis, and fluid overload, but it does not replace all endocrine functions of the kidney (such as erythropoietin or active vitamin D production).
