


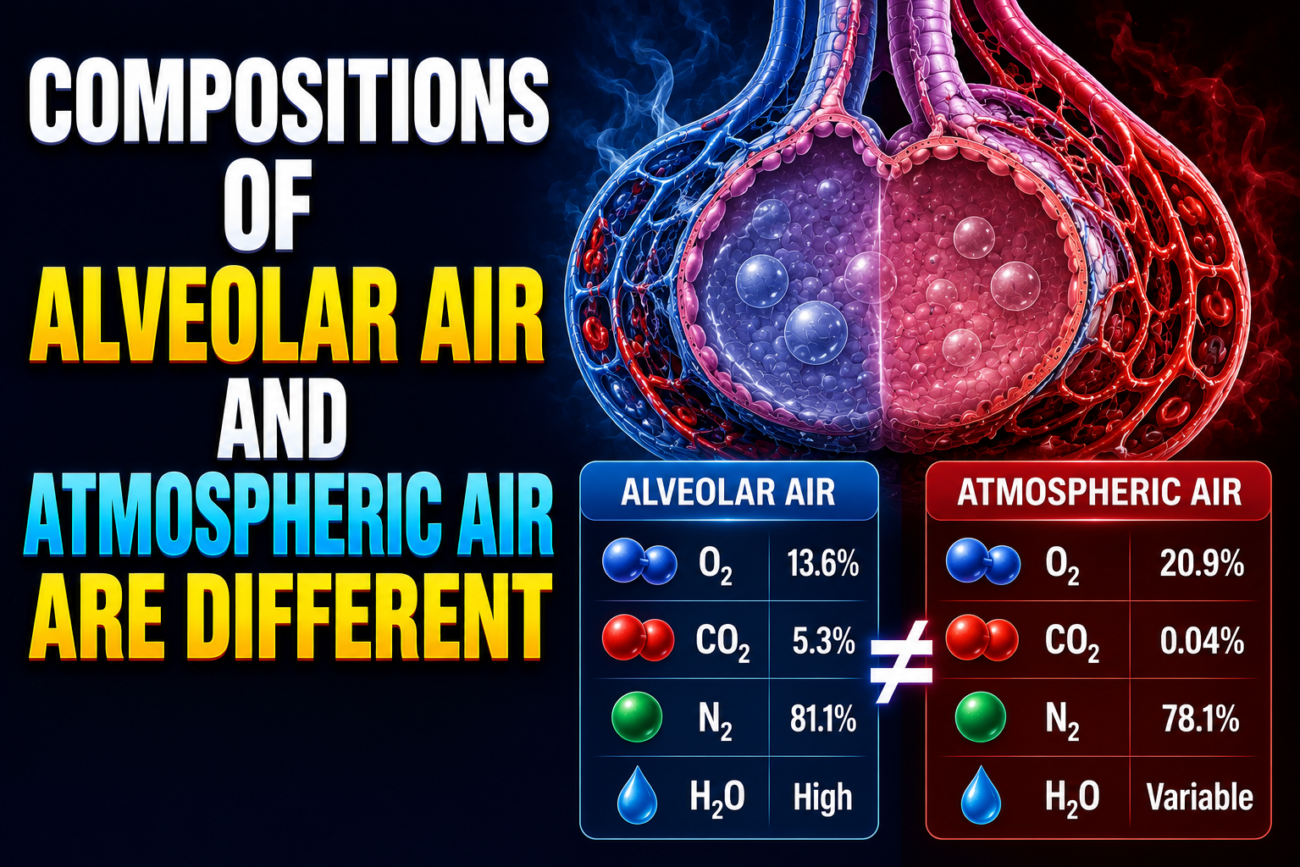
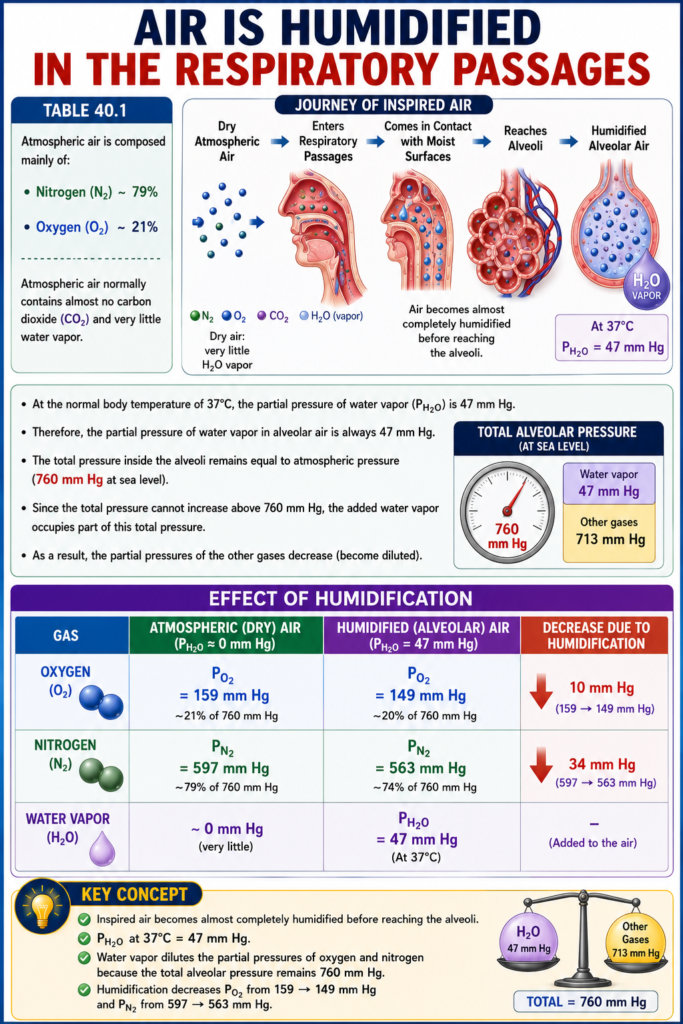
📖 Table Mentioned: Table 40.1
- Alveolar air does not have the same gas composition as atmospheric air.
- This difference occurs because of several reasons:
- First: With each breath, only part of the alveolar air is replaced by fresh atmospheric air.
- Second: Oxygen (O₂) is continuously absorbed from the alveoli into the pulmonary blood.
- Third: Carbon dioxide (CO₂) is continuously diffusing from the pulmonary blood into the alveoli.
- Fourth: The dry atmospheric air becomes humidified as it passes through the respiratory tract before reaching the alveoli.
KEY CONCEPT
- Alveolar air is different from atmospheric air.
- The four main reasons are:
- Only partial replacement of alveolar air with each breath.
- Continuous absorption of O₂ into the blood.
- Continuous diffusion of CO₂ from blood into the alveoli.
- Humidification of inspired air before it reaches the alveoli.
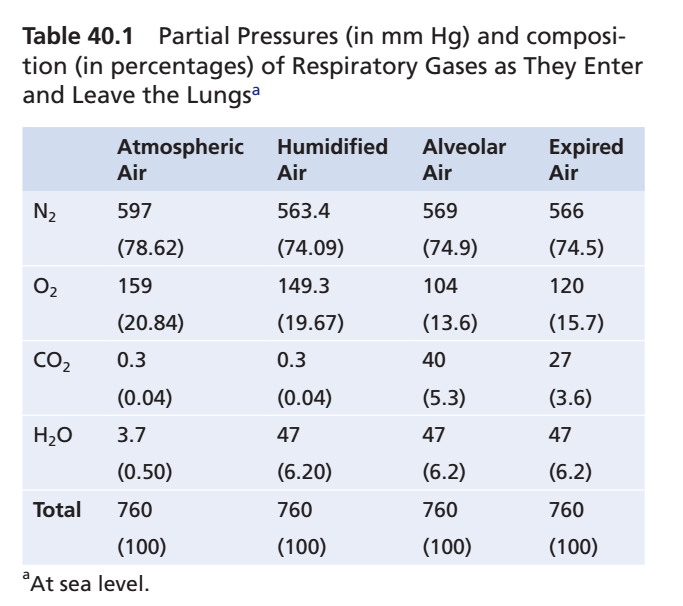
Air Is Humidified in the Respiratory Passages
📖 Table Mentioned: Table 40.1
- Atmospheric air is composed mainly of nitrogen (N₂) and oxygen (O₂).
- Atmospheric air normally contains almost no carbon dioxide (CO₂) and very little water vapor.
- As soon as atmospheric air enters the respiratory passages, it comes in contact with the moist fluid covering the respiratory surfaces.
- Before reaching the alveoli, the inspired air becomes almost completely humidified.
- At the normal body temperature of 37°C, the partial pressure of water vapor (PH₂O) is 47 mm Hg.
- Therefore, the partial pressure of water vapor in alveolar air is always 47 mm Hg.
- The total pressure inside the alveoli remains equal to atmospheric pressure (760 mm Hg at sea level).
- Since the total pressure cannot increase above 760 mm Hg, the added water vapor occupies part of this total pressure.
- As a result, the partial pressures of the other gases decrease (become diluted).
Effect of Humidification
- Oxygen (O₂) partial pressure:
- Atmospheric air = 159 mm Hg
- Humidified air = 149 mm Hg
- Nitrogen (N₂) partial pressure:
- Atmospheric air = 597 mm Hg
- Humidified air = 563 mm Hg
KEY CONCEPT
- Inspired air becomes almost completely humidified before reaching the alveoli.
- PH₂O at 37°C = 47 mm Hg.
- Water vapor dilutes the partial pressures of oxygen and nitrogen because the total alveolar pressure remains 760 mm Hg.
- Humidification decreases O₂ from 159 → 149 mm Hg and N₂ from 597 → 563 mm Hg.
Alveolar Air Is Slowly Renewed By Atmospheric Air
📖 Figures Mentioned: Figure 40.2 and Figure 40.3
📖 Table Mentioned: Table 40.1
- The functional residual capacity (FRC) is the volume of air remaining in the lungs after a normal expiration.
- In an average adult man, the FRC is about 2300 mL.
- During a normal inspiration, only 350 mL of fresh atmospheric air reaches the alveoli.
- During normal expiration, the same 350 mL of old alveolar air leaves the lungs.
- Therefore, only about one-seventh (350 mL out of 2300 mL) of the alveolar air is replaced with each normal breath.
- Because only a small portion is replaced each time, many breaths are needed to replace most of the alveolar air.
- Figure 40.2 shows that alveolar air is renewed slowly.
- Even after 16 breaths, some of the original gas still remains inside the alveoli.
- Figure 40.3 shows how quickly excess gas is removed from the alveoli at different ventilation rates.
- With normal alveolar ventilation, about 50% of the excess gas is removed in 17 seconds.
- If alveolar ventilation is half of normal, 50% of the excess gas is removed in 34 seconds.
- If alveolar ventilation is twice normal, 50% of the excess gas is removed in about 8 seconds.
KEY CONCEPT
- FRC = 2300 mL in an average adult man.
- Only 350 mL of fresh air enters the alveoli with each normal breath.
- Only 1/7 of alveolar air is replaced per breath, so alveolar air is renewed slowly.
- Higher alveolar ventilation removes gases faster, while lower ventilation removes gases more slowly.
- Half of the excess gas is removed in:
- 17 seconds → Normal ventilation
- 34 seconds → Half-normal ventilation
- 8 seconds → Double-normal ventilation
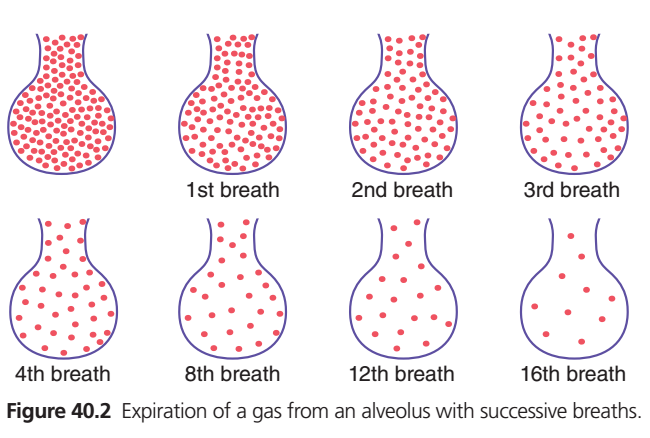
Figure 40.2 – Expiration of a Gas From an Alveolus With Successive Breaths
Super Easy Concept
What does this figure show?
This figure explains why alveolar air is replaced slowly, not all at once.
Each red dot = gas molecule (air inside the alveolus).
Step-by-Step Understanding
Before Breathing
- The alveolus is completely filled with gas molecules.
🫁 Think of it as a balloon full of air.
After 1st Breath
- Only some old gas leaves.
- Fresh air enters and mixes with the remaining old air.
➡️ Most old gas is still present.
After 2nd Breath
- More old gas leaves.
- More fresh air enters.
➡️ But a lot of old gas still remains.
After 3rd & 4th Breaths
- Old gas continues to decrease gradually.
- Fresh air continues to replace it.
➡️ Replacement is slow and gradual.
After 8th Breath
- Only a small amount of the original gas remains.
After 12th Breath
- Very little of the original gas is left.
After 16th Breath
- Almost all of the original gas has been replaced.
✅ The alveolus now contains mostly fresh air, but this happened gradually over many breaths.
Why Doesn’t All the Air Leave in One Breath?
Because after a normal expiration:
- About 2300 mL of air remains in the lungs (Functional Residual Capacity, FRC).
- During each normal breath, only about 350 mL of fresh air reaches the alveoli.
So,
350 mL is much smaller than 2300 mL.
➡️ Therefore, each breath replaces only a small portion of alveolar air.
Simple Analogy
Imagine a bucket containing blue-colored water.
Instead of emptying the bucket completely:
- Remove only one cup of blue water.
- Add one cup of clear water.
- Mix it.
Repeat this many times.
The water becomes clearer gradually, not instantly.
🫁 Alveolar air behaves in exactly the same way.
Why Is Slow Replacement Important?
If alveolar air were replaced completely with every breath:
- Oxygen level would rise and fall suddenly.
- Carbon dioxide level would change abruptly.
Instead, slow replacement:
- Keeps oxygen levels stable
- Keeps carbon dioxide levels stable
- Allows continuous gas exchange, even between breaths
Exam Concept (One Line)
Alveolar air is renewed gradually because only a small amount of fresh air enters the alveoli with each normal breath while a large volume of air remains in the lungs (functional residual capacity).
Ultra-Short Revision
- 🫁 Alveolus always contains residual air
- 🌬️ Each breath replaces only a small part
- 🔄 Old and fresh air mix together
- ⏳ Complete replacement requires many breaths (about 16 in this illustration)
- ✅ This maintains stable O₂ and CO₂ levels for continuous gas exchange.
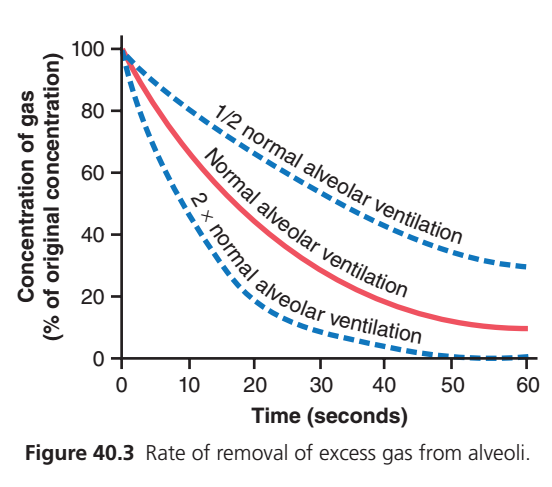
This graph (Guyton Physiology Fig. 40.3) is one of the most important concepts in respiratory physiology. It explains how fast an unwanted (excess) gas is washed out from the alveoli at different rates of alveolar ventilation.
Figure 40.3: Rate of Removal of Excess Gas from Alveoli
Step 1: Understand the Axes First
Y-Axis (Vertical)
Concentration of Gas (% of Original Concentration)
- At the beginning = 100%
- Means all excess gas is still present.
- As time passes, gas leaves the alveoli.
- Therefore concentration decreases.
Example
Suppose a patient inhales 100 molecules of anesthetic gas.
| Time | Gas Remaining |
|---|---|
| Beginning | 100% |
| Later | 80% |
| Later | 50% |
| Later | 20% |
| End | Almost 0% |
So,
Higher point = More gas remaining
Lower point = Less gas remaining
X-Axis (Horizontal)
Time (Seconds)
Shows how much time has passed.
Starts at
0 sec → 10 sec → 20 sec → 30 sec → 40 sec → 50 sec → 60 sec
As time increases,
the lungs continue removing excess gas.
Why Does the Curve Start at 100%?
At time zero,
The lungs have 100% of the excess gas.
Nothing has been removed yet.
So every curve begins at
100%
Why Do All Curves Go Down?
Because the lungs are constantly removing gas.
Each breath replaces old alveolar air with fresh air.
Old gas leaves.
Fresh air enters.
Therefore,
Gas concentration continuously falls.
Why Are the Curves Curved Instead of Straight?
This is the most important concept.
Imagine a bucket containing 100 marbles.
Each minute you remove 20% of the marbles remaining, not a fixed number.
First minute
100 → remove 20
Left = 80
Second minute
Remove 20% of 80
Remove 16
Left = 64
Third minute
Remove 20% of 64
Remove about 13
Left = 51
Notice:
At first,
gas disappears very quickly.
Later,
less gas remains,
so removal becomes slower.
Therefore,
The graph becomes a curve, not a straight line.
This is called exponential decay (washout).
There Are Three Different Curves
Each curve represents a different amount of alveolar ventilation.
① Middle Red Line = Normal Alveolar Ventilation
This is the normal healthy person’s breathing.
Normal breathing removes gas at a normal rate.
What happens?
0 sec
100%
↓
10 sec
Around 60%
↓
20 sec
Around 40%
↓
40 sec
Around 20%
↓
60 sec
Around 10%
Gas gradually disappears.
Concept
Normal breathing removes excess gas steadily.
Neither very fast nor very slow.
② Upper Blue Dashed Line = Half-Normal Alveolar Ventilation
This means
The person is breathing only half as much as normal.
Examples
- Respiratory depression
- Opioid overdose
- Sleeping deeply
- COPD
- Neuromuscular weakness
- Severe chest pain causing shallow breathing
What happens?
Fresh air enters slowly.
Old gas remains inside.
Therefore,
Gas removal becomes slow.
Observe the graph.
After 20 seconds,
Normal ventilation
≈40%
Half ventilation
≈60%
Much more gas is still inside.
Even after 60 seconds,
Nearly 30% of gas remains.
Easy Memory
Small ventilation
↓
Less fresh air
↓
Less washing
↓
Gas stays longer
Think of washing dirty clothes.
Using little water,
Dirt stays.
Exactly the same.
③ Lower Blue Dashed Line = Double-Normal Alveolar Ventilation
Now the person is breathing twice as much as normal.
Examples
Fresh air enters rapidly.
Old gas leaves rapidly.
Gas concentration falls very quickly.
Observe the graph.
Within about
20 seconds,
Only around 15–20% remains.
By
50–60 seconds,
Almost all gas has disappeared.
Easy Memory
Large ventilation
↓
More fresh air
↓
Better washing
↓
Gas disappears quickly
Imagine cleaning a dirty room.
One cleaner
↓
Room cleans slowly.
Five cleaners
↓
Room becomes clean rapidly.
Compare All Three Lines Together
| Curve | Breathing | Gas Removal | Gas Remaining After 60 sec |
|---|---|---|---|
| Upper Blue | Half normal | Slowest | Highest (~30%) |
| Red | Normal | Moderate | Moderate (~10%) |
| Lower Blue | Double normal | Fastest | Almost 0% |
Why Does More Ventilation Remove Gas Faster?
Every breath replaces some alveolar air.
Suppose
Normal breathing
Removes 350 mL old air each breath.
If breathing doubles,
Twice as much old air leaves every minute.
Therefore,
Excess gas is washed away much faster.
Clinical Correlation
During General Anesthesia
The anesthetic gas must leave the lungs after surgery.
If the patient breathes deeply,
Anesthetic leaves faster.
Recovery is quicker.
COPD Patient
Ventilation is reduced.
Gas removal becomes slow.
CO₂ accumulates.
Recovery is slower.
Exercise
Breathing increases.
Extra CO₂ produced by muscles is removed rapidly.
Hyperventilation
Extra CO₂ is washed out quickly.
Blood CO₂ falls.
This can cause dizziness and tingling due to respiratory alkalosis.
The Main Physiological Principle
The rate of removal (washout) of gas from the alveoli is directly proportional to alveolar ventilation.
- Higher alveolar ventilation → Faster gas removal
- Normal alveolar ventilation → Normal gas removal
- Lower alveolar ventilation → Slower gas removal
Super Easy Exam Memory Trick
Imagine three rooms filled with smoke:
- Room 1 (Half ventilation): Small fan → Smoke leaves slowly → Smoke stays longer.
- Room 2 (Normal ventilation): Normal fan → Smoke leaves at a normal rate.
- Room 3 (Double ventilation): Powerful fan → Smoke disappears very quickly.
Replace:
- Smoke = Excess gas in alveoli
- Fan = Alveolar ventilation
The stronger the “fan” (ventilation), the faster the excess gas is washed out of the alveoli. This is exactly what each curve in Figure 40.3 demonstrates.
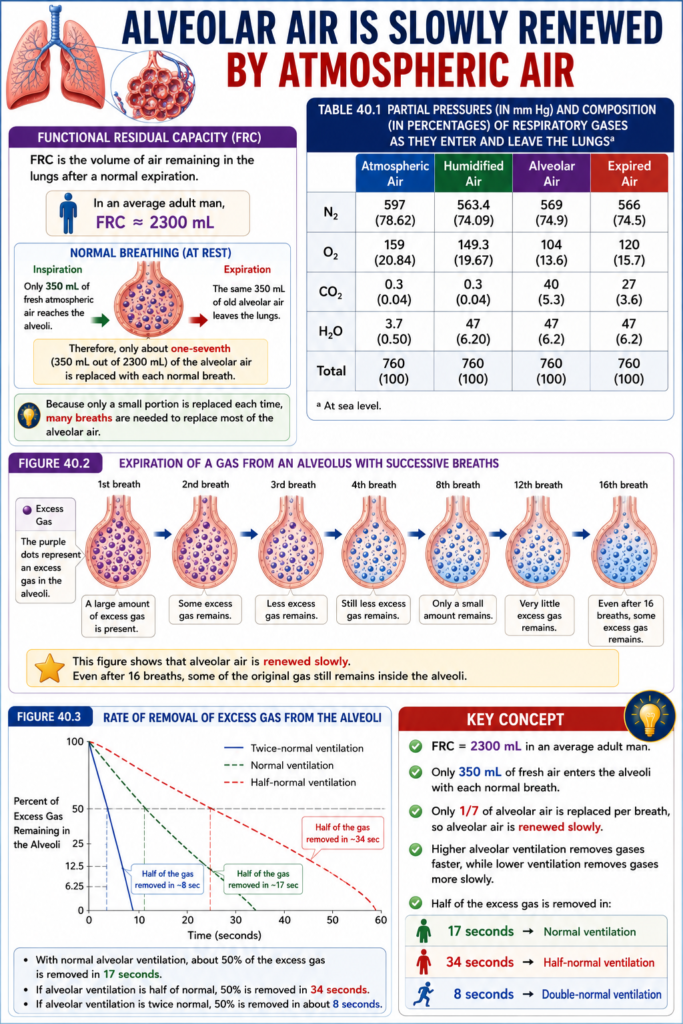
Slow Replacement of Alveolar Air Helps Stabilize Respiratory Control
- Alveolar air is replaced slowly, not all at once.
- This slow replacement helps keep breathing under stable control.
- It prevents sudden changes in the levels of oxygen (O₂) and carbon dioxide (CO₂) in the blood.
- As a result, the respiratory control system works more smoothly and steadily.
- If breathing stops for a short time, slow air replacement helps reduce sudden changes in:
- Oxygen (O₂) levels
- Carbon dioxide (CO₂) levels
- Blood pH (acid-base balance)
- This helps protect the body’s tissues from large fluctuations in gases and pH.
KEY CONCEPT
- Slow replacement of alveolar air acts as a buffer, keeping blood O₂, CO₂, and pH more stable and making respiratory control smoother and more stable.
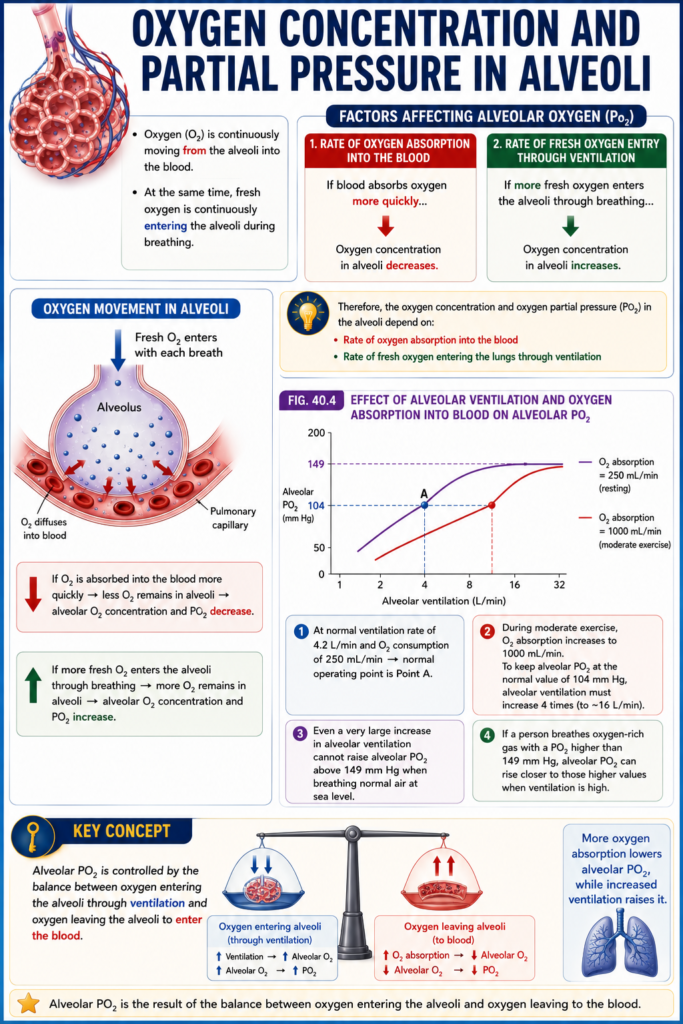
Oxygen Concentration and Partial Pressure in Alveoli
- Oxygen (O₂) is continuously moving from the alveoli into the blood.
- At the same time, fresh oxygen is continuously entering the alveoli during breathing.
- If the blood absorbs oxygen more quickly, the oxygen concentration in the alveoli decreases.
- If more fresh oxygen enters the alveoli through breathing, the oxygen concentration in the alveoli increases.
- Therefore, the oxygen concentration and oxygen partial pressure (PO₂) in the alveoli depend on:
- Rate of oxygen absorption into the blood
- Rate of fresh oxygen entering the lungs through ventilation
Fig. 40.4
- Fig. 40.4 shows how alveolar ventilation and oxygen absorption into the blood affect alveolar PO₂.
- One curve shows oxygen absorption at 250 mL/min.
- The other curve shows oxygen absorption at 1000 mL/min.
- At a normal ventilation rate of 4.2 L/min and an oxygen consumption of 250 mL/min, the normal operating point is Point A.
- During moderate exercise, oxygen absorption increases to 1000 mL/min.
- To keep alveolar PO₂ at the normal value of 104 mm Hg, alveolar ventilation must increase 4 times.
- Even a very large increase in alveolar ventilation cannot raise alveolar PO₂ above 149 mm Hg when breathing normal air at sea level.
- This is because 149 mm Hg is the highest possible PO₂ in humidified air at sea level.
- If a person breathes oxygen-rich gas with a PO₂ higher than 149 mm Hg, alveolar PO₂ can rise closer to those higher values when ventilation is high.
KEY CONCEPT
- Alveolar PO₂ is controlled by the balance between oxygen entering the alveoli through ventilation and oxygen leaving the alveoli to enter the blood. More oxygen absorption lowers alveolar PO₂, while increased ventilation raises it.
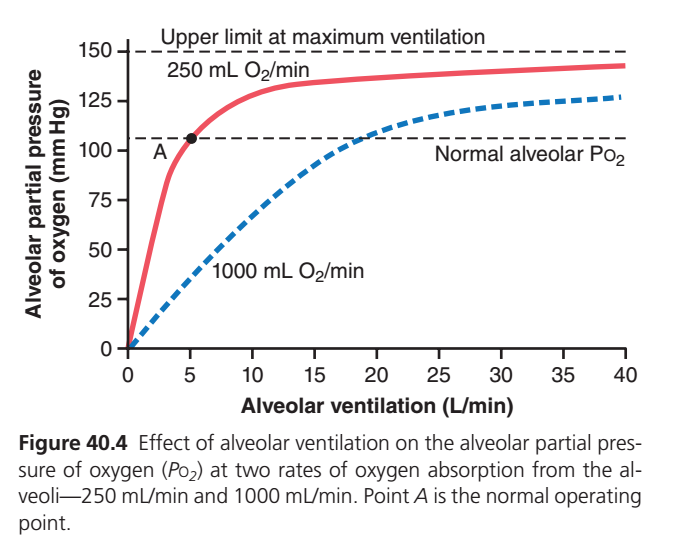
This is one of the highest-yield physiology graphs from Guyton Physiology (Fig. 40.4). It explains how alveolar ventilation affects alveolar oxygen partial pressure (PAO₂) and why oxygen consumption changes the shape of the curve.
Let’s understand every axis, line, point, and concept in the easiest way.
Figure 40.4: Effect of Alveolar Ventilation on Alveolar PO₂
Step 1: Understand the Axes
X-Axis (Horizontal)
Alveolar Ventilation (L/min)
This means how much fresh air reaches the alveoli every minute.
Examples:
- 0 L/min = No breathing
- 5 L/min = Normal alveolar ventilation
- 20 L/min = Deep/rapid breathing
- 40 L/min = Maximum ventilation
👉 As you move to the right, ventilation increases.
Y-Axis (Vertical)
Alveolar Partial Pressure of Oxygen (PAO₂) (mmHg)
This tells us how much oxygen is present inside the alveoli.
Higher value = More oxygen available for diffusion into blood.
Lower value = Less oxygen available.
Why Does the Graph Start at (0,0)?
At 0 L/min, there is no breathing.
No fresh oxygen enters the lungs.
Meanwhile, blood continues to absorb oxygen from the alveoli.
Eventually:
- Alveolar oxygen becomes 0 mmHg.
- Therefore, the graph starts at 0,0.
What Do the Two Curves Represent?
The two curves show different rates of oxygen consumption by the body.
🔴 Red Curve = Oxygen Consumption = 250 mL O₂/min
This is the normal resting oxygen consumption of a healthy adult.
At rest:
- Body needs about 250 mL oxygen per minute.
- Blood removes oxygen from alveoli at this rate.
This is the normal physiological condition.
🔵 Blue Dashed Curve = Oxygen Consumption = 1000 mL O₂/min
This represents very high oxygen consumption, such as:
- Heavy exercise
- Running
- Severe fever
- Hyperthyroidism
- Strenuous physical work
Here, tissues extract oxygen from the blood four times faster than at rest.
Understanding the Red Curve (250 mL/min)
Imagine you’re filling a bucket with water while someone is taking water out slowly.
- Fresh oxygen enters through breathing.
- Blood removes oxygen at 250 mL/min.
As ventilation increases:
- More fresh oxygen enters.
- PAO₂ rises rapidly.
Initially, even a small increase in ventilation causes a big rise in PAO₂.
Later, the curve flattens because PAO₂ is approaching its maximum possible value.
Why Does the Red Curve Flatten?
Air entering the lungs contains oxygen with a PO₂ of about 149 mmHg (humidified inspired air).
Alveolar PO₂ cannot exceed the oxygen pressure of inspired air.
So no matter how much you hyperventilate, PAO₂ approaches this limit but cannot go beyond it.
This is why the graph becomes nearly horizontal.
Dashed Horizontal Line at ~149 mmHg
Upper limit at maximum ventilation
This represents the highest possible alveolar PO₂.
Even with extremely fast breathing:
- You cannot exceed inspired oxygen pressure.
- Therefore, the curve approaches this ceiling.
Think of it like filling a glass:
Once full, adding more water won’t increase the level.
Understanding the Blue Dashed Curve (1000 mL/min)
Now imagine the body is exercising.
Blood removes oxygen four times faster.
Fresh oxygen enters, but oxygen is also being consumed much more rapidly.
Therefore:
- PAO₂ stays lower at the same ventilation.
Example:
At 10 L/min ventilation:
- Red curve ≈ 125 mmHg.
- Blue curve ≈ 70 mmHg.
Same breathing, but much more oxygen is being used.
Why Is the Blue Curve Lower?
Because oxygen is disappearing from the alveoli faster.
It’s like pouring water into a bucket while someone is draining it much faster.
Even if you pour quickly, the level stays lower.
Point A (Black Dot)
This is the normal operating point.
At Point A:
- Alveolar ventilation ≈ 4–5 L/min.
- Oxygen consumption = 250 mL/min.
- PAO₂ ≈ 104 mmHg.
This represents a healthy person:
- Breathing normally.
- Resting.
- Normal metabolism.
This is the body’s usual state.
Dashed Horizontal Line at ~104 mmHg
Normal alveolar PO₂
This is the normal oxygen pressure inside alveoli under resting conditions.
Why not 149 mmHg?
Because oxygen is continuously leaving the alveoli and entering the blood.
So alveolar PO₂ is always lower than inspired PO₂.
Why Does Increasing Ventilation Raise PAO₂?
Every breath brings fresh oxygen into the alveoli.
More ventilation means:
- More fresh oxygen enters.
- Oxygen removed by blood is replaced faster.
- PAO₂ increases.
Why Doesn’t PAO₂ Increase Forever?
Fresh inspired air contains a limited amount of oxygen.
Its maximum PO₂ is about 149 mmHg.
You cannot increase alveolar PO₂ above the oxygen content of inspired air (unless you breathe oxygen-enriched gas).
Compare the Two Curves
| Feature | 🔴 Red Curve | 🔵 Blue Curve |
|---|---|---|
| Oxygen consumption | 250 mL/min | 1000 mL/min |
| Physiological state | Rest | Heavy exercise |
| Oxygen removed from alveoli | Normal | Very high |
| PAO₂ at the same ventilation | Higher | Lower |
| Ventilation needed to reach PAO₂ ≈104 mmHg | ~4–5 L/min | ~18–20 L/min |
Everyday Analogy
Imagine a water tank:
- Tap = Breathing (alveolar ventilation).
- Drain = Oxygen uptake by blood.
Situation 1 (Red Curve)
The drain is small.
The tank fills easily.
Water level (PAO₂) rises quickly.
Situation 2 (Blue Curve)
The drain is very large.
Water leaves rapidly.
You must open the tap much more to maintain the same water level.
This is exactly what happens during heavy exercise.
Clinical Correlation
1. Exercise
During exercise:
- Oxygen consumption increases to around 1000 mL/min or more.
- If ventilation also increases appropriately, PAO₂ remains near normal.
- If ventilation fails to increase, PAO₂ falls.
2. Respiratory Depression
If ventilation decreases:
- Less oxygen enters the alveoli.
- PAO₂ falls.
- Blood oxygen decreases (hypoxemia).
3. High Metabolic States
In conditions like:
- Fever
- Hyperthyroidism
- Sepsis
Oxygen consumption increases.
Without increased ventilation, alveolar PO₂ decreases.
High-Yield MBBS Exam Points
- Normal oxygen consumption at rest = 250 mL/min.
- Normal alveolar ventilation = about 4–5 L/min.
- Normal alveolar PO₂ ≈ 104 mmHg (Point A).
- Maximum possible alveolar PO₂ ≈ 149 mmHg (breathing room air).
- Increasing alveolar ventilation raises PAO₂.
- Increasing oxygen consumption lowers PAO₂ unless ventilation also increases.
Super Easy Memory Trick
Think of the alveoli as a water tank:
- 🚰 Tap = Alveolar ventilation (fresh oxygen entering).
- 🚿 Drain = Oxygen uptake by blood.
- 💧 Water level = Alveolar PO₂.
- Open the tap more (↑ ventilation) → Water level rises (↑ PAO₂).
- Open the drain more (↑ oxygen consumption) → Water level falls (↓ PAO₂).
- To keep the water level normal during exercise, you must open the tap wider—this is why ventilation increases during exercise.
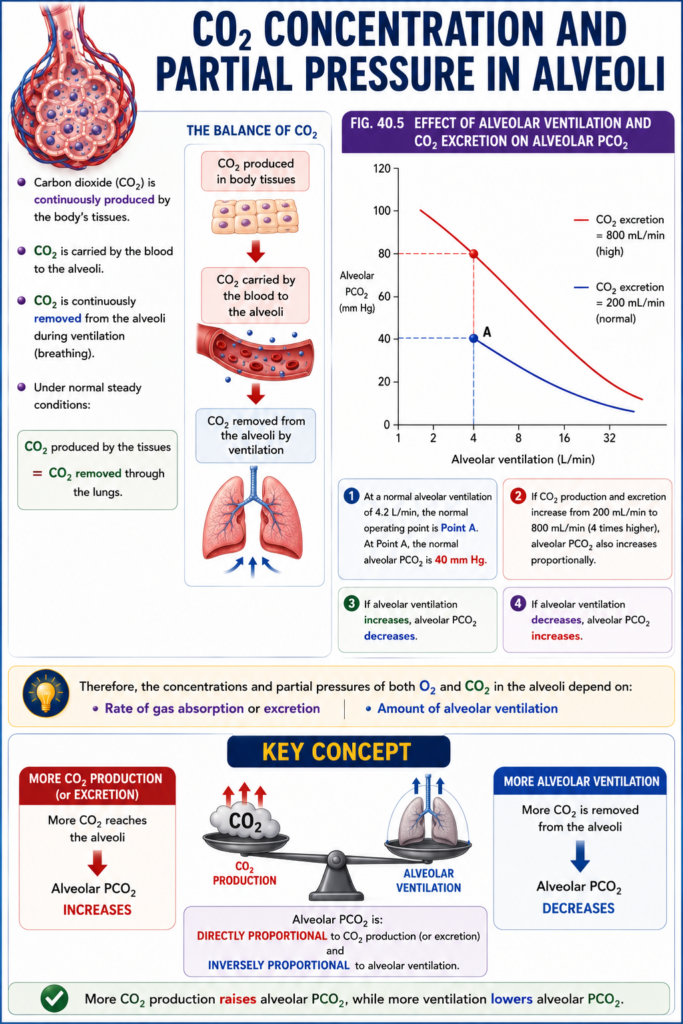
CO₂ Concentration and Partial Pressure in Alveoli
- Carbon dioxide (CO₂) is continuously produced by the body’s tissues.
- CO₂ is carried by the blood to the alveoli.
- CO₂ is continuously removed from the alveoli during ventilation (breathing).
- Under normal steady conditions:
- CO₂ produced by the tissues = CO₂ removed through the lungs.
Fig. 40.5
- Fig. 40.5 shows how alveolar ventilation and CO₂ excretion affect alveolar PCO₂.
- One curve represents a normal CO₂ excretion rate of 200 mL/min.
- The other curve represents a higher CO₂ excretion rate of 800 mL/min.
- At a normal alveolar ventilation of 4.2 L/min, the normal operating point is Point A.
- At Point A, the normal alveolar PCO₂ is 40 mm Hg.
- If CO₂ production and excretion increase from 200 mL/min to 800 mL/min (4 times higher), alveolar PCO₂ also increases proportionally.
- If alveolar ventilation increases, alveolar PCO₂ decreases.
- If alveolar ventilation decreases, alveolar PCO₂ increases.
- Therefore, the concentrations and partial pressures of both O₂ and CO₂ in the alveoli depend on:
- Rate of gas absorption or excretion
- Amount of alveolar ventilation
KEY CONCEPT
- Alveolar PCO₂ is directly proportional to CO₂ production and inversely proportional to alveolar ventilation. More CO₂ production raises PCO₂, while more ventilation lowers PCO₂.
This is Figure 40.5 from Guyton Physiology, and it is the opposite concept of Figure 40.4.
- Figure 40.4: More ventilation → Higher PO₂
- Figure 40.5: More ventilation → Lower PCO₂
This is one of the most frequently tested MBBS physiology concepts.
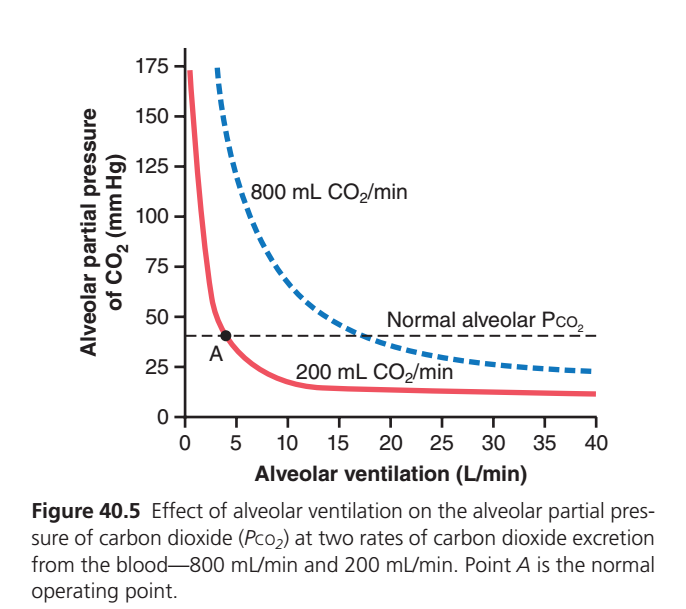
Figure 40.5: Effect of Alveolar Ventilation on Alveolar PCO₂
The One-Line Concept
Alveolar PCO₂ is directly proportional to CO₂ production and inversely proportional to alveolar ventilation.
Mathematically:Alveolar PCO₂∝Alveolar ventilationCO₂ production
This means:
- ↑ CO₂ production → ↑ PCO₂
- ↑ Alveolar ventilation → ↓ PCO₂
Step 1: Understand the Axes
X-Axis (Horizontal)
Alveolar Ventilation (L/min)
This means:
Fresh air reaching the alveoli every minute.
Examples
- 0 L/min = No breathing
- 5 L/min = Normal breathing
- 20 L/min = Deep breathing
- 40 L/min = Maximum ventilation
👉 Moving right means more breathing.
Y-Axis (Vertical)
Alveolar Partial Pressure of CO₂ (PACO₂)
This tells us
How much carbon dioxide is present inside the alveoli.
Higher value
↓
More CO₂ trapped
Lower value
↓
Less CO₂ remaining
Why Does the Graph Start Very High?
Imagine
You suddenly stop breathing.
No fresh air enters.
No CO₂ leaves.
But the body keeps producing CO₂.
Blood continuously delivers CO₂ into the alveoli.
Therefore
CO₂ accumulates rapidly.
Hence,
PCO₂ becomes very high.
Why Do Both Curves Go Down?
As ventilation increases,
Fresh air enters.
Old CO₂-rich air leaves.
Therefore,
CO₂ concentration inside alveoli decreases.
More ventilation
↓
More CO₂ washed out
↓
Lower alveolar PCO₂
Understanding the Two Curves
The curves represent two different rates of CO₂ production by the body.
🔴 Red Curve = CO₂ Production = 200 mL/min
This is the normal resting CO₂ production.
A healthy adult produces approximately:
200 mL CO₂ per minute
This is the normal resting condition.
What Happens?
At low ventilation
↓
CO₂ accumulates.
As ventilation increases
↓
CO₂ is removed rapidly.
Eventually,
PCO₂ becomes quite low.
Observe the graph.
At
5 L/min ventilation
↓
PCO₂ ≈40 mmHg
Normal value.
At
20–40 L/min
↓
PCO₂ becomes very low
Around 10–15 mmHg.
Easy Concept
Normal CO₂ production
Normal breathing
=
Normal alveolar PCO₂
🔵 Blue Dashed Curve = CO₂ Production = 800 mL/min
This represents
Very high metabolic activity.
Examples
- Heavy exercise
- Running
- Fever
- Hyperthyroidism
- Severe muscle activity
The body now produces
800 mL CO₂/min
which is
4 times normal.
What Happens?
Blood delivers much more CO₂ into the alveoli.
Even if breathing is increased,
CO₂ is entering the alveoli very rapidly.
Therefore
PCO₂ stays higher.
Observe the graph.
At
10 L/min ventilation
Red curve
≈15 mmHg
Blue curve
≈70 mmHg
Same ventilation
↓
Much higher CO₂ production
↓
Higher alveolar PCO₂.
Why Is the Blue Curve Higher?
Imagine
You have
A room filling with smoke.
One small fire
↓
Little smoke.
Large fire
↓
Huge amount of smoke.
Even with the same fan,
The room stays smokier.
Exactly the same.
The fire
=
CO₂ production
The fan
=
Ventilation
Point A (Black Dot)
Point A represents
The normal operating point.
At Point A
Alveolar ventilation
≈4–5 L/min
CO₂ production
≈200 mL/min
Alveolar PCO₂
≈40 mmHg
This is a healthy resting adult.
Dashed Horizontal Line (40 mmHg)
This line represents
Normal alveolar PCO₂
Normal value
≈40 mmHg
Remember
Alveolar PCO₂
≈
Arterial PCO₂
≈40 mmHg
This is a favorite MBBS viva question.
Why Does More Ventilation Lower CO₂?
Every breath removes CO₂.
If breathing doubles,
Twice as much CO₂ leaves the lungs every minute.
Therefore
CO₂ cannot accumulate.
Hence
PCO₂ falls.
Why Is the Curve So Steep Initially?
Look carefully.
Going from
2 L/min
↓
5 L/min
causes a huge fall in PCO₂.
Later,
Increasing ventilation
from
30
↓
40 L/min
causes only a small fall.
Why?
Because most CO₂ has already been washed out.
Removing the remaining small amount makes little difference.
Compare Both Curves
| Feature | 🔴 Red Curve | 🔵 Blue Curve |
|---|---|---|
| CO₂ production | 200 mL/min | 800 mL/min |
| Physiological state | Rest | Heavy exercise |
| CO₂ entering alveoli | Normal | Very high |
| Alveolar PCO₂ at same ventilation | Lower | Higher |
| Ventilation needed to maintain PCO₂ ≈40 mmHg | ~4–5 L/min | ~18–20 L/min |
Compare Figure 40.4 and Figure 40.5
| Feature | Figure 40.4 (PO₂) | Figure 40.5 (PCO₂) |
|---|---|---|
| Gas | Oxygen | Carbon dioxide |
| Increasing ventilation | ↑ PO₂ | ↓ PCO₂ |
| High metabolism | ↓ PO₂ | ↑ PCO₂ |
| Normal value | PAO₂ ≈104 mmHg | PACO₂ ≈40 mmHg |
| Curve shape | Rises then plateaus | Falls rapidly then plateaus |
Clinical Correlation
1. Hyperventilation
Examples
- Anxiety
- Panic attack
- Mechanical overventilation
Effects
↑ Ventilation
↓
More CO₂ removed
↓
↓ PACO₂
↓
Respiratory alkalosis
Symptoms
- Dizziness
- Tingling
- Lightheadedness
2. Hypoventilation
Examples
- COPD
- Opioid overdose
- Neuromuscular disease
Effects
↓
Less CO₂ removal
↓
↑ PACO₂
↓
Respiratory acidosis
3. Exercise
During exercise
CO₂ production increases greatly.
To maintain normal PACO₂,
Ventilation also increases proportionally.
This is why healthy people exercising hard usually keep their arterial and alveolar PCO₂ close to 40 mmHg despite producing much more CO₂.
High-Yield MBBS Exam Points
- Normal CO₂ production = 200 mL/min.
- Heavy exercise can increase CO₂ production to about 800 mL/min or more.
- Normal alveolar ventilation = about 4–5 L/min.
- Normal alveolar PCO₂ ≈ 40 mmHg (Point A).
- Increasing alveolar ventilation lowers alveolar PCO₂.
- Increasing CO₂ production raises alveolar PCO₂ unless ventilation increases proportionally.
- Alveolar PCO₂ is approximately equal to arterial PCO₂ under normal conditions.
Super Easy Memory Trick
Imagine the alveoli as a room:
- 🔥 Fire = Body producing CO₂
- 🌬️ Exhaust fan = Alveolar ventilation
- 🌫️ Smoke = CO₂ inside the alveoli (PACO₂)
- Small fire + normal fan → Little smoke (normal PACO₂ ≈ 40 mmHg).
- Big fire + same fan → Room fills with smoke (↑ PACO₂).
- Turn the fan faster (↑ ventilation) → Smoke is removed quickly (↓ PACO₂).
Final Rule to Never Forget
- Oxygen behaves like filling a tank: More ventilation → Higher PAO₂.
- Carbon dioxide behaves like emptying waste: More ventilation → Lower PACO₂.
This opposite relationship between PO₂ and PCO₂ with alveolar ventilation is the key physiological message of Figures 40.4 and 40.5.
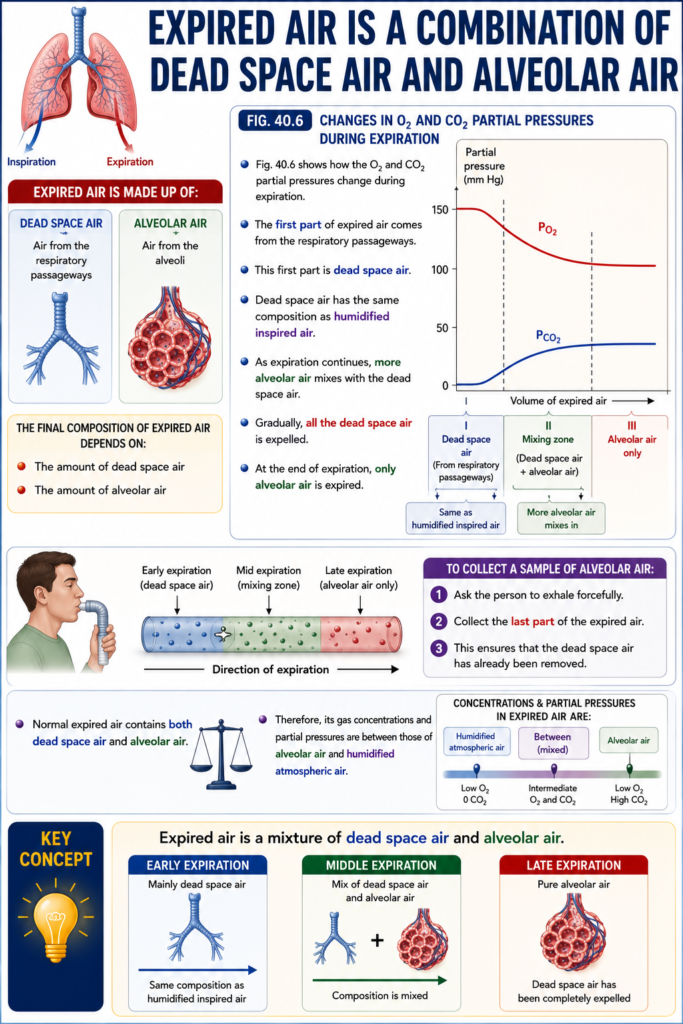
Expired Air Is a Combination of Dead Space Air and Alveolar Air
- Expired air is made up of:
- Dead space air
- Alveolar air
- The final composition of expired air depends on:
- The amount of dead space air
- The amount of alveolar air
Fig. 40.6
- Fig. 40.6 shows how the O₂ and CO₂ partial pressures change during expiration.
- The first part of expired air comes from the respiratory passageways.
- This first part is dead space air.
- Dead space air has the same composition as humidified inspired air.
- As expiration continues, more alveolar air mixes with the dead space air.
- Gradually, all the dead space air is expelled.
- At the end of expiration, only alveolar air is expired.
- To collect a sample of alveolar air:
- Ask the person to exhale forcefully.
- Collect the last part of the expired air.
- This ensures that the dead space air has already been removed.
- Normal expired air contains both dead space air and alveolar air.
- Therefore, its gas concentrations and partial pressures are between those of alveolar air and humidified atmospheric air.
KEY CONCEPT
- Expired air is a mixture of dead space air and alveolar air. Early expired air is mainly dead space air, while the last part of expiration is pure alveolar air.
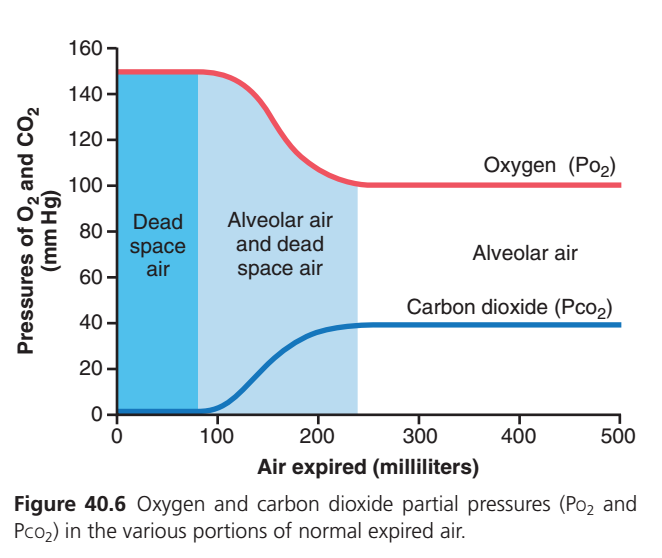
This is Figure 40.6 from Guyton Physiology, and it explains why the composition of expired air changes during one normal expiration.
Core Concept:
Expired air is NOT pure alveolar air.
It is a mixture of dead space air and alveolar air.
This graph explains exactly which air comes out first, which comes out later, and why the PO₂ and PCO₂ change during expiration.
Step 1: Understand the Axes
X-Axis (Horizontal)
Air Expired (milliliters)
This shows how much air has come out of the lungs during one expiration.
Starts from
- 0 mL → Beginning of expiration
- 100 mL
- 200 mL
- 500 mL → End of expiration
👉 As you move to the right, more air has been exhaled.
Y-Axis (Vertical)
Partial Pressure (mmHg)
Shows the partial pressure of
- Oxygen (PO₂) (Red line)
- Carbon dioxide (PCO₂) (Blue line)
First Understand Where the Air Comes From
At the end of inspiration, the respiratory tract contains two different types of air.
Mouth
 │
Trachea
 │
Bronchi
 │
Bronchioles
 │
Alveoli
The air inside the lungs is divided into:
1. Conducting Airways (Dead Space)
Contains
Fresh inspired air
No gas exchange occurs here.
2. Alveoli
Contains
Alveolar air
Gas exchange has already occurred.
Therefore,
At the beginning of expiration,
Air does NOT come from alveoli first.
It comes from the conducting airways first.
This is the entire idea of the graph.
The Three Shaded Regions
The graph is divided into three regions, each representing a different type of expired air.
🟦 Region 1 (Dark Blue Shaded Area)
Dead Space Air
Approximately
0–150 mL
This is the first air that comes out during expiration.
Where does this air come from?
From
- Nose
- Pharynx
- Trachea
- Bronchi
These conducting airways do not exchange gases with blood.
Therefore, this air is almost identical to inspired air.Oxygen in Dead Space Air (Red Line)
Look at the red line.
It starts around
150 mmHg
Why?
Because dead space air is fresh atmospheric air.
Inspired humidified air has:
PO₂ ≈150 mmHg
So,
The first expired air contains a high oxygen concentration.
Carbon Dioxide in Dead Space Air (Blue Line)
Look at the blue line.
It is almost
0 mmHg
Why?
Because inspired air contains almost no CO₂.
No gas exchange occurred in dead space.
Therefore,
CO₂ remains almost zero.
Summary of Region 1
| Gas | Value |
|---|---|
| PO₂ | High (~150 mmHg) |
| PCO₂ | Very low (~0 mmHg) |
This air has not participated in gas exchange.
🟦 Region 2 (Light Blue Shaded Area)
Mixture of Dead Space Air + Alveolar Air
Approximately
150–250 mL
Now something important happens.
Dead space air has already left.
Alveolar air begins reaching the mouth.
But initially,
Both types of air mix together.
What Happens to PO₂? (Red Line)
Observe the red line.
It begins to fall.
Why?
Because
Dead space air
↓
High oxygen
mixes with
Alveolar air
↓
Lower oxygen
The mixture has an intermediate oxygen level.
Therefore,
PO₂ gradually decreases.
What Happens to PCO₂? (Blue Line)
Look carefully.
It begins rising.
Why?
Dead space air
↓
Almost no CO₂
mixes with
Alveolar air
↓
High CO₂
Therefore,
The mixed air has increasing CO₂.
Hence,
The blue curve rises.
Why Are These Curves Smooth?
Because mixing is gradual.
It is not like switching on a light.
Initially,
Mostly dead space air.
Then,
Increasing alveolar air.
Finally,
Pure alveolar air.
Therefore,
The change is gradual.
Summary of Region 2
| Gas | What Happens? | Why? |
|---|---|---|
| PO₂ | Falls gradually | More alveolar air enters the expired air |
| PCO₂ | Rises gradually | Increasing amount of alveolar air contains more CO₂ |
⬜ Region 3 (White Area)
Pure Alveolar Air
Approximately
After 250 mL
Now
Almost all dead space air has already been expelled.
Only alveolar air remains.
Oxygen (Red Line)
Observe the graph.
It becomes flat around
100 mmHg
Why?
This is the normal alveolar PO₂.
Pure alveolar air has
PO₂ ≈100–104 mmHg
No more dead space air is mixing.
Therefore,
The value becomes constant.
Carbon Dioxide (Blue Line)
Observe the blue line.
It becomes flat around
40 mmHg
Why?
Pure alveolar air contains
PCO₂ ≈40 mmHg
Again,
No dead space air is left.
So the value remains constant.
Summary of Region 3
| Gas | Value |
|---|---|
| PO₂ | ≈100 mmHg |
| PCO₂ | ≈40 mmHg |
This represents true alveolar air.
Understanding the Red Line (PO₂)
Let’s follow it step by step.
Beginning
Dead space air
↓
PO₂ ≈150 mmHg
↓
Fresh inspired air
Middle
Mixing begins
↓
PO₂ falls gradually
End
Pure alveolar air
↓
PO₂ ≈100 mmHgnderstanding the Blue Line (PCO₂)
Beginning
Dead space air
↓
PCO₂ ≈0 mmHg
↓
Almost no CO₂
Middle
Mixing begins
↓
PCO₂ rises
End
Pure alveolar air
↓
PCO₂ ≈40 mmHg
Why Does Dead Space Air Come Out First?
Imagine a drinking straw attached to a balloon.
Mouth
  │
 Straw
  │
Balloon- Straw = Conducting airways (dead space)
- Balloon = Alveoli
When you squeeze the balloon:
- The air already inside the straw comes out first.
- Only after the straw empties does balloon air come out.
Exactly the same happens in the lungs.
Why Is This Clinically Important?
If you collect the very first expired air, it does not represent alveolar gas.
To estimate alveolar gases accurately, clinicians analyze the end-expiratory air (end-tidal gas), because it comes from the alveoli and reflects:
- End-tidal CO₂ (ETCO₂) ≈ alveolar PCO₂.
- End-expiratory O₂ ≈ alveolar PO₂.
Complete Summary Table
| Region | Air Coming Out | PO₂ | PCO₂ | Reason |
|---|---|---|---|---|
| 1. Dark blue | Dead space air only | ≈150 mmHg | ≈0 mmHg | Fresh inspired air, no gas exchange |
| 2. Light blue | Mixture of dead space + alveolar air | Falls from 150 → 100 mmHg | Rises from 0 → 40 mmHg | Progressive mixing of the two air types |
| 3. White | Pure alveolar air | ≈100 mmHg | ≈40 mmHg | Air has fully participated in gas exchange |
High-Yield MBBS Viva Points
- Expired air is a mixture of dead space air and alveolar air.
- The first expired air comes from the anatomical dead space.
- Dead space air has PO₂ ≈150 mmHg and PCO₂ ≈0 mmHg because no gas exchange occurs there.
- During the middle of expiration, dead space air mixes with alveolar air, producing gradual changes in PO₂ and PCO₂.
- The last part of expiration is pure alveolar air with PO₂ ≈100 mmHg and PCO₂ ≈40 mmHg.
- End-expiratory (end-tidal) gas best represents alveolar gas composition.
Super Easy Memory Trick
Imagine a pipe connected to a water tank:
- Pipe = Dead space (conducting airways)
- Water tank = Alveoli
When you open the valve:
- Water already in the pipe comes out first → Dead space air (high O₂, almost no CO₂).
- Pipe water mixes with tank water → Mixed air (O₂ falls, CO₂ rises).
- Only tank water comes out → Pure alveolar air (PO₂ ≈100 mmHg, PCO₂ ≈40 mmHg).
Think: Pipe first, then mixture, then tank — this sequence exactly matches the three shaded regions in Figure 40.6.
MADE BY SELF LEARNING CEO AND FOUNDER DR SHEEN
