


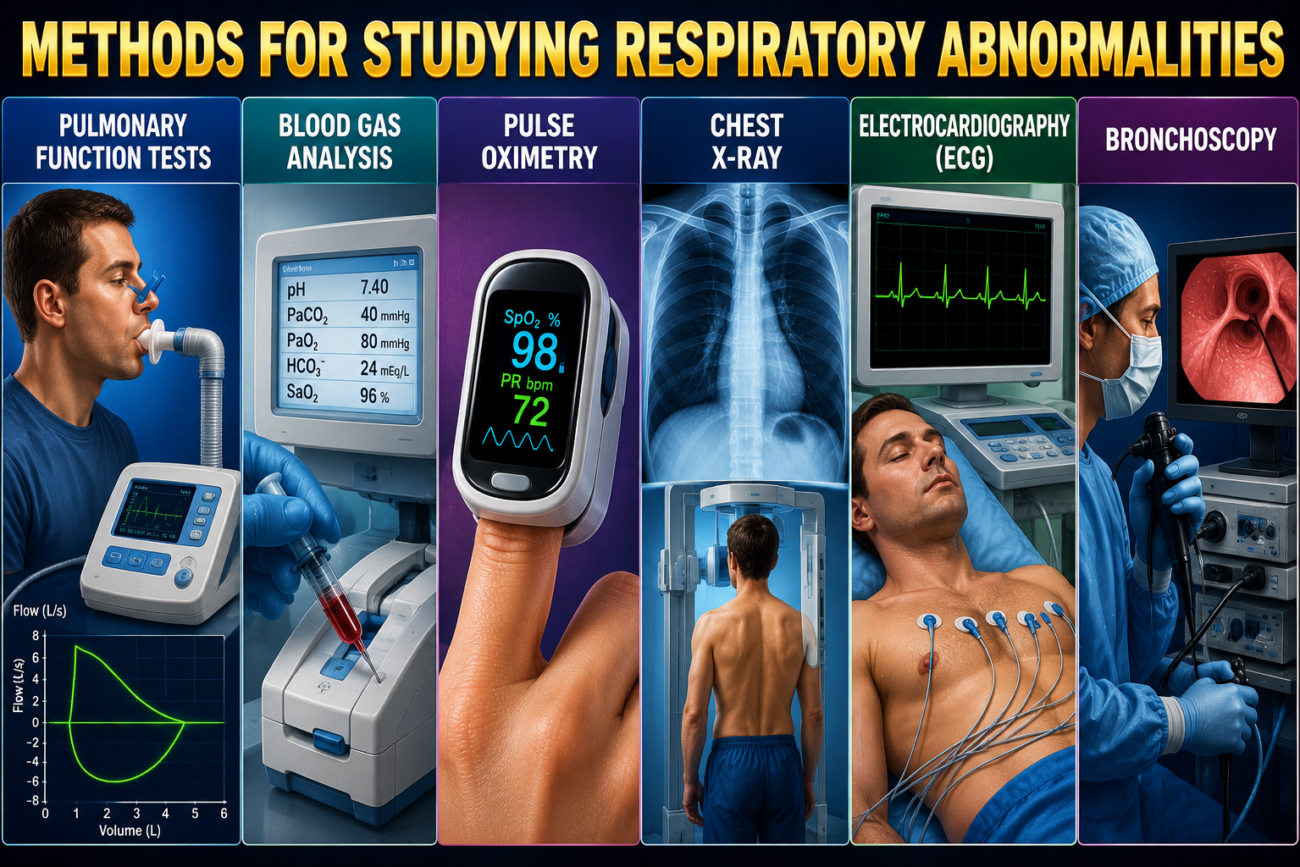
- Several methods are used to study respiratory abnormalities.
- These methods include measuring:
- Vital capacity.
- Tidal air.
- Functional residual capacity.
- Dead space.
- Physiological shunt.
- Physiological dead space.
- These measurements are only part of the tools available to a clinical pulmonary physiologist.
- Additional methods for studying respiratory abnormalities are described in the following section.
KEY CONCEPT
- Respiratory abnormalities are studied using different pulmonary function measurements.
- Important measurements include vital capacity, tidal air, functional residual capacity, dead space, physiological shunt, and physiological dead space.
- These measurements represent only part of the clinical pulmonary physiologist’s diagnostic tools.
STUDY OF BLOOD GASES AND BLOOD pH
- The most important tests of pulmonary function measure:
- Blood partial pressure of oxygen (PO₂).
- Blood partial pressure of carbon dioxide (PCO₂).
- Blood pH.
- These measurements help in choosing the appropriate treatment for:
- Acute respiratory distress.
- Acute acid–base abnormalities.
- These tests are simple and rapid.
- The measurements can be completed within a few minutes.
- Only a few drops of blood are required.
Determination of Blood pH
- Blood pH is measured using a pH meter.
- The pH meter contains:
- A glass electrode.
- A reference electrode.
- Both electrodes are present in a single miniature probe.
- The pH meter measures the difference in electrical potential (voltage) between the glass electrode and the reference electrode.
- The generated voltage is amplified.
- The result is displayed digitally as pH units.
- The pH meter is calibrated using solutions of known pH.
Determination of Blood CO₂
- A glass electrode pH meter can also be used to measure blood CO₂.
- When a weak sodium bicarbonate solution is exposed to CO₂ gas, the CO₂ dissolves into the solution until equilibrium is reached.
- At equilibrium, the pH depends on the concentrations of CO₂ and bicarbonate (HCO₃⁻).
- This relationship follows the Henderson–Hasselbalch equation.
Henderson–Hasselbalch Equation
pH=6.1+log(CO2HCO3−)
Conceptual Solution of the Equation
- If HCO₃⁻ increases while CO₂ remains constant:
- The ratio CO2HCO3− increases.
- pH increases.
- Blood becomes more alkaline.
- If CO₂ increases while HCO₃⁻ remains constant:
- The ratio CO2HCO3− decreases.
- pH decreases.
- Blood becomes more acidic.
- When measuring blood CO₂:
- A miniature glass electrode is surrounded by a thin plastic membrane.
- A sodium bicarbonate solution of known concentration is placed between the electrode and the plastic membrane.
- Blood is applied to the outer surface of the plastic membrane.
- CO₂ diffuses from the blood into the bicarbonate solution.
- Only one drop or a few drops of blood are required.
- The glass electrode measures the pH.
- The blood CO₂ concentration is then calculated using the Henderson–Hasselbalch equation.
KEY CONCEPT
- Blood PO₂, PCO₂, and pH are the most fundamental tests of pulmonary function.
- These tests are rapid and require only a few drops of blood.
- Blood pH is measured using a glass electrode pH meter.
- Blood CO₂ is measured indirectly by allowing CO₂ to diffuse into a bicarbonate solution and measuring its pH.
- Henderson–Hasselbalch equation: pH=6.1+log(HCO3−CO2)\boxed{\text{pH}=6.1+\log\left(\frac{HCO_3^-}{CO_2}\right)}pH=6.1+log(CO2HCO3−).
- An increase in HCO₃⁻ raises pH, whereas an increase in CO₂ lowers pH.
Determination of Blood PO₂
- The oxygen (O₂) concentration in blood is measured by a technique called polarography.
- An electric current is passed between a small negative electrode and the solution.
- If the voltage of the electrode is more than −0.6 volt different from the solution, O₂ deposits on the electrode.
- The rate of current flowing through the electrode is directly proportional to the concentration of O₂.
- Therefore, the current is also directly proportional to the blood PO₂.
- In practice, a negative platinum electrode with a surface area of about 1 mm² is used.
- The platinum electrode is separated from the blood by a thin plastic membrane.
- The plastic membrane allows O₂ to diffuse to the electrode.
- The plastic membrane prevents proteins and other substances from reaching the electrode, protecting it from being poisoned.
- The pH meter, CO₂ measuring device, and PO₂ measuring device are often combined into one instrument.
- This instrument can measure blood pH, PCO₂, and PO₂ at the same time.
- All three measurements can be completed within about one minute.
- Only a single droplet of blood is required.
- This allows blood gas levels and pH to be monitored almost continuously at the bedside.
KEY CONCEPT
- Blood PO₂ is measured by the polarography technique.
- When the electrode voltage is more than −0.6 volt different from the solution, O₂ deposits on the electrode.
- The electrical current is directly proportional to O₂ concentration and PO₂.
- A platinum electrode and a thin plastic membrane are used to measure PO₂.
- The plastic membrane allows O₂ diffusion but blocks proteins and other substances.
- Modern instruments measure pH, PCO₂, and PO₂ together within about one minute using a single drop of blood.
MEASUREMENT OF MAXIMUM EXPIRATORY FLOW
- The diagnosis and treatment of respiratory disorders depend on understanding the basic physiology of respiration and gas exchange.
- Some respiratory diseases occur because of inadequate ventilation.
- Other respiratory diseases are caused by:
- Abnormal diffusion across the pulmonary membrane.
- Abnormal transport of gases between the lungs and tissues by the blood.
- The treatment differs according to the cause.
- Therefore, it is not enough to diagnose only “respiratory insufficiency.”
METHODS FOR STUDYING RESPIRATORY ABNORMALITIES
- Respiratory abnormalities can be studied by measuring:
- Vital capacity.
- Tidal air.
- Functional residual capacity.
- Dead space.
- Physiological shunt.
- Physiological dead space.
- These measurements are only part of the tools used by a clinical pulmonary physiologist.
- Additional methods are also available.
STUDY OF BLOOD GASES AND BLOOD pH
- The most important pulmonary tests measure:
- Blood PO₂.
- Blood PCO₂.
- Blood pH.
- These tests help in choosing the correct treatment for:
- Acute respiratory distress.
- Acid–base disorders.
- These measurements are rapid.
- Only a few drops of blood are required.
Determination of Blood pH
- Blood pH is measured using a pH meter.
- The pH meter contains:
- A glass electrode.
- A reference electrode.
- The difference in electrical potential (voltage) between the two electrodes is measured.
- The voltage is amplified.
- The result is displayed digitally as pH.
- The pH meter is calibrated using solutions of known pH.
Determination of Blood CO₂
- A glass electrode pH meter can also measure blood CO₂.
- CO₂ dissolves into a weak sodium bicarbonate solution until equilibrium is reached.
- At equilibrium, the pH depends on the concentrations of CO₂ and HCO₃⁻.
- This relationship follows the Henderson–Hasselbalch equation.
Henderson–Hasselbalch Equation
pH=6.1+log(CO2HCO3−)
Conceptual Solution of the Equation
- If HCO₃⁻ increases while CO₂ remains constant:
- The ratio CO2HCO3− increases.
- pH increases.
- If CO₂ increases while HCO₃⁻ remains constant:
- The ratio CO2HCO3− decreases.
- pH decreases.
- A miniature glass electrode is surrounded by a thin plastic membrane.
- A known sodium bicarbonate solution is present between the electrode and the membrane.
- Blood is placed on the outer surface of the membrane.
- CO₂ diffuses into the bicarbonate solution.
- The glass electrode measures pH.
- Blood CO₂ is calculated using the Henderson–Hasselbalch equation.
Fig. 43.1
- During many respiratory diseases, especially asthma, airway resistance increases greatly during expiration.
- This led to the concept of maximum expiratory flow.
- Maximum expiratory flow is the highest expiratory airflow that cannot be increased further, even if more expiratory force is applied.
- Maximum expiratory flow is greater when the lungs contain a large volume of air.
- Maximum expiratory flow decreases when the lungs become nearly empty.
- Fig. 43.1A shows the effect of increased pressure on the outside of the alveoli and bronchioles during forced expiration.
- The same external pressure compresses both alveoli and bronchioles.
- This pressure:
- Pushes air from the alveoli toward the bronchioles.
- Also compresses the bronchioles, opposing airflow.
- When the bronchioles nearly collapse, increasing expiratory effort:
- Raises alveolar pressure.
- Increases bronchiolar collapse by the same amount.
- Increases airway resistance.
- Therefore, airflow cannot increase further, and maximum expiratory flow is reached.
- Fig. 43.1B shows the effect of different lung volumes on maximum expiratory flow.
- The graph is obtained after a person:
- Takes a maximum inspiration.
- Expires with maximum effort until no greater airflow can be produced.
- The person rapidly reaches a maximum expiratory airflow of more than 400 L/min.
- Even greater expiratory effort cannot increase the airflow further.
- As lung volume decreases, the maximum expiratory flow also decreases.
- In a fully expanded lung, elastic pull keeps the bronchi and bronchioles more open.
- As the lung becomes smaller, the elastic pull decreases.
- The bronchi and bronchioles collapse more easily with chest pressure.
- This progressively reduces the maximum expiratory flow rate.
KEY CONCEPT
- Respiratory diseases may result from inadequate ventilation, diffusion defects, or abnormal blood gas transport.
- Blood PO₂, PCO₂, and pH are rapidly measured using only a few drops of blood.
- Blood CO₂ is calculated using the Henderson–Hasselbalch equation: pH=6.1+log(HCO3−CO2)\boxed{\text{pH}=6.1+\log\left(\frac{HCO_3^-}{CO_2}\right)}pH=6.1+log(CO2HCO3−).
- Maximum expiratory flow is the highest airflow that cannot be increased further despite greater expiratory effort.
- Airway collapse limits expiratory flow during forced expiration.
- Maximum expiratory flow is highest at large lung volumes and decreases as lung volume becomes smaller.
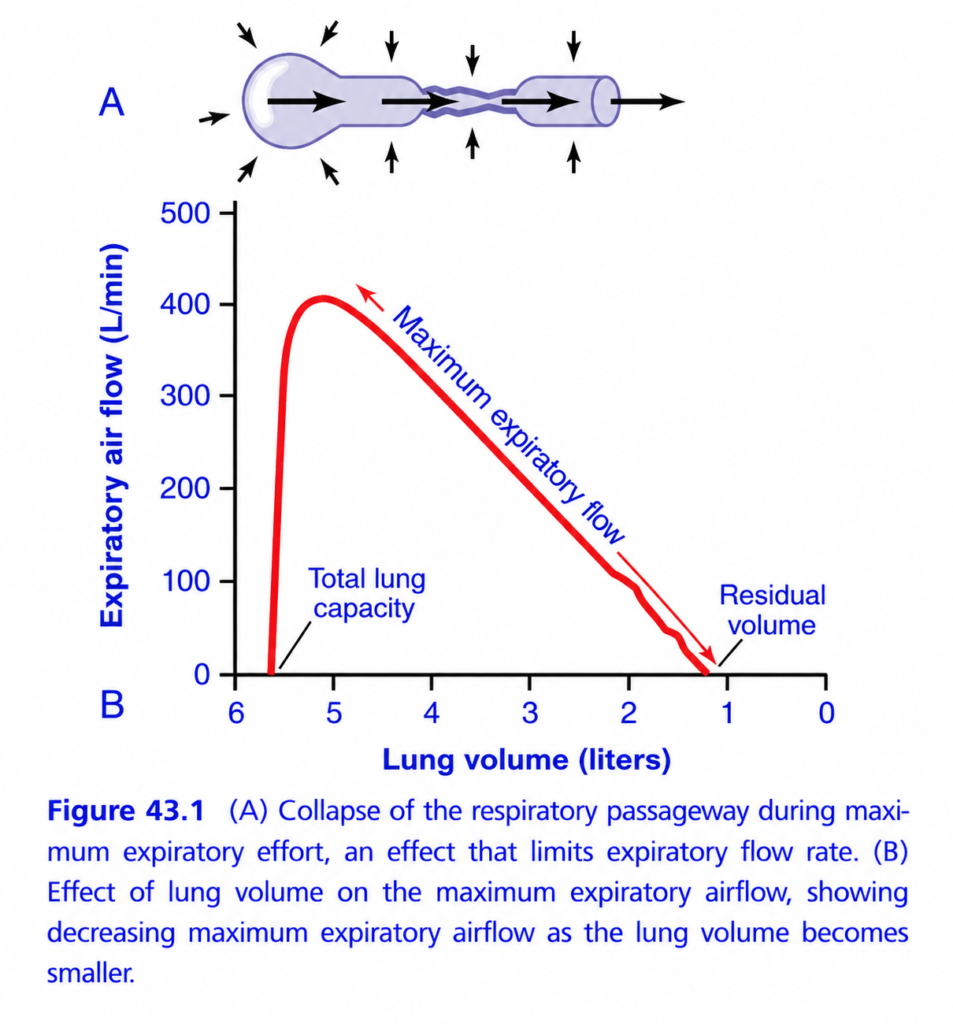
Maximum Expiratory Airflow and Dynamic Airway Compression (Figure 43.1) – Easy Conceptual Summary
This figure explains why we cannot blow air out infinitely fast, even with maximum effort. It demonstrates how airway compression (dynamic airway collapse) and lung volume determine the maximum expiratory airflow.
The figure has two parts:
- A: Collapse of the respiratory airway during forced expiration.
- B: Relationship between lung volume and maximum expiratory airflow.
Basic Concept
During quiet expiration, air leaves the lungs easily because the airways remain open.
During forced expiration, the chest muscles and abdominal muscles contract strongly, increasing pressure inside the chest.
This high pressure can compress the airways, reducing airflow.
Therefore,
Stronger effort does not always produce greater airflow.
PART A – Collapse of the Respiratory Airway
This diagram shows what happens during maximum forced expiration.
Step 1: Air Moves Out of the Lungs
The large arrows inside the airway show:
➡️ Air flowing from the alveoli toward the mouth.
Step 2: Pressure Around the Airway Increases
The small black arrows outside the airway indicate:
➡️ Increased intrapleural pressure due to forceful contraction of expiratory muscles.
This pressure squeezes the airway from outside.
Step 3: Airway Narrows
As air moves outward:
- Pressure inside the airway gradually falls.
- Pressure outside the airway remains high.
Eventually,
The pressure outside becomes greater than the pressure inside.
This causes the airway to narrow.
Step 4: Dynamic Airway Compression
At the narrow portion,
The airway is partially compressed.
This is called:
Dynamic airway compression or airway collapse.
Although air still flows,
The narrowed airway limits the amount of airflow.
Easy Concept
Imagine squeezing a soft rubber drinking straw.
Water initially flows through it.
If you squeeze harder,
The straw becomes narrow.
Eventually,
No matter how hard you push the water,
The narrowed straw limits the flow.
The same happens in the bronchi during forced expiration.
Key Point
Maximum expiratory airflow is limited by airway compression, not simply by muscular effort.
PART B – Maximum Expiratory Flow-Volume Curve
This graph shows how maximum expiratory airflow changes as lung volume decreases.
Understanding the Axes
X-axis (Lung Volume in Liters)
Shows the amount of air remaining in the lungs.
- Left side = Total Lung Capacity (TLC) (lungs completely filled)
- Right side = Residual Volume (RV) (air remaining after maximal expiration)
As expiration proceeds,
➡️ Lung volume decreases.
Y-axis (Expiratory Airflow, L/min)
Shows the rate at which air leaves the lungs.
Higher value
➡️ Faster airflow.
Understanding the Red Curve
The red curve represents the maximum expiratory airflow.
It has three important phases.
Phase 1: Rapid Rise
What happens?
At the start of forced expiration,
Airflow rises rapidly to its highest value.
Why?
The lungs are fully inflated.
Elastic recoil of the lungs is greatest.
Large airways are widely open.
Air is expelled very rapidly.
Easy Concept
Imagine a fully inflated balloon.
When released,
Air rushes out quickly.
Phase 2: Peak Expiratory Flow
What happens?
Airflow reaches its highest point
(about 400 L/min in this figure).
This is called:
Peak Expiratory Flow (PEF).
Why?
This is when:
- Lung recoil is maximum.
- Airways are still relatively open.
Therefore,
Air exits at the fastest rate.
Key Point
Peak expiratory flow occurs near Total Lung Capacity (TLC).
Phase 3: Gradual Decline
What happens?
As expiration continues,
Airflow steadily decreases.
Why?
There are three reasons:
1. Lung Elastic Recoil Decreases
As the lungs empty,
They lose their elastic “spring.”
Less force pushes air outward.
2. Airways Become Narrower
Smaller lung volume provides less outward support (radial traction) to the airways.
The airways become narrower.
Airflow decreases.
3. Dynamic Airway Compression Increases
The airways are compressed more easily during forced expiration.
This further limits airflow.
Easy Concept
Think of squeezing a balloon.
At first,
The balloon is tight and pushes air out rapidly.
As it empties,
The balloon becomes soft.
Less pressure is available to push air out.
Residual Volume (RV)
At the end of expiration,
The graph reaches the Residual Volume (RV).
Why does airflow become zero?
The lungs cannot empty completely.
Some air always remains.
This remaining air is called:
Residual Volume (RV).
It prevents alveolar collapse.
Why Can’t We Blow Out All the Air?
Because:
- Airways collapse during forced expiration.
- Lung elastic recoil becomes weak.
- Small airways close before all air is expelled.
Therefore,
Some air always remains inside the lungs.
Clinical Importance
Normal Person
- Airways remain open longer.
- High peak expiratory flow.
- Normal flow-volume curve.
Asthma
Bronchial smooth muscle constriction narrows the airways.
Maximum expiratory flow decreases.
COPD / Emphysema
Elastic tissue is destroyed.
Loss of elastic recoil causes:
- Early airway collapse.
- Markedly reduced expiratory airflow.
- Increased residual volume due to air trapping.
Comparison of the Two Parts
| Part | What it Shows | Main Concept |
|---|---|---|
| A | Airway narrowing during forced expiration | Dynamic airway compression limits airflow |
| B | Flow-volume relationship | Maximum expiratory flow decreases as lung volume falls |
Quick Memory Table
| Feature | Explanation |
|---|---|
| Maximum expiratory flow | Highest airflow during forced expiration |
| Peak expiratory flow (PEF) | Occurs near Total Lung Capacity (TLC) |
| Dynamic airway compression | High pleural pressure compresses the airways during forced expiration |
| Total Lung Capacity (TLC) | Maximum lung volume before expiration begins |
| Residual Volume (RV) | Air remaining after maximal expiration |
| Why flow decreases during expiration | Reduced elastic recoil + airway narrowing + dynamic airway compression |
Easy Memory Trick
“Full lungs = Fast flow”
- Strong elastic recoil
- Airways widely open
- Highest expiratory flow
“Empty lungs = Slow flow”
- Weak elastic recoil
- Airways narrow
- Dynamic compression
- Low expiratory flow
Key Concept
During forced expiration, airflow initially increases rapidly because the lungs are fully expanded, providing maximum elastic recoil and wide-open airways. The highest airflow achieved is the peak expiratory flow (PEF). As lung volume decreases, elastic recoil declines, airways become narrower, and dynamic airway compression develops because intrapleural pressure exceeds the pressure inside the airways. These factors progressively reduce expiratory airflow despite continued muscular effort. At the end of forced expiration, airflow falls to zero when the residual volume (RV) is reached, because the lungs cannot empty completely without causing airway closure. This mechanism is particularly important in asthma and COPD/emphysema, where airway narrowing or loss of elastic recoil further limits expiratory airflow.
Abnormalities of the Maximum Expiratory Flow–Volume Curve
Fig. 43.2
- Fig. 43.2 shows:
- The normal maximum expiratory flow–volume curve.
- The flow–volume curve in constricted lungs.
- The flow–volume curve in partial airway obstruction.
- In constricted lungs:
- Total lung capacity (TLC) is reduced.
- Residual volume (RV) is reduced.
- The lungs cannot expand to their normal maximum volume.
- Therefore, maximum expiratory flow is lower than normal, even with maximum expiratory effort.
- Diseases causing constricted lungs include:
- Fibrotic lung diseases, such as:
- Tuberculosis.
- Silicosis.
- Diseases that restrict the chest cage, such as:
- Kyphosis.
- Scoliosis.
- Fibrotic pleurisy.
- Fibrotic lung diseases, such as:
- In airway obstruction, expiration is more difficult than inspiration.
- During expiration, the positive pressure inside the chest increases the tendency of the airways to collapse.
- During inspiration, the negative pleural pressure pulls the airways open while expanding the alveoli.
- Therefore:
- Air enters the lungs easily during inspiration.
- Air becomes trapped during expiration.
- Over months or years, air trapping causes:
- Increased total lung capacity (TLC).
- Increased residual volume (RV).
- This change is shown by the green curve in Fig. 43.2.
- Because of airway obstruction:
- The airways collapse more easily than normal.
- The maximum expiratory flow rate is greatly reduced.
- Asthma is the classic disease causing severe airway obstruction.
- Emphysema also causes serious airway obstruction in some stages.
KEY CONCEPT
- Fig. 43.2 compares normal lungs, constricted lungs, and lungs with airway obstruction.
- Constricted lungs have decreased TLC, decreased RV, and reduced maximum expiratory flow.
- Airway obstruction makes expiration difficult because the airways collapse more easily.
- Air trapping increases both TLC and RV over time.
- Maximum expiratory flow is markedly reduced in airway obstruction.
- Asthma and emphysema are common diseases causing airway obstruction.
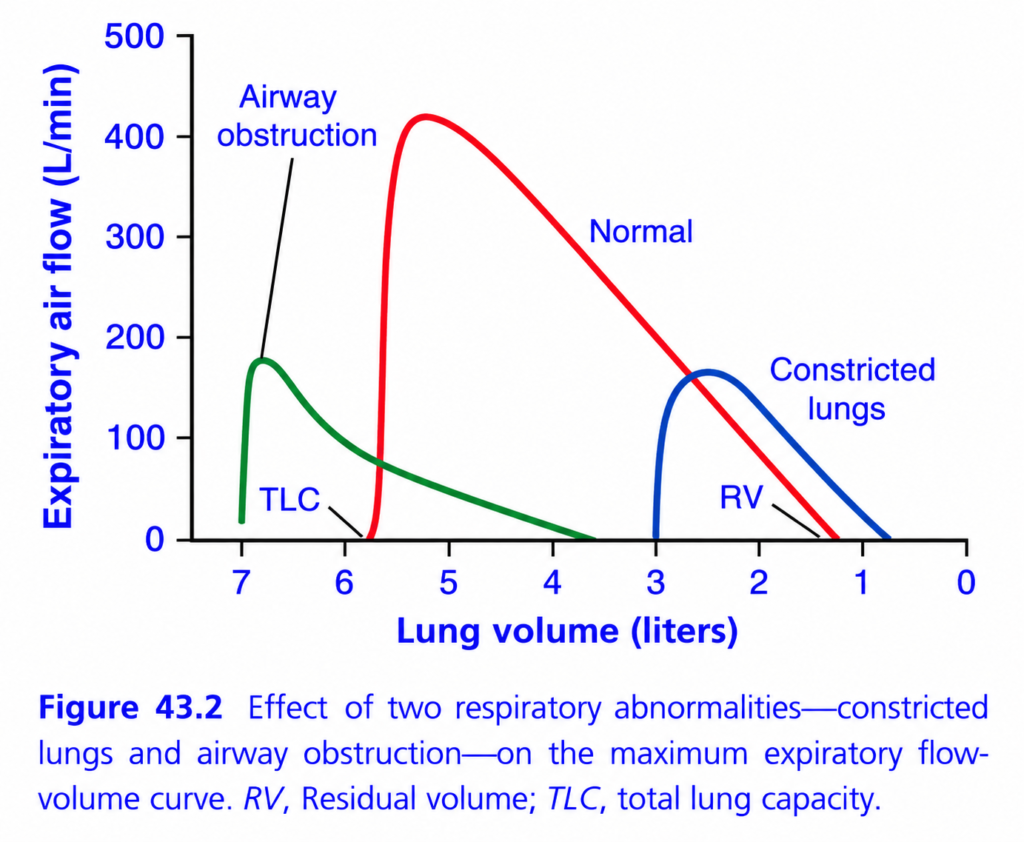
Effect of Airway Obstruction and Constricted Lungs on the Maximum Expiratory Flow–Volume Curve (Figure 43.2) – Easy Conceptual Summary
This figure compares the maximum expiratory flow-volume curves in three situations:
- Normal lungs (Red curve)
- Airway obstruction (Green curve) – e.g., Asthma, COPD
- Constricted lungs (Blue curve) – e.g., Pulmonary fibrosis
It helps us understand how obstructive and restrictive lung diseases change expiratory airflow and lung volumes.
Basic Concept
During forced expiration, the amount of air leaving the lungs depends on:
- Lung elastic recoil
- Airway diameter
- Lung volume
Diseases affecting any of these factors change the flow-volume curve.
Understanding the Axes
X-axis (Lung Volume in Liters)
Shows the amount of air inside the lungs.
- Left side = Total Lung Capacity (TLC) (lungs fully inflated)
- Right side = Residual Volume (RV) (air left after maximum expiration)
As expiration proceeds,
➡️ Lung volume decreases.
Y-axis (Expiratory Airflow)
Shows how fast air leaves the lungs.
Higher curve
➡️ Faster airflow
Lower curve
➡️ Slower airflow
Understanding Every Curve
1. Red Curve — Normal Lungs
This is the normal flow-volume curve.
What happens?
- Expiratory flow rises rapidly.
- Reaches a high peak.
- Then gradually falls until residual volume is reached.
Why?
Initially,
- Lungs are fully expanded.
- Elastic recoil is strong.
- Airways are wide open.
Therefore,
Peak expiratory flow is high.
As the lungs empty,
- Elastic recoil decreases.
- Airways become narrower.
- Airflow gradually falls.
Key Point
Normal lungs have:
- High peak expiratory flow
- Normal TLC
- Normal RV
2. Green Curve — Airway Obstruction
This curve represents diseases like:
- Asthma
- Chronic Bronchitis
- COPD
- Emphysema
What happens?
Compared with normal,
- Peak expiratory flow is much lower.
- The curve is flattened.
- Expiration is prolonged.
- Total Lung Capacity (TLC) is increased.
- Residual Volume (RV) is increased due to air trapping.
Why does airflow decrease?
The airways become narrowed because of:
- Bronchospasm
- Mucus accumulation
- Airway inflammation
- Loss of elastic recoil (especially in emphysema)
These changes increase airway resistance.
Therefore,
Air cannot leave the lungs quickly.
Why is TLC increased?
Air becomes trapped inside the lungs.
The lungs remain overinflated.
Therefore,
Total Lung Capacity increases.
Why is RV increased?
Because many small airways collapse during expiration,
Some air cannot be expelled.
That trapped air remains inside the lungs.
This increases:
Residual Volume (RV).
Easy Concept
Imagine trying to empty a balloon through a very narrow straw.
The balloon still contains plenty of air,
but the narrow straw prevents rapid emptying.
Some air always remains trapped inside.
Key Point
Obstructive disease causes:
- Low expiratory flow
- Increased TLC
- Increased RV
- Air trapping
3. Blue Curve — Constricted Lungs (Restrictive Disease)
This curve represents restrictive lung diseases such as:
- Pulmonary fibrosis
- Interstitial lung disease
- Chest wall deformity
- Severe obesity (restrictive pattern)
What happens?
Compared with normal,
- Lung volumes are much smaller.
- TLC is markedly reduced.
- RV is also reduced.
- Peak flow is slightly reduced but relatively preserved.
Why?
Restrictive lungs become stiff.
They cannot expand normally.
Therefore,
The lungs contain less air.
Because lung volume is small,
The entire curve shifts toward lower lung volumes.
Why is airflow relatively preserved?
Although lung volume is reduced,
The stiff lungs have increased elastic recoil.
This strong recoil helps push air out.
Therefore,
Peak flow is not reduced as much as in obstructive disease.
Easy Concept
Imagine a small but tight balloon.
It cannot hold much air,
but whatever air it contains is pushed out quickly because the balloon is stiff.
Key Point
Restrictive disease causes:
- Decreased TLC
- Decreased RV
- Relatively preserved expiratory flow
- Smaller flow-volume loop
Comparing the Three Curves
| Feature | Normal | Airway Obstruction | Constricted (Restrictive) Lungs |
|---|---|---|---|
| Peak expiratory flow | High | Markedly decreased | Slightly decreased or relatively preserved |
| Airway resistance | Normal | Increased | Normal |
| Elastic recoil | Normal | Decreased (especially emphysema) | Increased |
| Total Lung Capacity (TLC) | Normal | Increased | Decreased |
| Residual Volume (RV) | Normal | Increased | Decreased |
| Flow-volume curve | Normal shape | Flattened and prolonged | Small, left-shifted curve |
Easy Memory Trick
Obstructive Disease = “Can’t Get Air Out”
Examples:
- Asthma
- COPD
- Chronic bronchitis
- Emphysema
Features:
- Narrow airways
- Low expiratory flow
- Air trapping
- ↑ TLC
- ↑ RV
Restrictive Disease = “Can’t Get Air In”
Examples:
- Pulmonary fibrosis
- Interstitial lung disease
Features:
- Small lungs
- ↓ TLC
- ↓ RV
- Relatively preserved expiratory flow
Clinical Correlation
Asthma
- Reversible bronchoconstriction
- Decreased peak expiratory flow
- Obstructive flow-volume curve
COPD/Emphysema
- Loss of elastic recoil
- Early airway collapse
- Markedly reduced expiratory flow
- Increased TLC and RV due to hyperinflation and air trapping
Pulmonary Fibrosis
- Stiff lungs
- Reduced lung expansion
- Small lung volumes
- High elastic recoil
- Restrictive flow-volume curve
Quick Revision Table
| Disease | Main Problem | TLC | RV | Peak Flow |
|---|---|---|---|---|
| Normal | Normal airway and lung elasticity | Normal | Normal | High |
| Obstructive | Narrow airways, air trapping | ↑ Increased | ↑ Increased | ↓↓↓ Markedly decreased |
| Restrictive | Stiff lungs, reduced expansion | ↓ Decreased | ↓ Decreased | Slightly ↓ or relatively preserved |
Key Concept
This figure compares the flow-volume curves of normal, obstructive, and restrictive lungs. In normal lungs, airflow rapidly reaches a high peak expiratory flow and then gradually declines as lung volume decreases. In airway obstruction (such as asthma and COPD), narrowed airways and dynamic airway collapse greatly reduce expiratory airflow, producing a flattened curve with increased total lung capacity (TLC) and increased residual volume (RV) due to air trapping. In restrictive lung disease (such as pulmonary fibrosis), the lungs are stiff and cannot expand fully, resulting in decreased TLC and decreased RV. Although lung volumes are reduced, increased elastic recoil helps maintain relatively preserved expiratory flow. Thus, obstructive diseases primarily impair airflow, whereas restrictive diseases primarily reduce lung volume.
FORCED EXPIRATORY VITAL CAPACITY AND FORCED EXPIRATORY VOLUME
- Another simple and useful pulmonary function test is the Forced Expiratory Vital Capacity (FVC).
- FVC is recorded using a spirometer.
- Fig. 43.3A shows the FVC recording of a person with normal lungs.
- Fig. 43.3B shows the FVC recording of a person with partial airway obstruction.
Forced Expiratory Vital Capacity (FVC)
- During the FVC test, the person first inhales as much air as possible until reaching Total Lung Capacity (TLC).
- The person then expires into the spirometer:
- With maximum effort.
- As rapidly as possible.
- As completely as possible.
- The total downward movement of the lung volume tracing represents the Forced Expiratory Vital Capacity (FVC).
- Compare the recordings of:
- Normal lungs (Fig. 43.3A).
- Partial airway obstruction (Fig. 43.3B).
- The total FVC is not very different in the two individuals.
- This indicates only a moderate difference in the total lung volume.
Forced Expiratory Volume in One Second (FEV₁)
- The major difference is the amount of air expired each second, especially during the first second.
- Therefore, the Forced Expiratory Volume in the first second (FEV₁) is compared with the normal value.
- The FEV₁/FVC% is calculated as:
FEV1/FVC%=(FVCFEV1)×100
Conceptual Solution of the Equation
- Step 1: Measure the air expired during the first second (FEV₁).
- Step 2: Measure the total Forced Vital Capacity (FVC).
- Step 3: Divide FEV₁ by FVC.
- Step 4: Multiply the result by 100 to obtain the percentage.
- In normal lungs (Fig. 43.3A):
- FEV₁/FVC = 80%.
- This means 80% of the total FVC is expired during the first second.
- In partial airway obstruction (Fig. 43.3B):
- FEV₁/FVC = 47%.
- This means only 47% of the total FVC is expired during the first second.
- In severe airway obstruction, such as acute asthma:
- FEV₁/FVC may decrease to less than 20%.
KEY CONCEPT
- FVC measures the total amount of air exhaled forcefully after a maximal inspiration.
- The FVC test is performed using a spirometer.
- Fig. 43.3A shows normal lungs, and Fig. 43.3B shows partial airway obstruction.
- FEV₁ is the amount of air exhaled during the first second of forced expiration.
- FEV₁/FVC% = (FEV₁ ÷ FVC) × 100.
- Normal FEV₁/FVC is about 80%.
- Airway obstruction reduces FEV₁/FVC (about 47% in partial obstruction and less than 20% in severe asthma).
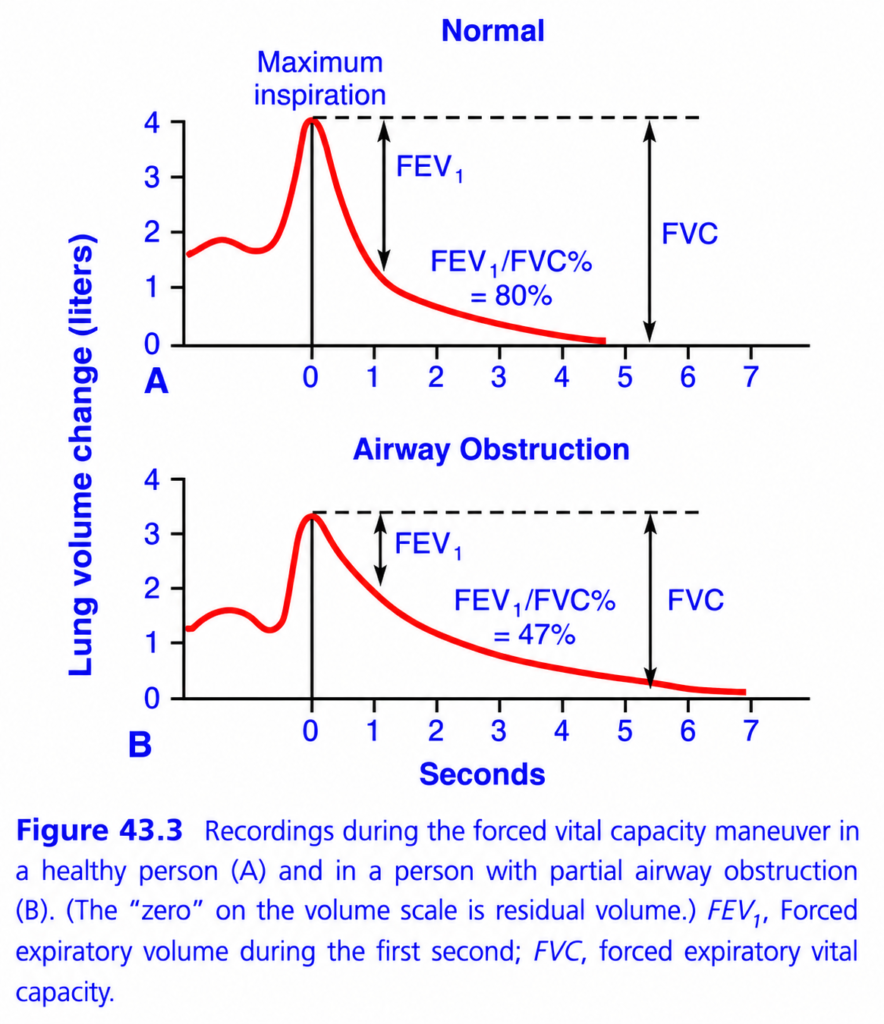
Forced Vital Capacity (FVC) Maneuver: Normal vs Airway Obstruction (Figure 43.3) – Easy Conceptual Summary
This figure compares the Forced Vital Capacity (FVC) test in:
- A. Normal person
- B. Person with airway obstruction (Asthma/COPD)
It explains the most important spirometry parameters:
- FEV₁ (Forced Expiratory Volume in 1 second)
- FVC (Forced Vital Capacity)
- FEV₁/FVC ratio
This is one of the most frequently tested graphs in MBBS and postgraduate entrance exams.
Basic Concept
During spirometry, the person:
Step 1
Takes the deepest possible breath
(Maximum Inspiration)
↓
Step 2
Immediately blows out
as hard and as fast as possible
until no more air can be expired.
The machine records:
- How much air is exhaled.
- How fast it is exhaled.
Important Definitions
1. FVC (Forced Vital Capacity)
Definition
The total volume of air that can be forcefully exhaled after taking the deepest possible breath.
Easy Concept
Think of a balloon.
Fill it completely.
Now squeeze until no more air comes out.
The total air leaving the balloon is the FVC.
2. FEV₁ (Forced Expiratory Volume in One Second)
Definition
The amount of air exhaled during the first second of the forced expiration.
Easy Concept
Imagine timing the balloon for exactly one second after squeezing it.
The amount of air leaving in that first second is FEV₁.
3. FEV₁/FVC Ratio
Definition
The percentage of the total FVC that is expired during the first second.
FormulaFEV1/FVC×100
It indicates how rapidly the lungs can be emptied.
PART A — Normal Person
Step 1: Maximum Inspiration
The curve reaches its highest point.
This represents:
Maximum lung filling.
Step 2: Forced Expiration Begins
Immediately after maximum inspiration,
The person exhales forcefully.
The curve falls rapidly.
Why does it fall so quickly?
Normal lungs have:
- Open airways.
- Low airway resistance.
- Strong elastic recoil.
Therefore,
Air leaves rapidly.
FEV₁ in Normal Person
During the first second,
About 80% of the vital capacity is exhaled.
Therefore,
FEV₁/FVC ≈ 80%
This is the normal value shown in the graph.
FVC in Normal Person
The person continues exhaling until:
Almost no more air can be expelled.
This total expired volume is:
Forced Vital Capacity (FVC).ey Point
Normal lungs empty quickly.
Most of the air comes out during the first second.
PART B — Airway Obstruction
This graph represents diseases such as:
- Asthma
- COPD
- Chronic bronchitis
- Emphysema
What happens?
After maximum inspiration,
Expiration begins,
but the curve falls much more slowly.
Why?
Because the airways are narrowed due to:
- Bronchospasm
- Mucus
- Airway inflammation
- Loss of elastic recoil (especially in emphysema)
Air cannot escape rapidly.
FEV₁ in Airway Obstruction
The amount exhaled during the first second is greatly reduced.
Much less air leaves during the first second compared with normal lungs.
Why does FEV₁ decrease?
Because airway narrowing increases resistance.
The lungs empty slowly.
FVC in Airway Obstruction
The total FVC may be:
- Normal
- Slightly reduced
because eventually much of the air is expired,
but it takes much longer.
FEV₁/FVC Ratio
The graph shows:
Normal
FEV₁/FVC = 80%
↓
Airway Obstruction
FEV₁/FVC = 47%
This large reduction is the hallmark of obstructive lung disease.
Easy Concept
Imagine two balloons.
Balloon 1 (Normal)
Open with a wide opening.
Air rushes out immediately.
Most air leaves within one second.
Balloon 2 (Narrow Opening)
The opening is partly blocked.
Air escapes very slowly.
Even after one second,
Most air is still inside.
This is exactly what happens in asthma and COPD.
Comparison of Normal and Airway Obstruction
| Feature | Normal | Airway Obstruction |
|---|---|---|
| Airway diameter | Normal | Narrow |
| Airway resistance | Low | High |
| FEV₁ | Normal | Markedly decreased |
| FVC | Normal | Normal or slightly decreased |
| FEV₁/FVC ratio | About 80% | About 47% |
| Time to empty lungs | Short | Long |
Clinical Importance
Normal Spirometry
- FEV₁ = Normal
- FVC = Normal
- FEV₁/FVC ≈ 80%
Asthma
- Bronchospasm
- FEV₁ decreases
- FEV₁/FVC decreases
- Improves after bronchodilator
COPD
- Permanent airway narrowing
- Loss of elastic recoil
- Markedly decreased FEV₁
- Low FEV₁/FVC ratio
- Expiration is prolonged
How to Diagnose Obstructive Lung Disease from This Graph
Look at the FEV₁/FVC ratio.
If the ratio is:
- ≈80% → Normal
- <70% → Obstructive lung disease
- The lower the ratio, the more severe the obstruction.
Quick Memory Table
| Parameter | Normal | Obstructive Disease |
|---|---|---|
| FEV₁ | Normal | ↓↓↓ Markedly decreased |
| FVC | Normal | Normal or ↓ Slightly |
| FEV₁/FVC | ~80% | <70% (47% in this graph) |
| Expiration | Fast | Slow and prolonged |
Easy Memory Trick
Normal = “Fast Emptying”
- Wide airways
- Most air leaves in the first second
- FEV₁/FVC ≈ 80%
Obstruction = “Slow Emptying”
- Narrow airways
- Air leaves slowly
- FEV₁↓↓↓
- FEV₁/FVC↓↓↓
Key Concept
The Forced Vital Capacity (FVC) maneuver evaluates how quickly and completely the lungs can be emptied after a maximum inspiration. FVC is the total volume of air exhaled forcefully after full inspiration, whereas FEV₁ is the volume exhaled during the first second. In normal lungs, open airways and strong elastic recoil allow rapid emptying, so about 80% of the FVC is exhaled in the first second (FEV₁/FVC ≈ 80%). In obstructive lung diseases such as asthma and COPD, narrowed airways and increased resistance markedly reduce FEV₁, while FVC is often normal or only slightly reduced because most of the air is eventually exhaled but over a longer period. Consequently, the FEV₁/FVC ratio falls significantly (47% in this figure), making it the most important spirometric indicator of airway obstruction.
PREPARE AND MADE BY SELF LEARNING Forced Vital Capacity (FVC) Maneuver: Normal vs Airway Obstruction (Figure 43.3) – Easy Conceptual Summary for MBBS Students
This figure compares the Forced Vital Capacity (FVC) test in:
- A. Normal person
- B. Person with airway obstruction (Asthma/COPD)
It explains the most important spirometry parameters:
- FEV₁ (Forced Expiratory Volume in 1 second)
- FVC (Forced Vital Capacity)
- FEV₁/FVC ratio
This is one of the most frequently tested graphs in MBBS and postgraduate entrance exams.
Basic Concept
During spirometry, the person:
Step 1
Takes the deepest possible breath
(Maximum Inspiration)
↓
Step 2
Immediately blows out
as hard and as fast as possible
until no more air can be expired.
The machine records:
- How much air is exhaled.
- How fast it is exhaled.
Important Definitions
1. FVC (Forced Vital Capacity)
Definition
The total volume of air that can be forcefully exhaled after taking the deepest possible breath.
Easy Concept
Think of a balloon.
Fill it completely.
Now squeeze until no more air comes out.
The total air leaving the balloon is the FVC.
2. FEV₁ (Forced Expiratory Volume in One Second)
Definition
The amount of air exhaled during the first second of the forced expiration.
Easy Concept
Imagine timing the balloon for exactly one second after squeezing it.
The amount of air leaving in that first second is FEV₁.
3. FEV₁/FVC Ratio
Definition
The percentage of the total FVC that is expired during the first second.
FormulaFEV1/FVC×100
It indicates how rapidly the lungs can be emptied.
PART A — Normal Person
Step 1: Maximum Inspiration
The curve reaches its highest point.
This represents:
Maximum lung filling.
Step 2: Forced Expiration Begins
Immediately after maximum inspiration,
The person exhales forcefully.
The curve falls rapidly.
Why does it fall so quickly?
Normal lungs have:
- Open airways.
- Low airway resistance.
- Strong elastic recoil.
Therefore,
Air leaves rapidly.
FEV₁ in Normal Person
During the first second,
About 80% of the vital capacity is exhaled.
Therefore,
FEV₁/FVC ≈ 80%
This is the normal value shown in the graph.
FVC in Normal Person
The person continues exhaling until:
Almost no more air can be expelled.
This total expired volume is:
Forced Vital Capacity (FVC).
Key Point
Normal lungs empty quickly.
Most of the air comes out during the first second.
PART B — Airway Obstruction
This graph represents diseases such as:
- Asthma
- COPD
- Chronic bronchitis
- Emphysema
What happens?
After maximum inspiration,
Expiration begins,
but the curve falls much more slowly.
Why?
Because the airways are narrowed due to:
- Bronchospasm
- Mucus
- Airway inflammation
- Loss of elastic recoil (especially in emphysema)
Air cannot escape rapidly.
FEV₁ in Airway Obstruction
The amount exhaled during the first second is greatly reduced.
Much less air leaves during the first second compared with normal lungs.
Why does FEV₁ decrease?
Because airway narrowing increases resistance.
The lungs empty slowly.
FVC in Airway Obstruction
The total FVC may be:
- Normal
- Slightly reduced
because eventually much of the air is expired,
but it takes much longer.
FEV₁/FVC Ratio
The graph shows:
Normal
FEV₁/FVC = 80%
↓
Airway Obstruction
FEV₁/FVC = 47%
This large reduction is the hallmark of obstructive lung disease.
Easy Concept
Imagine two balloons.
Balloon 1 (Normal)
Open with a wide opening.
Air rushes out immediately.
Most air leaves within one second.
Balloon 2 (Narrow Opening)
The opening is partly blocked.
Air escapes very slowly.
Even after one second,
Most air is still inside.
This is exactly what happens in asthma and COPD.omparison of Normal and Airway Obstruction
| Feature | Normal | Airway Obstruction |
|---|---|---|
| Airway diameter | Normal | Narrow |
| Airway resistance | Low | High |
| FEV₁ | Normal | Markedly decreased |
| FVC | Normal | Normal or slightly decreased |
| FEV₁/FVC ratio | About 80% | About 47% |
| Time to empty lungs | Short | Long |
Clinical Importance
Normal Spirometry
- FEV₁ = Normal
- FVC = Normal
- FEV₁/FVC ≈ 80%
Asthma
- Bronchospasm
- FEV₁ decreases
- FEV₁/FVC decreases
- Improves after bronchodilator
COPD
- Permanent airway narrowing
- Loss of elastic recoil
- Markedly decreased FEV₁
- Low FEV₁/FVC ratio
- Expiration is prolonged
How to Diagnose Obstructive Lung Disease from This Graph
Look at the FEV₁/FVC ratio.
If the ratio is:
- ≈80% → Normal
- <70% → Obstructive lung disease
- The lower the ratio, the more severe the obstruction.
Quick Memory Table
| Parameter | Normal | Obstructive Disease |
|---|---|---|
| FEV₁ | Normal | ↓↓↓ Markedly decreased |
| FVC | Normal | Normal or ↓ Slightly |
| FEV₁/FVC | ~80% | <70% (47% in this graph) |
| Expiration | Fast | Slow and prolonged |
Easy Memory Trick
Normal = “Fast Emptying”
- Wide airways
- Most air leaves in the first second
- FEV₁/FVC ≈ 80%
Obstruction = “Slow Emptying”
- Narrow airways
- Air leaves slowly
- FEV₁↓↓↓
- FEV₁/FVC↓↓↓
Key Concept
The Forced Vital Capacity (FVC) maneuver evaluates how quickly and completely the lungs can be emptied after a maximum inspiration. FVC is the total volume of air exhaled forcefully after full inspiration, whereas FEV₁ is the volume exhaled during the first second. In normal lungs, open airways and strong elastic recoil allow rapid emptying, so about 80% of the FVC is exhaled in the first second (FEV₁/FVC ≈ 80%). In obstructive lung diseases such as asthma and COPD, narrowed airways and increased resistance markedly reduce FEV₁, while FVC is often normal or only slightly reduced because most of the air is eventually exhaled but over a longer period. Consequently, the FEV₁/FVC ratio falls significantly (47% in this figure), making it the most important spirometric indicator of airway obstruction. SELF LEARNING SERIES BY DR SHEEN
MADE BY SELF LEARNING CEO AND FOUNDER DR SHEEN
