


- Transport of carbon dioxide (CO₂) by the blood is easier than oxygen (O₂) transport.
- Even under abnormal conditions, blood can transport much larger amounts of CO₂ than O₂.
- The amount of CO₂ in the blood is closely related to the acid-base balance of the body fluids.
- Under normal resting conditions, about 4 mL of CO₂ is transported from the tissues to the lungs by every 100 mL of blood.
CHEMICAL FORMS IN WHICH CO₂ IS TRANSPORTED
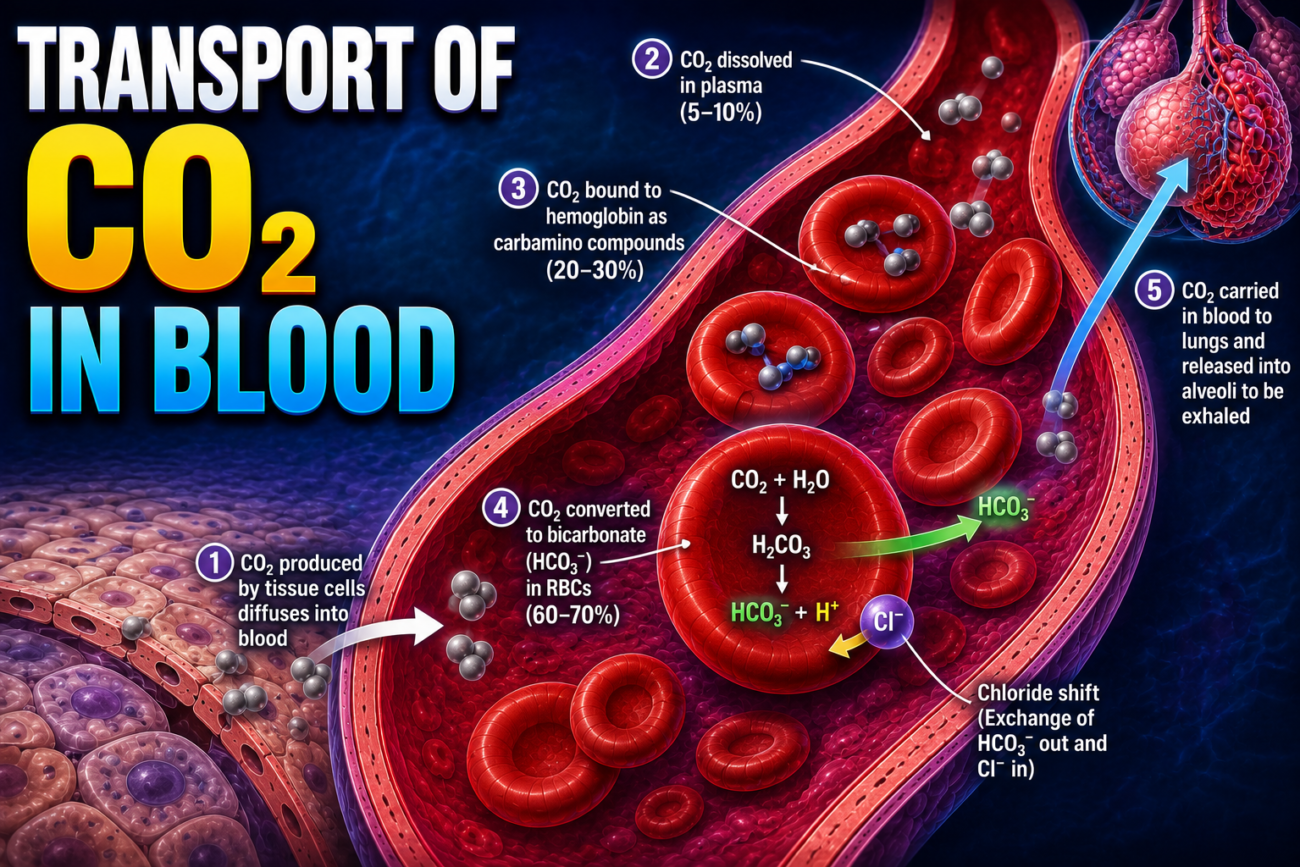
- CO₂ is produced inside the tissue cells.
- It first diffuses out of the cells in the dissolved molecular form (CO₂).
- After entering the tissue capillaries, CO₂ undergoes very rapid physical and chemical reactions.
- These reactions are essential for transporting CO₂ in the blood.
- Fig. 41.13 illustrates these reactions.
Fig. 41.13
- CO₂ diffuses from tissue cells into the blood.
- Inside the blood, CO₂ undergoes rapid reactions that allow it to be transported efficiently.
KEY CONCEPT
- CO₂ transport is easier than O₂ transport because blood can carry much larger amounts of CO₂. Under normal conditions, about 4 mL of CO₂ is transported by every 100 mL of blood, mainly after undergoing rapid chemical reactions inside the blood.
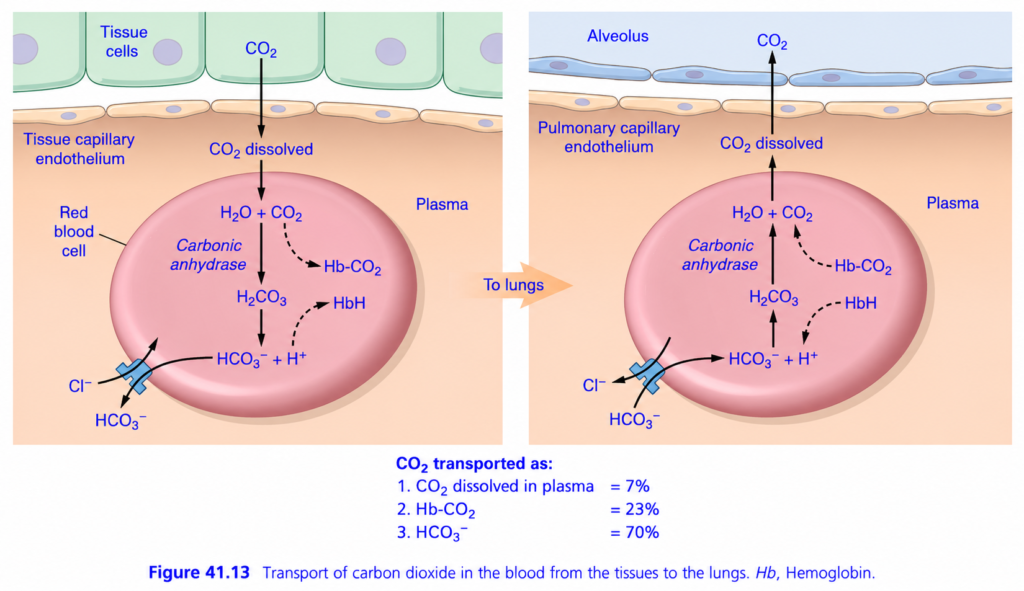
Transport of Carbon Dioxide (CO₂) in Blood (Guyton Fig. 41.13) superfast
🎯 One-Line Concept
Body cells produce CO₂ → Blood collects it → Blood carries it to the lungs → Lungs remove it by exhalation.
Think of CO₂ as the “waste product” of the body, just like garbage produced in a city. Blood acts as the garbage collection truck, carrying CO₂ from tissues to the lungs for disposal.
The Complete Story in 4 Simple Steps
Body Cells
      ↓
CO₂ enters Blood
      ↓
Blood transports CO₂
      ↓
Lungs remove CO₂
PART 1 – What Happens in the Tissues? (Left Side of Figure)
This is where CO₂ is loaded into the blood.
Step 1: Tissue Cells Produce CO₂
Every cell continuously makes energy (ATP).
During ATP production,
➡ CO₂ is produced as a waste product.
Cell
↓
ATP produced
↓
CO₂ produced
Since cells have the highest CO₂ pressure,
CO₂ diffuses into the blood.
Step 2: CO₂ Enters the Red Blood Cell (RBC)
CO₂ first dissolves in plasma and then quickly enters the RBC.
Cell
↓
Plasma
↓
Red Blood Cell
Inside the RBC, CO₂ has three possible pathways.
Pathway 1 — CO₂ Dissolved in Plasma (7%)
This is the simplest pathway.
Some CO₂ simply remains dissolved in the plasma.
Amount
≈ 7%
CO₂
↓
Plasma
No chemical reaction occurs.
Think of sugar dissolving in water.
Pathway 2 — CO₂ Binds to Hemoglobin (23%)
Some CO₂ attaches directly to hemoglobin.
CO₂
+
Hemoglobin
↓
Hb–CO₂
This compound is called
Carbaminohemoglobin (Hb–CO₂)
Amount transported
≈23%
This is different from oxygen binding because CO₂ binds mainly to the globin (protein) part of hemoglobin, not to the iron (heme) portion.
Pathway 3 — CO₂ Converted into Bicarbonate (70%) ⭐ (Most Important)
This is the major pathway.
About 70% of CO₂ travels this way.
Step A
CO₂ combines with water inside RBC.
CO₂ + H₂OThis reaction is very slow on its own.
Step B
The enzyme Carbonic Anhydrase speeds it up dramatically.
CO₂ + H₂O
      │
Carbonic Anhydrase
      ↓
H₂CO₃
Carbonic anhydrase is present in RBCs, making this reaction extremely fast.Step C
Carbonic acid (H₂CO₃) is unstable.
It immediately breaks into
H₂CO₃
↓
HCO₃⁻ + H⁺
Produces
- Bicarbonate ion (HCO₃⁻)
- Hydrogen ion (H⁺)
Step D
Hydrogen ions are buffered.
Hemoglobin acts like a sponge.
Hb + H⁺
↓
HHb
Hemoglobin prevents a large fall in blood pH.
Step E — Chloride Shift
Large amounts of bicarbonate accumulate inside RBC.
To maintain electrical neutrality,
Bicarbonate leaves the RBC.
At the same time,
Chloride ions (Cl⁻) enter.
HCO₃⁻
Moves Out

Cl⁻
Moves In
This exchange is called the
Chloride Shift (Hamburger Phenomenon)
Easy Memory
“Bicarbonate OUT → Chloride IN.”
Blood Now Travels to the Lungs
The blood carrying CO₂ reaches the lungs.
Everything now happens in reverse.
PART 2 – What Happens in the Lungs? (Right Side of Figure)
This is where CO₂ is unloaded from the blood.
Step 1
Bicarbonate returns into the RBC.
HCO₃⁻
Moves In
To balance the charge,
Chloride leaves.
Cl⁻
Moves Out
This is called the
Reverse Chloride Shift
Easy Memory
“Bicarbonate IN → Chloride OUT.”
Step 2
Hydrogen combines with bicarbonate.
H⁺ + HCO₃⁻
↓
H₂CO₃
Step 3
Carbonic anhydrase converts carbonic acid back.
H₂CO₃
↓
CO₂ + H₂O
Step 4
CO₂ leaves the blood.
Blood
↓
Alveolus
↓
Expired Air
You breathe it out.
What Happens to Hb–CO₂?
When blood reaches the lungs,
CO₂ separates from hemoglobin.
Hb–CO₂
↓
Hb + CO₂
CO₂ then diffuses into the alveoli and is exhaled.
Three Forms of CO₂ Transport (Most Important Exam Table)
| Form of CO₂ Transport | Percentage | Easy Concept |
|---|---|---|
| Dissolved in plasma | 7% | CO₂ simply dissolves in plasma. |
| Bound to hemoglobin (Carbaminohemoglobin) | 23% | CO₂ binds to the globin part of hemoglobin. |
| As bicarbonate (HCO₃⁻) | 70% | Major transport form after conversion inside RBC. |
⭐ Remember: 70 → 23 → 7
- 70% = Bicarbonate (Most Important)
- 23% = Carbaminohemoglobin
- 7% = Dissolved in Plasma
Complete Flow Chart
BODY CELLS
     │
Produce CO₂
     │
     ▼
CO₂ enters Blood
     │
     ▼
Red Blood Cell
     │
     ├──► 7% Dissolved in Plasma
     │
     ├──► 23% Hb–CO₂
     │
     └──► 70%
            CO₂ + H₂O
                 │
       Carbonic Anhydrase
                 │
             H₂CO₃
                 │
           HCO₃⁻ + H⁺
                 │
     HCO₃⁻ leaves RBC
     Cl⁻ enters RBC
     (Chloride Shift)
                 │
        Blood reaches Lungs
                 │
     Reverse Chloride Shift
                 │
     HCO₃⁻ + H⁺ → H₂CO₃
                 │
     Carbonic Anhydrase
                 │
          CO₂ + H₂O
                 │
          CO₂ diffuses into alveoli
                 │
             CO₂ is exhaled
Everyday Analogy
Imagine a city’s garbage disposal system:
- 🏭 Body cells = Factories producing garbage (CO₂).
- 🚛 Blood = Garbage truck collecting the waste.
- 📦 Bicarbonate (HCO₃⁻) = The main container carrying most of the garbage (70%).
- 🏢 Lungs = Recycling center where the garbage is unloaded.
- 🌬️ Breathing out = Throwing the garbage away.
MBBS High-Yield Points
- ✅ CO₂ diffuses from tissue cells → blood because tissue cells have a higher PCO₂.
- ✅ Carbonic anhydrase inside RBC catalyzes the rapid conversion between CO₂ and carbonic acid.
- ✅ Hemoglobin buffers H⁺, helping maintain blood pH.
- ✅ Chloride shift: HCO₃⁻ out, Cl⁻ in (tissues).
- ✅ Reverse chloride shift: HCO₃⁻ in, Cl⁻ out (lungs).
- ✅ 70% of CO₂ is transported as bicarbonate (HCO₃⁻), making it the principal transport form.
🌟 Super Memory Summary
TISSUES (Loading CO₂)
Cells → Blood
CO₂ + H₂O
   │
Carbonic Anhydrase
   │
H₂CO₃
   │
HCO₃⁻ + H⁺
   │
HCO₃⁻ OUT
Cl⁻ IN
──────────────► Blood to Lungs
──────────────►
LUNGS (Unloading CO₂)
HCO₃⁻ IN
Cl⁻ OUT
   │
H₂CO₃
   │
Carbonic Anhydrase
   │
CO₂ + H₂O
   │
CO₂ → Alveoli → Exhaled
💡 Golden Rule
Most CO₂ (70%) is transported as bicarbonate (HCO₃⁻), formed inside red blood cells by the enzyme carbonic anhydrase. The chloride shift allows efficient bicarbonate transport in tissues, and the reverse chloride shift in the lungs enables CO₂ to be regenerated and exhaled.
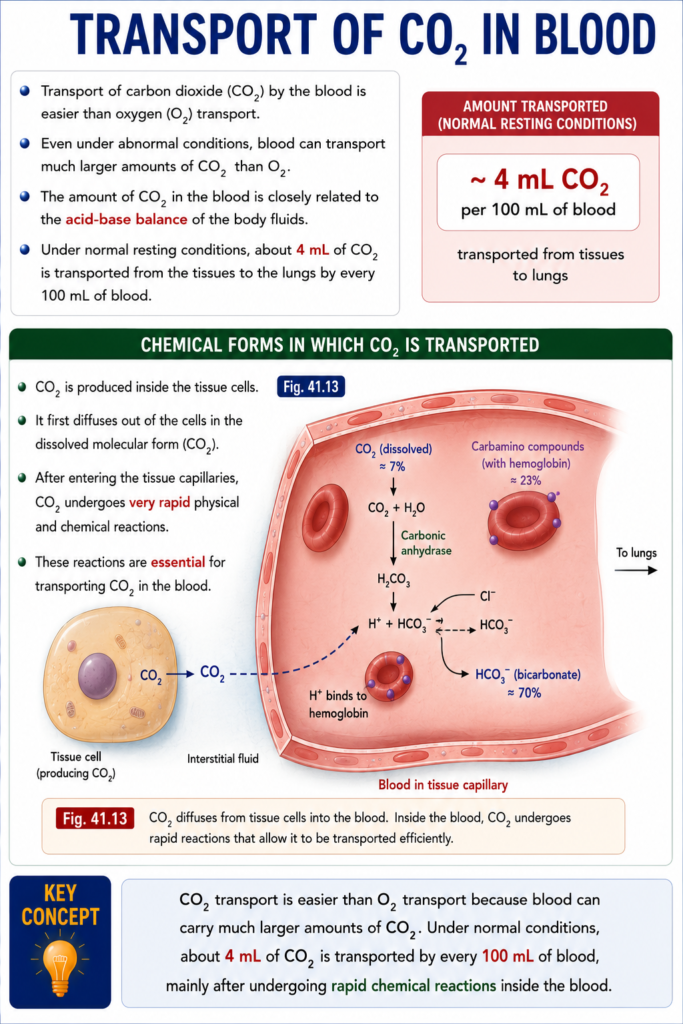
Transport of CO₂ in a Dissolved State
- A small amount of carbon dioxide (CO₂) is transported dissolved directly in the blood plasma.
- The PCO₂ of venous blood is about 45 mm Hg.
- The PCO₂ of arterial blood is about 40 mm Hg.
- At a PCO₂ of 45 mm Hg, about 2.7 mL of CO₂ is dissolved in every 100 mL of blood.
- At a PCO₂ of 40 mm Hg, about 2.4 mL of CO₂ is dissolved in every 100 mL of blood.
Easy Calculation
- Dissolved CO₂ in venous blood = 2.7 mL/100 mL
- Dissolved CO₂ in arterial blood = 2.4 mL/100 mL
CO₂ transported in dissolved form =
2.7 − 2.4 = 0.3 mL CO₂/100 mL blood
- Therefore, only about 0.3 mL of CO₂ is transported in the dissolved state by every 100 mL of blood.
- This represents about 7% of the total CO₂ normally transported.
Easy Concept
Imagine CO₂ travels in the blood by different methods.
One method is simply floating freely in the plasma.
Venous blood (from tissues):
Dissolved CO₂ = 2.7 mL↓
Arterial blood (after lungs):
Dissolved CO₂ = 2.4 mL↓
Difference delivered to the lungs:
2.7 − 2.4 = 0.3 mL CO₂- This 0.3 mL is the amount of CO₂ transported only in the dissolved form.
KEY CONCEPT
- Only a small fraction (about 7%) of carbon dioxide is transported dissolved in the blood. Under normal conditions, venous blood contains 2.7 mL CO₂/100 mL and arterial blood contains 2.4 mL CO₂/100 mL, so about 0.3 mL CO₂/100 mL is transported in the dissolved state.
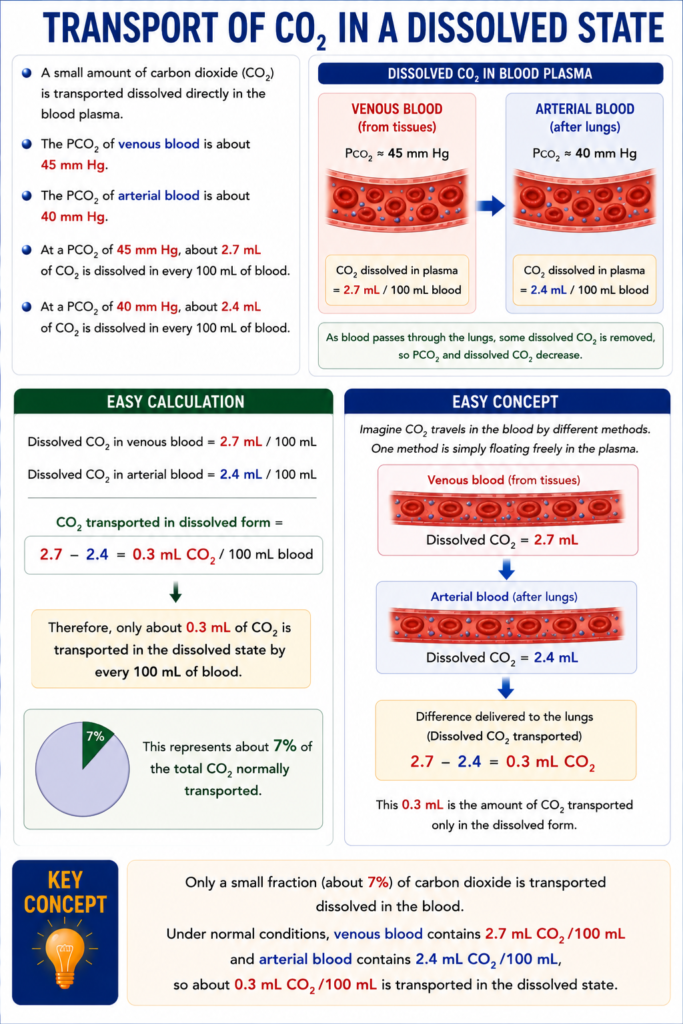
Transport of CO₂ in the Form of Bicarbonate Ion
- Dissolved carbon dioxide (CO₂) reacts with water (H₂O) to form carbonic acid (H₂CO₃).
- This reaction is very slow if it occurs by itself.
- Inside red blood cells (RBCs), an enzyme called carbonic anhydrase is present.
- Carbonic anhydrase catalyzes the reaction between CO₂ and water.
- This enzyme increases the reaction speed by about 5000 times.
- Because of this, the reaction occurs very rapidly inside RBCs.
- The reaction reaches almost complete equilibrium within a fraction of a second.
- This rapid reaction allows large amounts of CO₂ to react with the water inside red blood cells before the blood leaves the tissue capillaries.
Easy Concept
Think of carbonic anhydrase as a super-fast worker inside the red blood cell.
Without the worker:
CO₂ + H₂O

🐢 Very slow reaction
With carbonic anhydrase:
CO₂ + H₂O
      ↓
Carbonic Anhydrase ⚡
      ↓
H₂CO₃ (Carbonic acid)

🚀 Very fast reaction- The enzyme acts like a speed booster, allowing CO₂ to be converted almost instantly inside RBCs.
Easy Memory Trick
Carbonic Anhydrase

= CO₂ Speed Enzyme
Remember:
- Without enzyme → Slow
- With enzyme → 5000× Faster
KEY CONCEPT
- Inside red blood cells, carbonic anhydrase rapidly converts CO₂ and water into carbonic acid. This enzyme speeds up the reaction about 5000-fold, allowing large amounts of CO₂ to be transported efficiently before the blood leaves the tissue capillaries.
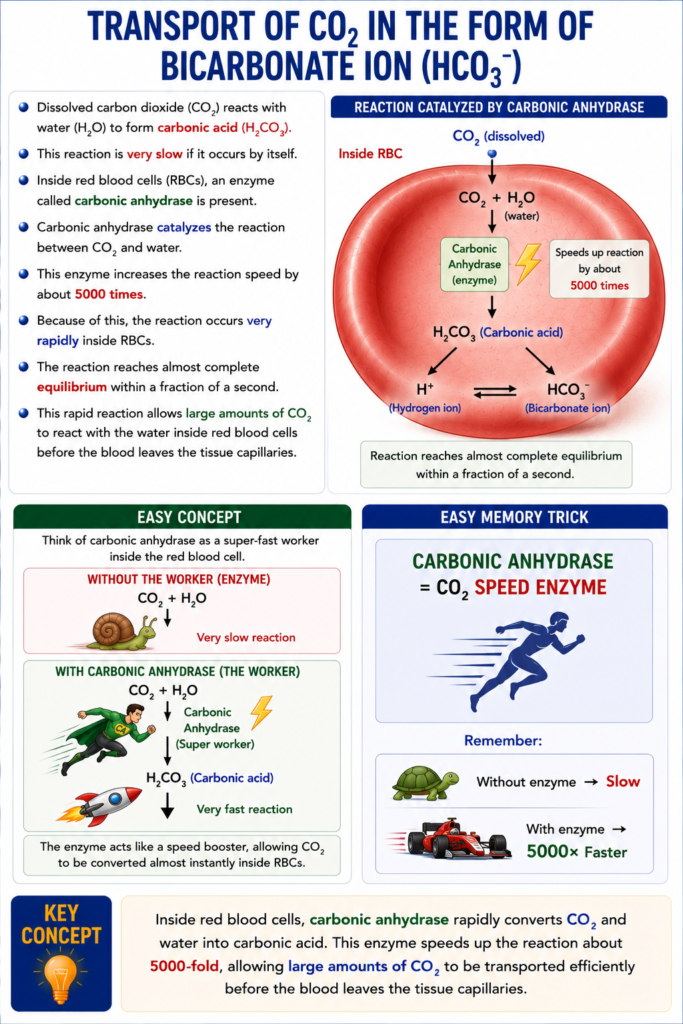
Dissociation of Carbonic Acid Into Bicarbonate and Hydrogen Ions
- Inside the red blood cells (RBCs), carbonic acid (H₂CO₃) quickly dissociates into:
- Hydrogen ions (H⁺)
- Bicarbonate ions (HCO₃⁻)
- Most H⁺ ions combine with hemoglobin.
- Hemoglobin acts as a powerful acid-base buffer.
- Many HCO₃⁻ ions diffuse from the RBCs into the plasma.
- At the same time, chloride ions (Cl⁻) move from the plasma into the RBCs.
- This exchange occurs through a bicarbonate-chloride carrier protein in the RBC membrane.
- The carrier rapidly moves:
- HCO₃⁻ out of the RBC
- Cl⁻ into the RBC
- As a result, venous RBCs contain more chloride than arterial RBCs.
- This process is called the chloride shift.
- The reversible reaction of CO₂ with water inside RBCs, catalyzed by carbonic anhydrase, transports about 70% of the total CO₂ from the tissues to the lungs.
- Therefore, bicarbonate transport is the most important form of CO₂ transport.
- If carbonic anhydrase is inhibited (e.g., by acetazolamide):
- CO₂ transport becomes markedly reduced.
- Tissue PCO₂ may increase from the normal 45 mm Hg to about 80 mm Hg.
Fig. 41.13
- CO₂ transport occurs in three forms:
- Bicarbonate (HCO₃⁻) = 70%
- Carbaminohemoglobin (Hb–CO₂) = 23%
- Dissolved CO₂ = 7%
- Inside the RBC:
- CO₂ + H₂O → H₂CO₃
- H₂CO₃ → H⁺ + HCO₃⁻
- H⁺ binds to hemoglobin.
- HCO₃⁻ leaves the RBC.
- Cl⁻ enters the RBC (chloride shift).
Easy Concept
Tissue Cell
     │
     ▼
CO₂ enters RBC
     │
     ▼
CO₂ + H₂O
     │
Carbonic anhydrase
     ▼
H₂CO₃
     ▼
H⁺ + HCO₃⁻- H⁺ → Stays inside RBC (binds to hemoglobin)
- HCO₃⁻ → Moves into plasma
- Cl⁻ → Moves into RBC (chloride shift)
Easy Memory Trick
Remember the sequence:
CO₂ → H₂CO₃ → H⁺ + HCO₃⁻
Then:
- H⁺ → Hemoglobin
- HCO₃⁻ → Plasma
- Cl⁻ → RBC
KEY CONCEPT
- About 70% of CO₂ is transported as bicarbonate (HCO₃⁻). Inside red blood cells, carbonic anhydrase rapidly converts CO₂ into carbonic acid, which dissociates into H⁺ and HCO₃⁻. H⁺ is buffered by hemoglobin, while HCO₃⁻ enters the plasma in exchange for Cl⁻ (chloride shift), making bicarbonate the major form of CO₂ transport.
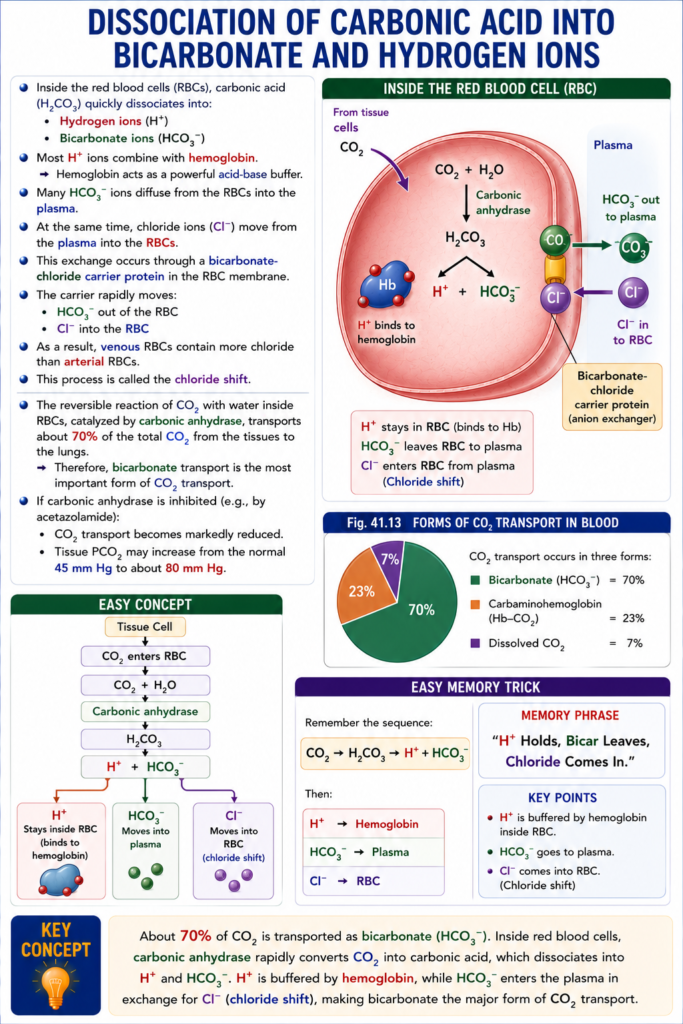
Transport of CO₂ in Combination With Hemoglobin and Plasma Proteins—Carbaminohemoglobin
- In addition to reacting with water, CO₂ also reacts directly with the amine groups of hemoglobin.
- This reaction forms carbaminohemoglobin (Hb–CO₂).
- The combination of CO₂ and hemoglobin is reversible.
- The bond is loose, so CO₂ is easily released in the alveoli, where alveolar PCO₂ is lower than pulmonary capillary PCO₂.
- A small amount of CO₂ also combines with plasma proteins in the tissue capillaries.
- This form of transport is less important because:
- Plasma proteins are only about one-fourth as abundant as hemoglobin.
- Transport of CO₂ as carbaminohemoglobin and with plasma proteins accounts for about 30% of the total CO₂ transport.
- This is approximately 1.5 mL of CO₂ per 100 mL of blood.
- However, this reaction is slower than the reaction of CO₂ with water inside red blood cells.
- Therefore, under normal conditions, the carbamino mechanism probably transports no more than about 20% of the total CO₂.
Easy Calculation
- Total CO₂ transported = 4 mL/100 mL blood
- CO₂ transported as carbamino compounds ≈ 30%
Calculation:
30% of 4 mL = 1.2 mL (approximately 1.5 mL as stated in the text)
Fig. 41.13
- CO₂ is transported in three forms:
- Bicarbonate (HCO₃⁻) = 70%
- Carbaminohemoglobin (Hb–CO₂) = 23%
- Dissolved CO₂ = 7%
Easy Concept
Think of hemoglobin as a bus.
It can carry:
- O₂ passengers
- CO₂ passengers
For CO₂:
CO₂
   ↓
Hemoglobin
   ↓
Hb–CO₂ (Carbaminohemoglobin)
When the bus reaches the lungs:
Hb–CO₂
   ↓
CO₂ released into alveoli
Because the bond is weak (loose), CO₂ gets off the bus easily.
Easy Memory Trick
CO₂ has three ways to travel in blood:
- HCO₃⁻ (Bicarbonate) → 70% ⭐ Most important
- Hb–CO₂ (Carbaminohemoglobin) → About 20–30%
- Dissolved CO₂ → 7%
KEY CONCEPT
- CO₂ combines reversibly with hemoglobin to form carbaminohemoglobin, allowing easy release in the lungs. A small amount also binds to plasma proteins. This mechanism transports about 20–30% of total CO₂, while bicarbonate remains the major form of CO₂ transport.
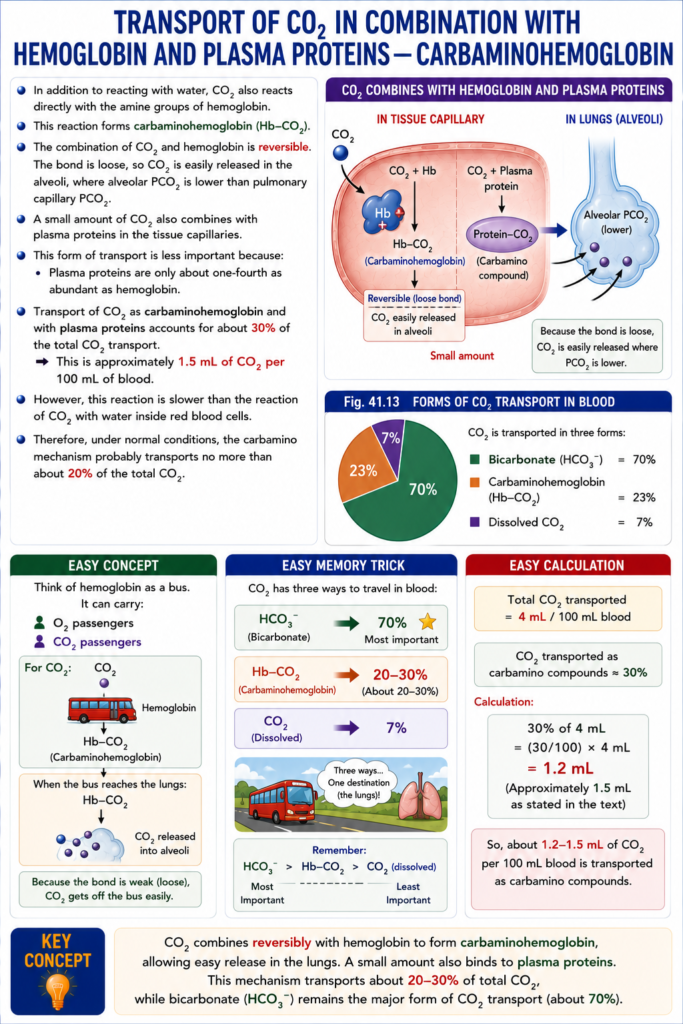
CARBON DIOXIDE DISSOCIATION CURVE
- Fig. 41.14 shows the carbon dioxide (CO₂) dissociation curve.
- The curve shows the relationship between:
- Total CO₂ in the blood (all forms)
- Partial pressure of CO₂ (PCO₂)
- Under normal conditions:
- Arterial blood PCO₂ = 40 mm Hg
- Venous blood PCO₂ = 45 mm Hg
- Therefore, blood PCO₂ normally changes only within a small range (40–45 mm Hg).
- The total CO₂ content of blood is about 50 volume percent (50 mL CO₂ per 100 mL blood).
- During normal circulation, only about 4 volume percent of this CO₂ is exchanged between the tissues and the lungs.
Easy Concept of the CO₂ Exchange
In the tissues:
- Cells produce CO₂.
- Blood picks up CO₂.
- Total CO₂ increases:
48 vol%
     ↓
52 vol%
In the lungs:
- Blood releases CO₂ into the alveoli.
- Total CO₂ decreases:
52 vol%
     ↓
48 vol%
Easy Calculation
Total CO₂ entering tissues = 48 vol%
Total CO₂ leaving tissues = 52 vol%
CO₂ exchanged =
52 − 48 = 4 vol%
Thus,
- About 4 mL of CO₂ is transported by every 100 mL of blood.
Fig. 41.14
- Arterial blood:
- PCO₂ = 40 mm Hg
- Total CO₂ = 48 vol%
- Venous blood:
- PCO₂ = 45 mm Hg
- Total CO₂ = 52 vol%
- Difference = 4 vol%
- This is the amount of CO₂ transported from the tissues to the lungs.
Easy Memory Trick
Tissues

48 → 52
(Blood gains CO₂)

↓

Lungs

52 → 48
(Blood loses CO₂)
KEY CONCEPT
- The CO₂ dissociation curve shows that as blood PCO₂ increases, total blood CO₂ also increases. Normally, arterial blood contains about 48 vol% CO₂ (PCO₂ = 40 mm Hg) and venous blood contains about 52 vol% CO₂ (PCO₂ = 45 mm Hg), so about 4 vol% of CO₂ is exchanged between the tissues and the lungs.
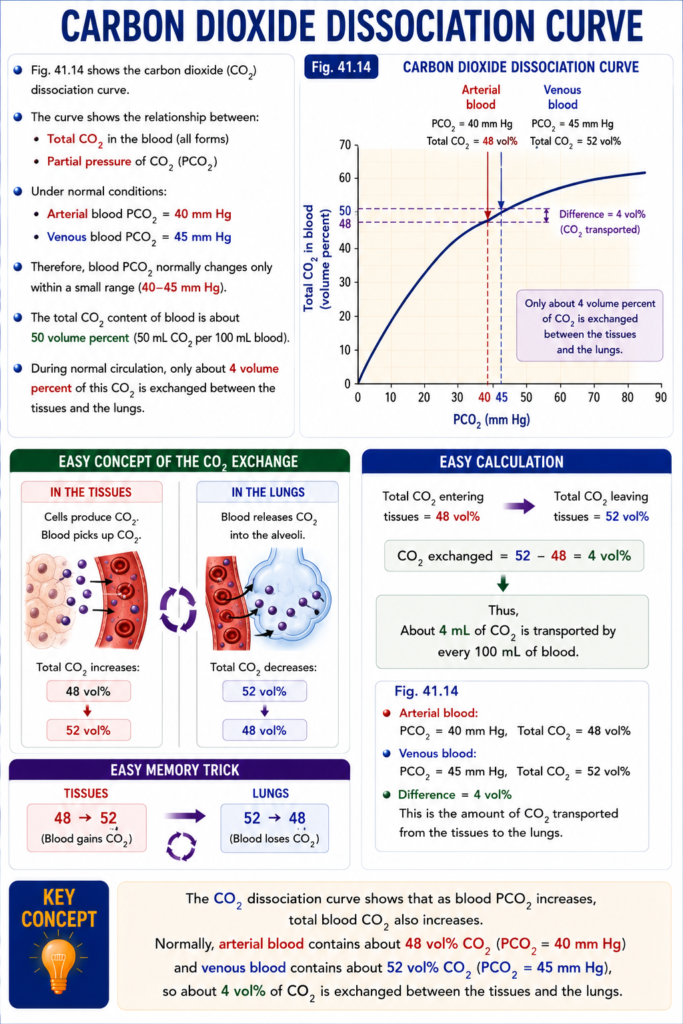
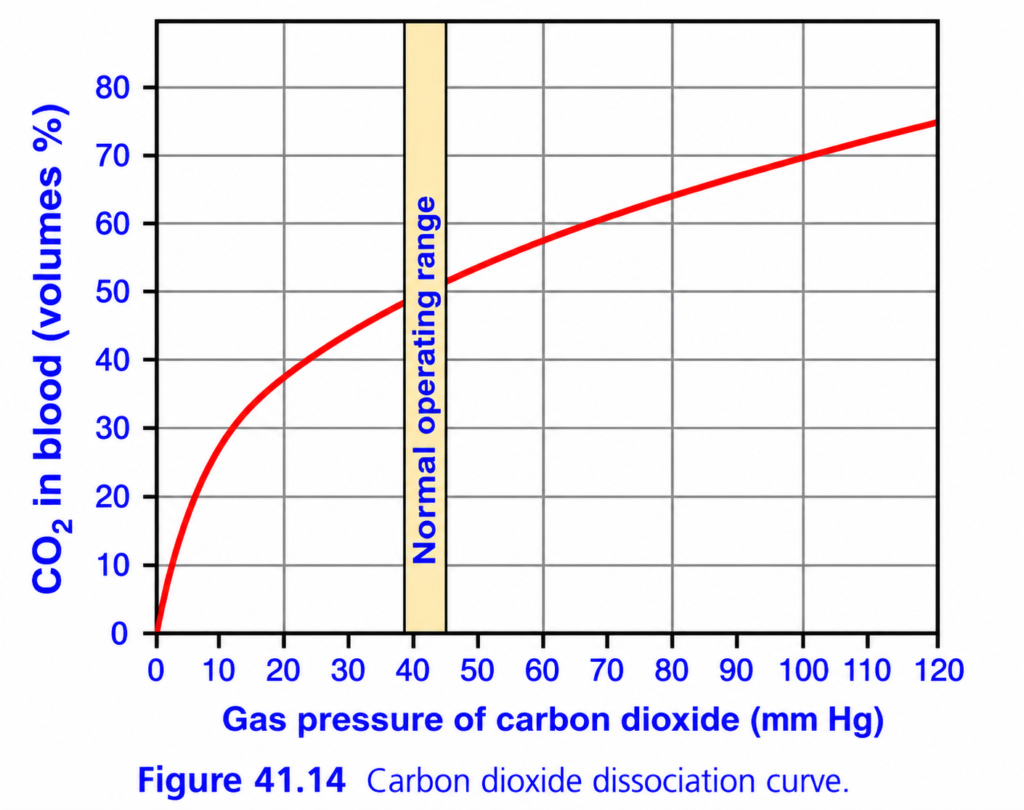
This is Figure 41.14 from Guyton Physiology, and it explains how the amount of carbon dioxide (CO₂) carried in blood changes as PCO₂ changes.
This graph is called the:
⭐ Carbon Dioxide Dissociation Curve
It is the CO₂ equivalent of the oxygen-hemoglobin dissociation curve, but it is much simpler.
Unlike oxygen, most CO₂ is NOT carried by hemoglobin. It is mainly carried as bicarbonate (HCO₃⁻).
🎯 One-Line Concept
As blood PCO₂ increases, the amount of CO₂ carried in blood increases. As blood PCO₂ decreases, the amount of CO₂ carried decreases.
Simply,
- High PCO₂ → Blood carries more CO₂
- Low PCO₂ → Blood carries less CO₂
First Understand What the Graph Represents
Imagine blood moving between:
Body Tissues
      ↓
CO₂ enters blood
      ↓
Venous Blood
      ↓
Lungs
      ↓
CO₂ leaves blood
      ↓
Arterial Blood
This graph shows
How much CO₂ blood contains at different PCO₂ values.
Step 1: Understand the Axes
X-Axis (Horizontal)
Gas Pressure of Carbon Dioxide (PCO₂)
This is
Partial pressure of CO₂ in blood.
Starts from
0 mmHg
↓
120 mmHg
Easy Memory
Move right
↓
More CO₂ pressure
Move left
↓
Less CO₂ pressure
Y-Axis (Vertical)
CO₂ in Blood (Volumes %)
This means
How many milliliters of CO₂ are present in every 100 mL of blood.
Example
50 Vol%
=
50 mL CO₂
per
100 mL blood
Understanding the Red Curve
Notice
The curve rises continuously.
Unlike the oxygen curve,
it is almost a straight line over the normal physiological range.
Why Does It Rise?
As PCO₂ increases,
more CO₂ enters the blood.
Therefore,
blood stores more CO₂.
Simple.
Why Isn’t It S-Shaped Like Oxygen?
Because CO₂ is transported in three different forms, not mainly by hemoglobin.
Most CO₂ is carried as:
- ~70% as bicarbonate (HCO₃⁻)
- ~20–25% bound to proteins/hemoglobin (carbamino compounds)
- ~5–10% dissolved in plasma
Because of these multiple transport mechanisms, CO₂ content changes more smoothly with PCO₂.
The Yellow Shaded Area
⭐ Normal Operating Range
This is one of the most important parts of the graph.
The yellow band lies around
PCO₂ = 40–45 mmHg
These are the normal physiological values.
Left Side of Yellow Band
Arterial Blood
PCO₂
≈40 mmHg
Look at the graph.
CO₂ content
≈48 mL/100 mL blood
Why?
Blood has just passed through the lungs.
The lungs removed excess CO₂.
Therefore,
arterial blood contains less CO₂.
Right Side of Yellow Band
Venous Blood
PCO₂
≈45 mmHg
Now
Blood has returned from tissues.
The tissues produced CO₂.
Therefore,
venous blood contains more CO₂.
CO₂ content
≈52 mL/100 mL blood
What Does the Difference Mean?
Compare
| Blood | CO₂ Content |
|---|---|
| Arterial | ≈48 mL/100 mL |
| Venous | ≈52 mL/100 mL |
Difference
≈4 mL CO₂
Meaning
Every
100 mL blood
collects
about
4 mL of CO₂
while passing through tissues.
That CO₂ is later released in the lungs.
Why Does the Curve Become Less Steep at High PCO₂?
Look carefully.
At very high PCO₂,
the curve begins to flatten slightly.
Why?
Blood gradually approaches its capacity to store CO₂.
Additional CO₂ still enters,
but the increase becomes slower.
Compare Arterial and Venous Blood
| Blood | PCO₂ | CO₂ Content |
|---|---|---|
| Arterial | 40 mmHg | ≈48 mL/100 mL |
| Venous | 45 mmHg | ≈52 mL/100 mL |
This small increase in PCO₂ (only 5 mmHg) allows blood to transport about 4 mL of additional CO₂ per 100 mL blood.
Why Can Blood Carry So Much CO₂?
Unlike oxygen,
CO₂ is chemically converted inside red blood cells.
The major reaction is:
CO₂ + H₂O
      ↓
H₂CO₃
      ↓
H⁺ + HCO₃⁻
This reaction is catalyzed by carbonic anhydrase.
Because CO₂ is converted into bicarbonate,
blood can transport large amounts of CO₂ without a huge rise in PCO₂.
Easy Analogy
Imagine
A warehouse.
Oxygen
Must stay inside boxes (hemoglobin).
Once boxes are full,
very little more oxygen can be stored.
Carbon Dioxide
Can be stored in
three different warehouses:
🏠 Dissolved in plasma
🏠 As bicarbonate
🏠 Bound to proteins and hemoglobin
Therefore,
blood has much greater flexibility in carrying CO₂.
Clinical Correlation
1. Exercise
Muscles produce much more CO₂.
Venous PCO₂ rises.
Blood carries more CO₂ back to the lungs.
Ventilation also increases to remove it. Hypoventilation
Examples
- COPD
- Opioid overdose
- Neuromuscular weakness
CO₂ cannot be removed efficiently.
PCO₂ rises.
Blood CO₂ content increases.
This contributes to respiratory acidosis. Hyperventilation
Examples
- Anxiety
- Panic attack
Excess CO₂ is exhaled.
PCO₂ falls.
Blood CO₂ content decreases.
This contributes to respiratory alkalosis.
High-Yield MBBS Viva Points
Normal Values
| Parameter | Value |
|---|---|
| Normal arterial PCO₂ | 40 mmHg |
| Normal venous PCO₂ | 45 mmHg |
| Arterial CO₂ content | ≈48 mL/100 mL blood |
| Venous CO₂ content | ≈52 mL/100 mL blood |
| CO₂ added in tissues | ≈4 mL/100 mL blood |
Carbon Dioxide Transport Forms
| Form | Percentage |
|---|---|
| Bicarbonate (HCO₃⁻) | ≈70% |
| Carbamino compounds | ≈20–25% |
| Dissolved CO₂ | ≈5–10% |
Compare Oxygen and Carbon Dioxide Dissociation Curves
| Oxygen Curve | Carbon Dioxide Curve |
|---|---|
| S-shaped (sigmoid) | Nearly linear over the normal range |
| Mainly depends on hemoglobin binding | Depends largely on bicarbonate formation |
| Maximum oxygen content ≈20 mL/100 mL | Total CO₂ content ≈48–52 mL/100 mL in the normal range |
| Strong cooperative binding | No marked cooperative binding |
Super Easy Memory Story
Imagine a garbage truck.
🏭 Body tissues
Factories produce garbage (CO₂).
The garbage truck (blood) collects it.
By the time it leaves the tissues:
➡️ Venous blood
PCO₂ = 45 mmHg
CO₂ content ≈ 52 mL/100 mL
🫁 Lungs
The garbage truck unloads the garbage.
Now:
➡️ Arterial blood
PCO₂ = 40 mmHg
CO₂ content ≈ 48 mL/100 mL
The truck is now ready to collect more garbage from the tissues.
🎯 MBBS Golden Rule
Three Numbers You Must Remember
| Blood | PCO₂ | CO₂ Content |
|---|---|---|
| Arterial Blood | 40 mmHg | ≈48 mL/100 mL |
| Venous Blood | 45 mmHg | ≈52 mL/100 mL |
| Difference | 5 mmHg | ≈4 mL CO₂/100 mL blood |
Final Concept to Never Forget
The carbon dioxide dissociation curve shows that:
- Higher PCO₂ → Blood carries more CO₂.
- Lower PCO₂ → Blood carries less CO₂.
- In the normal operating range (40–45 mmHg), a small increase of only 5 mmHg in PCO₂ allows blood to carry about 4 mL more CO₂ per 100 mL blood, mainly because most CO₂ is transported as bicarbonate (HCO₃⁻) rather than simply being dissolved or bound to hemoglobin. This efficient transport system allows the body to remove the CO₂ continuously produced by tissue metabolism.
When Oxygen Binds With Hemoglobin, CO₂ Is Released (the Haldane Effect) to Increase CO₂ Transport
- When oxygen (O₂) binds to hemoglobin in the lungs, carbon dioxide (CO₂) is released from the blood.
- This is called the Haldane effect.
- The Haldane effect is more important for CO₂ transport than the Bohr effect is for O₂ transport.
- In the lungs:
- O₂ combines with hemoglobin.
- Hemoglobin becomes a stronger acid.
- This helps remove CO₂ from the blood in two ways:
- Less Carbaminohemoglobin Formation
- Acidic hemoglobin has less ability to bind CO₂.
- Therefore, CO₂ is released from carbaminohemoglobin.
- The released CO₂ diffuses into the alveoli.
- Conversion of Bicarbonate Back to CO₂
- Acidic hemoglobin releases H⁺ ions.
- H⁺ combines with bicarbonate (HCO₃⁻).
- This forms carbonic acid (H₂CO₃).
- Carbonic acid quickly breaks down into:
- Water (H₂O)
- CO₂
- The newly formed CO₂ diffuses into the alveoli and is exhaled.
Fig. 41.15
- The figure compares two CO₂ dissociation curves:
- PO₂ = 40 mm Hg (tissue capillaries)
- PO₂ = 100 mm Hg (lung capillaries)
- Point A (Tissues):
- PCO₂ = 45 mm Hg
- Total CO₂ = 52 vol%
- As blood reaches the lungs:
- PCO₂ decreases to 40 mm Hg
- PO₂ increases to 100 mm Hg
Without the Haldane Effect
- CO₂ would decrease:
52 vol% → 50 vol%
CO₂ released =
52 − 50 = 2 vol%
With the Haldane Effect
- The CO₂ dissociation curve shifts downward.
- CO₂ decreases:
52 vol% → 48 vol%
CO₂ released =
52 − 48 = 4 vol%
Easy Concept of the Calculation
Without Haldane Effect:
52 → 50

Only 2 vol% CO₂ released
With Haldane Effect:
52 → 48

4 vol% CO₂ released
Result:
- CO₂ released doubles
- 2 → 4 vol%
Easy Concept
Imagine hemoglobin is a bus.
In the Tissues
Bus carries CO₂ passengers.↓
In the Lungs
Now oxygen passengers enter the bus.
O₂ gets on the bus 🚍

↓

CO₂ passengers must get off.
So:
- O₂ enters
- CO₂ leaves
This is the Haldane effect.
Easy Memory Trick
Lungs

O₂ IN
↓

CO₂ OUT
Haldane = Oxygen Helps Remove CO₂
KEY CONCEPT
- The Haldane effect states that when oxygen binds to hemoglobin in the lungs, hemoglobin releases carbon dioxide more easily. This occurs by releasing CO₂ from carbaminohemoglobin and converting bicarbonate back into CO₂. As a result, the Haldane effect approximately doubles the amount of CO₂ released in the lungs and picked up in the tissues.
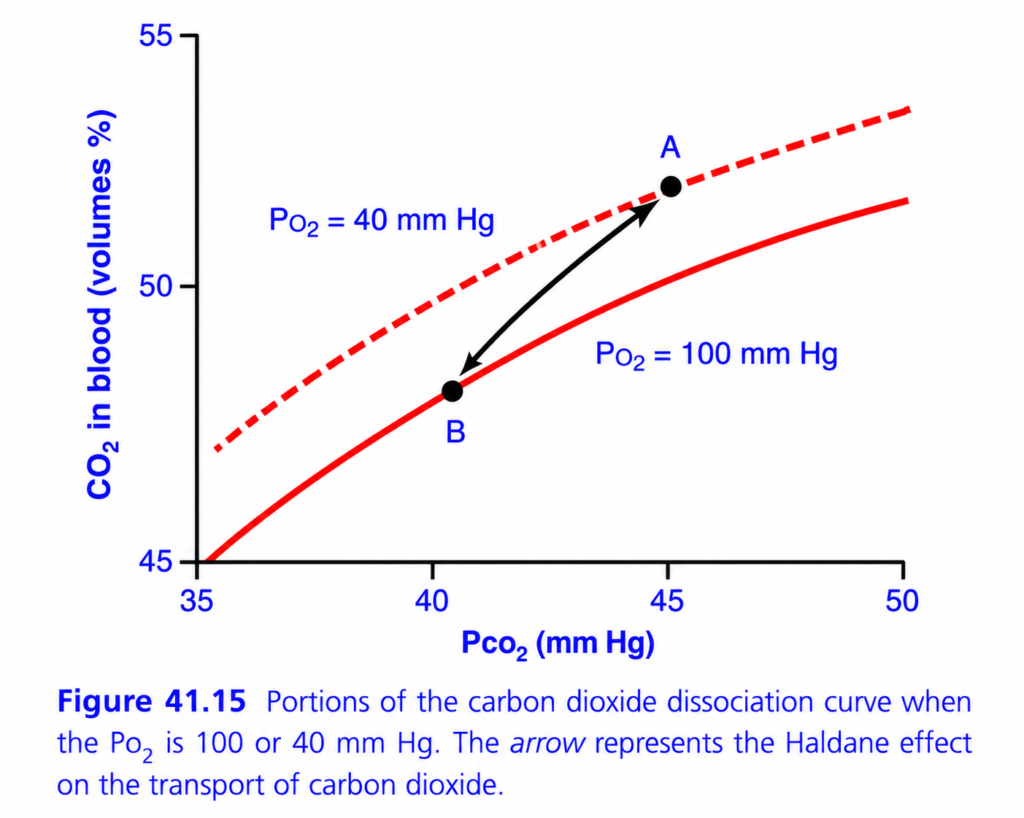
his is Figure 41.15 from Guyton Physiology, and it explains one of the most important concepts in CO₂ transport:
⭐ The Haldane Effect
This figure explains:
Why deoxygenated blood carries more CO₂ than oxygenated blood.
It is the opposite of the Bohr effect.
- Bohr Effect: CO₂ helps unload O₂.
- Haldane Effect: O₂ helps unload CO₂.
Both work together to maximize gas exchange.
🎯 One-Line Concept
When hemoglobin loses oxygen (in tissues), it can carry more CO₂. When hemoglobin gains oxygen (in lungs), it releases CO₂.
Simply,
Tissues:
↓ O₂ in Hb
→ ↑ CO₂ carrying

Lungs:
↑ O₂ in Hb
→ ↓ CO₂ carrying
This is the Haldane Effect.
Step 1: Understand the Axes
X-Axis (Horizontal)
PCO₂ (mmHg)
This shows the
Partial pressure of carbon dioxide in blood.
Starts from
35 mmHg
↓
50 mmHg
Easy Memory
Move right
↓
Higher CO₂ pressure
Y-Axis (Vertical)
CO₂ in Blood (Volumes %)
This shows
How much CO₂ is actually carried in every 100 mL of blood.
Example
50 Vol%
=
50 mL CO₂
per
100 mL blood
Why Are There Two Curves?
This is the key to understanding the graph.
Both curves represent the same PCO₂ values, but with different oxygen levels.
🔺 Upper Dashed Curve
PO₂ = 40 mmHg
This represents
Venous blood
coming from the tissues.
Characteristics:
- Low oxygen
- Deoxygenated hemoglobin
- High capacity to carry CO₂
Therefore,
the curve is
higher.
🔴 Lower Solid Curve
PO₂ = 100 mmHg
This represents
Arterial blood
leaving the lungs.
Characteristics:
- High oxygen
- Oxygenated hemoglobin
- Lower capacity to carry CO₂
Therefore,
the curve is
lower.
Why Is the Upper Curve Higher?
Suppose
PCO₂
=
45 mmHg.
Now compare
Both curves.
Upper Curve
PO₂
=
40 mmHg
Blood contains
more CO₂.
Lower Curve
PO₂
=
100 mmHg
Blood contains
less CO₂.
Why?
Because
deoxygenated hemoglobin binds CO₂ more readily than oxygenated hemoglobin.
This is the essence of the Haldane Effect.
Understanding Point A
Point A lies on the
upper dashed curve.
Conditions
PO₂
=
40 mmHg
PCO₂
=
45 mmHg
This represents
Venous blood returning from tissues.
What Has Happened?
Cells have produced
CO₂.
Hemoglobin has already released oxygen to the tissues.
Now
deoxygenated hemoglobin
binds more CO₂.
Therefore,
blood CO₂ content is high.
Understanding Point B
Point B lies on the
lower solid curve.
Conditions
PO₂
=
100 mmHg
PCO₂
=
40 mmHg
This represents
Arterial blood leaving the lungs.
What Has Happened?
Hemoglobin has picked up oxygen.
Once oxygen binds,
hemoglobin becomes less able to carry CO₂.
Therefore,
CO₂ is released into the alveoli and exhaled.
Blood CO₂ content falls.
Understanding the Arrow
The arrow is the
most important part of the graph.
It connects
Point A
↓
Point B.
What Does It Mean?
As blood passes through the lungs:
- Hemoglobin binds oxygen.
- Oxygenated hemoglobin loses its ability to carry CO₂.
- CO₂ is released from the blood.
- CO₂ diffuses into the alveoli.
- CO₂ is exhaled.
This entire process is called the
⭐ Haldane Effect
Why Does Oxygen Cause CO₂ Release?
There are two main mechanisms.
Mechanism 1: Less Carbaminohemoglobin Formation
CO₂ can bind directly to hemoglobin.
Hemoglobin + CO₂
        ↓
Carbaminohemoglobin
Deoxygenated hemoglobin binds CO₂ well.
When oxygen binds,
this bond becomes unstable.
CO₂ is released.
Mechanism 2: Less Buffering of H⁺
Deoxygenated hemoglobin is a good buffer.
It binds hydrogen ions (H⁺).
When oxygen binds to hemoglobin,
H⁺ is released.
Those H⁺ ions combine with bicarbonate:
H⁺ + HCO₃⁻
      ↓
H₂CO₃
      ↓
CO₂ + H₂O
The newly formed CO₂ diffuses into the alveoli and is exhaled.
Why Does the Haldane Effect Help in Tissues?
Look at the upper curve.
In tissues:
- Hemoglobin loses oxygen.
- Hemoglobin becomes deoxygenated.
- Deoxygenated hemoglobin can carry more CO₂.
Therefore,
blood efficiently collects the CO₂ produced by cells.
Why Does the Haldane Effect Help in Lungs?
Look at the lower curve.
In lungs:
- Hemoglobin gains oxygen.
- Oxygenated hemoglobin cannot hold as much CO₂.
- CO₂ is released.
Therefore,
lungs efficiently eliminate CO₂.
Compare Tissues and Lungs
| In Tissues | In Lungs |
|---|---|
| Hemoglobin loses O₂ | Hemoglobin gains O₂ |
| Deoxygenated Hb forms | Oxygenated Hb forms |
| CO₂ carrying increases | CO₂ carrying decreases |
| CO₂ enters blood | CO₂ leaves blood |
Haldane Effect vs Bohr Effect
Students often confuse these.
| Bohr Effect | Haldane Effect |
|---|---|
| CO₂ affects O₂ transport | O₂ affects CO₂ transport |
| ↑ CO₂ shifts O₂ curve right | ↑ O₂ reduces CO₂ carrying |
| Promotes oxygen unloading in tissues | Promotes CO₂ unloading in lungs |
Easy Rule
- Bohr: CO₂ helps O₂ leave hemoglobin.
- Haldane: O₂ helps CO₂ leave hemoglobin.
Easy Story
Imagine
Hemoglobin is a
bus.
In the Tissues
Passengers
(Oxygen)
get off.
Now
many empty seats become available.
CO₂ passengers get on.
Bus carries lots of CO₂.
In the Lungs
New oxygen passengers enter.
The seats become occupied.
CO₂ passengers must get off.
CO₂ leaves through the lungs.
Exactly the same.
Clinical Correlation
1. Normal Physiology
The Haldane effect significantly increases the efficiency of CO₂ transport from tissues to lungs and its release into the alveoli.
2. Exercise
Working muscles release more oxygen from hemoglobin.
This increases the amount of deoxygenated hemoglobin, allowing blood to carry more CO₂ back to the lungs.
3. Oxygen Therapy in Severe COPD
In some patients with severe COPD and chronic CO₂ retention, giving high concentrations of oxygen can reduce the amount of CO₂ carried by deoxygenated hemoglobin (Haldane effect), contributing to a rise in blood CO₂. This is one mechanism among several (others include changes in ventilation-perfusion matching and reduced hypoxic respiratory drive in selected patients).
High-Yield MBBS Viva Points
Haldane Effect Definition
Oxygenation of hemoglobin decreases its ability to carry carbon dioxide, thereby promoting CO₂ release in the lungs. Deoxygenation of hemoglobin increases its ability to carry carbon dioxide, promoting CO₂ uptake in the tissues.
Remember
| PO₂ | CO₂ Carrying Capacity |
|---|---|
| Low PO₂ | High |
| High PO₂ | Low |
Understanding the Whole Graph Step by Step
Point A
- PO₂ = 40 mmHg
- PCO₂ = 45 mmHg
- Venous blood
- Deoxygenated hemoglobin
- Maximum CO₂ carrying capacity
↓
Blood enters lungs.
↓
Hemoglobin binds oxygen.
↓
CO₂ carrying capacity falls.
↓
Blood moves to
Point B
- PO₂ = 100 mmHg
- PCO₂ = 40 mmHg
- Arterial blood
- Less CO₂ remains
- CO₂ has been exhaled
Super Easy Memory Trick
Imagine a taxi.
🚖 Taxi = Hemoglobin
🧳 Oxygen = VIP passenger
📦 CO₂ = Luggage
In tissues
VIP passenger gets out.
Now
the taxi has plenty of space.
It picks up lots of luggage (CO₂).
In lungs
VIP passenger gets back in.
The luggage must be unloaded.
Exactly the same happens with hemoglobin.
🎯 MBBS Golden Rule
Haldane Effect
Deoxygenated hemoglobin = More CO₂ carrying
Oxygenated hemoglobin = Less CO₂ carrying
Final Comparison
| Feature | Bohr Effect | Haldane Effect |
|---|---|---|
| Main trigger | ↑ CO₂ / ↑ H⁺ | ↑ O₂ |
| Main result | Hemoglobin releases O₂ | Hemoglobin releases CO₂ |
| Occurs mainly in | Tissues | Lungs |
| Physiological purpose | Improve oxygen delivery | Improve carbon dioxide removal |
Final Concept to Never Forget
The key message of Figure 41.15 is that oxygen and carbon dioxide transport are closely linked.
- In the tissues, hemoglobin loses oxygen, becomes deoxygenated, and therefore binds more CO₂, helping transport metabolic waste.
- In the lungs, hemoglobin binds oxygen, becomes oxygenated, and therefore releases CO₂, allowing it to be exhaled.
This coordinated exchange—the Haldane effect—makes carbon dioxide transport far more efficient and works alongside the Bohr effect to optimize gas exchange.
Change in Blood Acidity During CO₂ Transport
- When CO₂ enters the blood in the peripheral tissues, it forms carbonic acid (H₂CO₃).
- Carbonic acid lowers the blood pH, making the blood slightly more acidic.
- However, the acid-base buffer systems of the blood prevent a large increase in H⁺ concentration.
- Therefore, the blood pH changes only slightly.
- Under normal conditions:
- Arterial blood pH = 7.41
- As blood picks up CO₂ in the tissue capillaries:
- Venous blood pH = 7.37
Easy Calculation
- Arterial pH = 7.41
- Venous pH = 7.37
Change in pH =
7.41 − 7.37 = 0.04
- Thus, during normal CO₂ transport, the blood pH decreases by only 0.04 units.
- In the lungs:
- CO₂ leaves the blood.
- Carbonic acid decreases.
- The blood pH rises back to 7.41.
- During heavy exercise, high metabolic activity, or slow tissue blood flow:
- Much more CO₂ is produced and retained.
- The decrease in tissue blood pH can be as much as 0.50 units.
- This is about 12 times greater than the normal pH change.
- Such a large fall in pH causes significant tissue acidosis.
Easy Concept
Think of CO₂ as an acid maker.
In the Tissues
CO₂ enters blood
        ↓
Carbonic acid forms
        ↓
Blood becomes slightly acidic
But the blood buffers immediately act like sponges.
Extra acid
      ↓
Blood buffers absorb it
So the pH changes only a little:
7.41
  ↓
7.37
In the Lungs
CO₂ leaves blood
      ↓
Less carbonic acid
      ↓
pH returns to 7.41
During Heavy Exercise
Muscles produce much more CO₂.
Much more CO₂
       ↓
Much more acid
       ↓
Buffers cannot completely prevent the fall
       ↓
Tissue acidosis
Easy Memory Table
| Situation | Blood pH |
|---|---|
| Arterial blood | 7.41 |
| Venous blood | 7.37 |
| Normal pH decrease | 0.04 |
| Heavy exercise / slow blood flow | Up to 0.50 decrease |
KEY CONCEPT
- As CO₂ enters the blood, it forms carbonic acid, causing a slight fall in pH. Blood buffers limit this change, so pH normally decreases only from 7.41 to 7.37. During heavy exercise or poor blood flow, much more CO₂ accumulates, causing a much larger fall in pH and leading to tissue acidosis.
RESPIRATORY EXCHANGE RATIO
- Under normal resting conditions:
- About 5 mL of O₂ is transported from the lungs to the tissues by every 100 mL of blood.
- About 4 mL of CO₂ is transported from the tissues to the lungs by every 100 mL of blood.
- Therefore, the amount of CO₂ expired is about 82% of the O₂ taken up by the lungs.
- The ratio of CO₂ output to O₂ uptake is called the Respiratory Exchange Ratio (R).
Formula
R=Rate of O₂ uptakeRate of CO₂ output
Easy Calculation
Under normal conditions:
- CO₂ output = 4 mL
- O₂ uptake = 5 mL
R=54=0.8
≈ 0.82 (82%)
- Therefore, under normal resting conditions, R is about 0.82.
- The value of R changes depending on the type of food used for energy.
- If the body uses only carbohydrates:
- R = 1.0
- One molecule of O₂ consumed produces one molecule of CO₂.
- If the body uses only fats:
- R = 0.7
- Much of the O₂ combines with hydrogen to form water, so less CO₂ is produced.
- On a normal mixed diet (carbohydrates + fats + proteins):
- Average R = 0.825
Easy Concept
Imagine the body is a factory.
- O₂ = Raw material entering
- CO₂ = Waste leaving
The Respiratory Exchange Ratio (R) tells us:
How much CO₂ waste comes out compared with the O₂ taken in.
Example 1: Mixed Diet (Normal)
O₂ In = 5 mL

CO₂ Out = 4 mL
↓
R = 4 ÷ 5

= 0.8 ≈ 0.82
Example 2: Carbohydrates Only 🍞
1 O₂ used

↓

1 CO₂ produced
↓
R = 1.0Example 3: Fats Only 🧈
Some oxygen is used to make water, not CO₂.
More O₂ used

↓

Less CO₂ produced
↓
R = 0.7Easy Memory Table
| Fuel Used | Respiratory Exchange Ratio (R) |
|---|---|
| Carbohydrates only | 1.0 |
| Mixed diet | 0.825 |
| Fats only | 0.7 |
KEY CONCEPT
- The Respiratory Exchange Ratio (R) is the ratio of CO₂ output to O₂ uptake. Normally, R is about 0.82 because about 4 mL of CO₂ is produced for every 5 mL of O₂ consumed. R is highest (1.0) when carbohydrates are the main fuel and lowest (0.7) when fats are the main fuel.
MADE BY SELF LEARNING CEO AND FOUNDER DR SHEEN
