


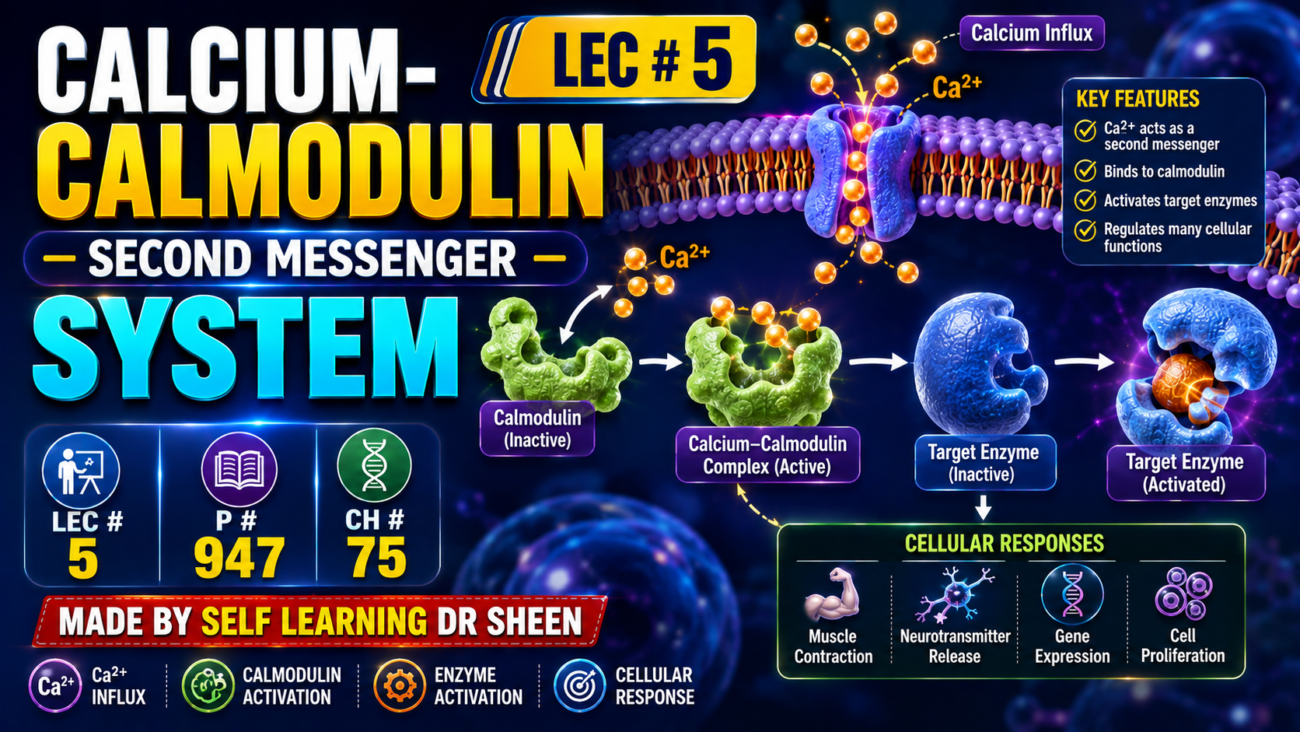
- Calcium enters the cell when:
- A change in membrane potential opens calcium channels, or
- A hormone binds to a membrane receptor that opens calcium channels.
- Once inside, Ca²⁺ binds to calmodulin, a protein with 4 calcium-binding sites.
- When 3 or 4 sites bind Ca²⁺, calmodulin changes shape and becomes active.
- Active calmodulin can produce several effects, including activating or inhibiting protein kinases.
- Calmodulin-dependent protein kinases phosphorylate proteins, which can activate or inhibit the proteins responsible for the cell’s response to the hormone.
- One important example is myosin light chain kinase, which calmodulin activates.
- This kinase acts on myosin in smooth muscle.
- The result is smooth muscle contraction (Fig. 8.3).
- Normally, intracellular Ca²⁺ is only 10⁻⁸ to 10⁻⁷ mol/L, which is too low to activate calmodulin.
- When Ca²⁺ rises to 10⁻⁶ to 10⁻⁵ mol/L, enough Ca²⁺ binds to calmodulin to activate its intracellular effects.
- This calcium change is almost the same as the change needed to activate troponin C and cause skeletal muscle contraction.
- Troponin C and calmodulin are similar in both their function and protein structure.
KEY CONCEPT
Ca²⁺ enters → binds calmodulin → calmodulin changes shape → activates/inhibits protein kinases → proteins are phosphorylated → cell response occurs.
CONCEPTUAL EXAMPLES
- Smooth muscle: Ca²⁺ → calmodulin → myosin light chain kinase → contraction.
- Skeletal muscle: Ca²⁺ activates troponin C → contraction.
HORMONES THAT ACT MAINLY ON THE GENETIC MACHINERY OF THE CELL
Steroid Hormones Increase Protein Synthesis
- Steroid hormones mainly act by causing new protein synthesis in target cells.
- These new proteins can act as:
- Enzymes
- Transport proteins
- Structural proteins
- These proteins then produce the hormone’s effects in the cell.
- The sequence of steroid hormone action is as follows (Fig. 75.6):
- Steroid hormone crosses the cell membrane and enters the cytoplasm.
- It binds to a specific receptor protein.
- The hormone–receptor complex enters the nucleus.
- It binds to specific sites on DNA, activating specific genes to produce mRNA.
- The mRNA moves into the cytoplasm and directs ribosomes to make new proteins.
- Example: Aldosterone
- Aldosterone enters renal tubular cells and binds to the mineralocorticoid receptor.
- This starts the same sequence of events.
- After about 45 minutes, new proteins begin to appear.
- These proteins increase sodium reabsorption from the tubules and potassium secretion into the tubules.
- Therefore, steroid hormone effects are usually slow, beginning after at least 45 minutes and sometimes taking hours or days.
- This is different from some peptide and amino acid–derived hormones, such as vasopressin and norepinephrine, which can act much more rapidly.
KEY CONCEPT
Steroid hormone → cell membrane → receptor → nucleus → DNA → mRNA → ribosome → new proteins → cell response.
CONCEPTUAL EXAMPLES
- Aldosterone → renal tubular cell → new proteins → ↑ Na⁺ reabsorption + ↑ K⁺ secretion.
- Steroid hormones: slower action because they must change gene activity and make new proteins.
- Vasopressin/norepinephrine: can produce rapid effects compared with steroid hormones.
Thyroid Hormones Increase Gene Transcription in the Cell Nucleus
- The thyroid hormones thyroxine (T₄) and triiodothyronine (T₃) increase transcription of specific genes in the cell nucleus.
- These hormones bind directly to receptor proteins inside the nucleus (Fig. 77.5).
- These receptors act as transcription factors within the chromosomes and control gene promoters.
- Thyroid hormone action in the nucleus has two important features:
- They activate genes that produce many types of intracellular proteins, probably 100 or more.
- Many of these proteins are enzymes, which increase metabolic activity in almost all cells of the body.
- After thyroid hormones bind to their intranuclear receptors, their effects can continue for days or even weeks.
KEY CONCEPT
T₃/T₄ → nuclear receptor → increased gene transcription → more proteins/enzymes → increased cellular metabolism.
CONCEPTUAL EXAMPLES
- T₃/T₄ + nuclear receptor → gene activation → enzyme production → ↑ cellular metabolism.
- Long-lasting effect: once bound to nuclear receptors, thyroid hormones can control cell function for days to weeks.
Measurement of Hormone Concentrations in the Blood
- Hormones are present in the blood in extremely tiny amounts, sometimes as low as 1 picogram/mL.
- Because these amounts are so small, ordinary chemical methods were difficult to use.
- Radioimmunoassay (RIA) was developed by Rosalyn Yalow and Solomon Berson in 1959, making measurement of tiny amounts of hormones much easier.
- Other methods, such as enzyme-linked immunosorbent assays, are also used for accurate, high-throughput hormone measurement.
Radioimmunoassay
- First, a highly specific antibody against the hormone being measured is produced.
- A small amount of this antibody is mixed with:
- The fluid containing the natural hormone being measured.
- A known amount of purified radioactive hormone.
- There must be too little antibody to bind both hormones completely, so the natural hormone and radioactive hormone compete for the antibody’s binding sites.
- The amount of each hormone that binds depends on its concentration in the fluid.
- After binding reaches equilibrium, the antibody–hormone complex is separated from the remaining solution.
- The amount of radioactive hormone bound to the antibody is then measured.
- Large amount of radioactive hormone bound → small amount of natural hormone was present.
- Small amount of radioactive hormone bound → large amount of natural hormone was present, because it competed more strongly for antibody binding sites.
- For accurate measurement, the same procedure is performed using standard solutions containing known hormone concentrations.
- These results are used to make a standard curve (Fig. 75.9).
- The radioactive count from the unknown sample is compared with this curve to determine its hormone concentration.
- The method can measure hormone concentrations with an error of about 10%–15%.
- It can detect amounts as tiny as billionths or even trillionths of a gram.
KEY CONCEPT
Natural hormone + radioactive hormone compete for limited antibody sites → measure radioactive hormone bound → compare with standard curve → determine natural hormone concentration.
CONCEPTUAL EXAMPLES
- More natural hormone → more competition → less radioactive hormone binds.
- Less natural hormone → less competition → more radioactive hormone binds.
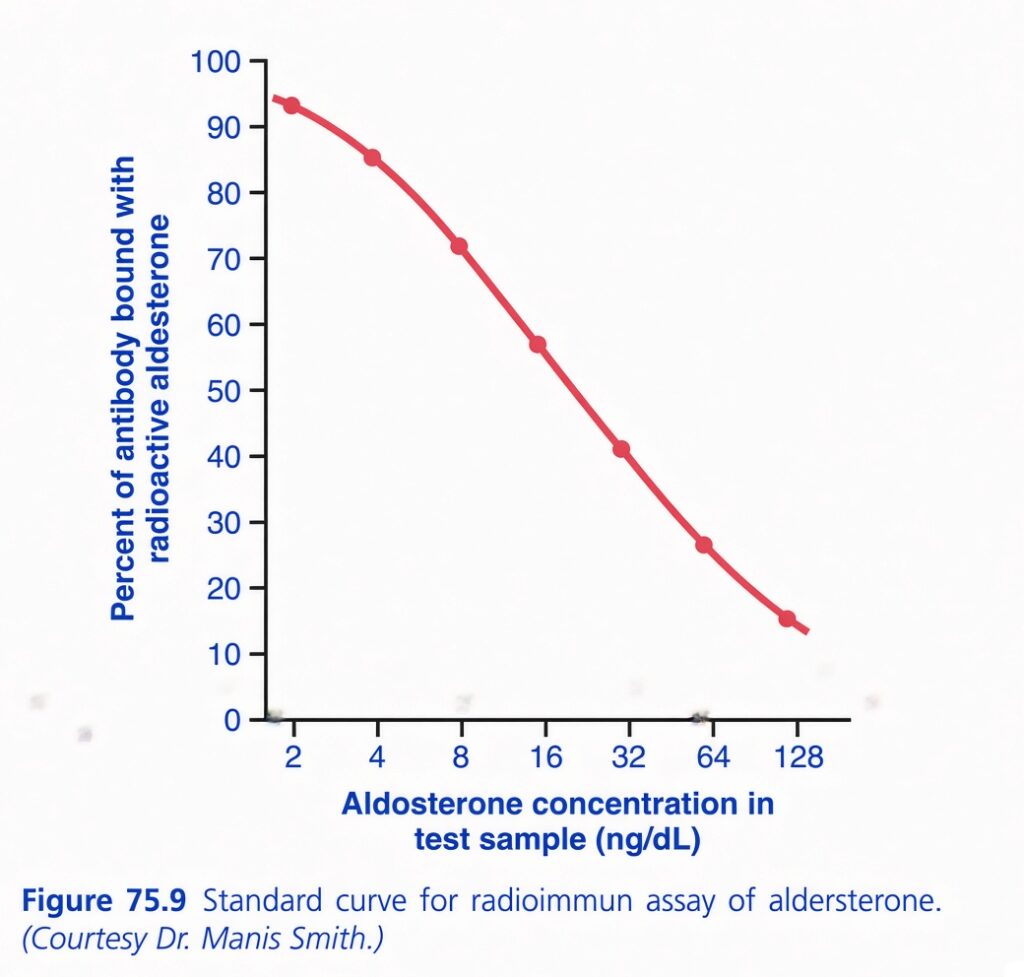
Aldosterone Radioimmunoassay Graph
Big idea:
👉 More aldosterone in the sample = less radioactive aldosterone can bind to the antibody.
Think of the antibody as having limited seats 🪑.
- Radioactive aldosterone = labeled passenger
- Patient/sample aldosterone = unlabeled passenger
- Antibody = limited seats
They compete for the same seats.
📊 Understand every part
Y-axis: “% of antibody bound with radioactive aldosterone”
→ How much of the radioactive aldosterone is attached to the antibody.
- 100% = lots of radioactive aldosterone is bound
- 0% = almost none is bound
X-axis: “Aldosterone concentration in test sample (ng/dL)”
→ How much unlabeled aldosterone is present in the sample.
From left → right:
2 → 4 → 8 → 16 → 32 → 64 → 128 ng/dL
So, aldosterone concentration is increasing.
🔴 What does the downward curve mean?
At 2 ng/dL → about 94% radioactive aldosterone is bound.
At 8 ng/dL → about 72% is bound.
At 32 ng/dL → about 41% is bound.
At 128 ng/dL → only about 15% is bound.
⭐ WHY?
Because increasing sample aldosterone competes with radioactive aldosterone for antibody binding sites.
More sample aldosterone ↑
↓
More competition ↑
↓
Less radioactive aldosterone binds ↓
↓
% radioactive aldosterone bound decreases ↓
🔥 The most important concept
RIA is an inverse relationship:
Sample aldosterone ↑ → radioactive aldosterone bound ↓
Therefore:
Less radioactivity bound = MORE aldosterone in the patient’s sample.
🧠 One-line memory trick
“More real aldosterone kicks out more radioactive aldosterone.” 🚪
So this graph is a standard curve used to determine an unknown aldosterone concentration by looking at how much radioactive aldosterone remains bound.
Enzyme-Linked Immunosorbent Assay
- ELISA can measure almost any protein, including hormones.
- It combines:
- Specificity of antibodies
- Sensitivity of enzyme assays
- ELISA is often performed in plastic plates with 96 small wells (Fig. 75.10).
- Each well is coated with AB1, an antibody specific for the hormone.
- The sample or standard is added to the well.
- Then AB2 is added, which also recognizes the hormone but binds to a different site.
- Next, AB3 is added; it recognizes AB2 and is attached to an enzyme.
- The enzyme changes a suitable substrate into a detectable product, measured by color or fluorescence.
- Each enzyme molecule can produce thousands of product molecules, so even a small amount of hormone can be detected.
- Unlike competitive radioimmunoassay, ELISA uses excess antibodies, so essentially all hormone molecules are captured in antibody–hormone complexes.
- Therefore, more hormone → more product formed.
- ELISA is widely used because:
- It does not use radioactive isotopes.
- 96-well plates allow much of the test to be automated.
- It is cost-effective and accurate for measuring hormone levels.
KEY CONCEPT
Hormone captured by antibodies → enzyme attached → substrate converted to detectable product → more hormone = more product.
CONCEPTUAL EXAMPLES
- Small hormone amount → small amount of product → weak signal.
- Large hormone amount → more product → stronger signal.
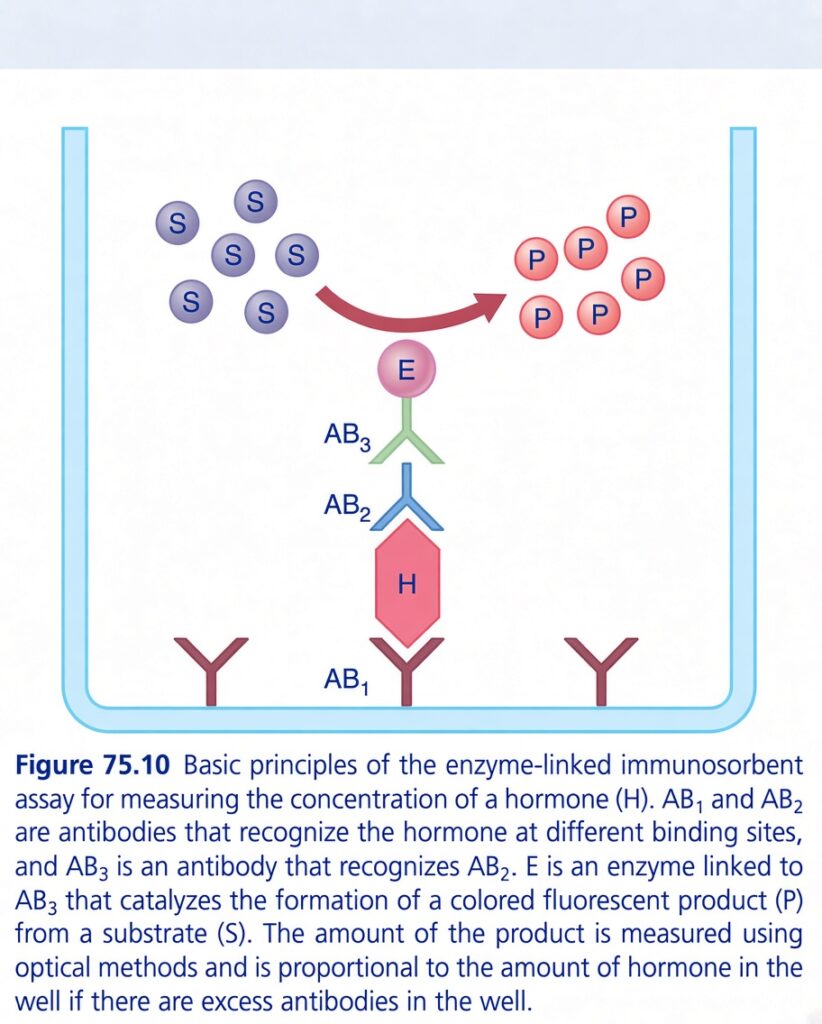
This is Guyton Figure 75.10: Enzyme-Linked Immunosorbent Assay (ELISA).
ISA is a laboratory test used to measure how much hormone is present in a sample.
Think of it as a hormone-catching + color-making test.
The basic idea:
More hormone → more enzyme → more colored product → stronger signal
That is the key concept.
🎯 FIRST: WHAT ARE WE TRYING TO FIND?
We want to know:
How much hormone (H) is in the patient’s sample?
The hormone may be present in a very small amount, so we use antibodies to find it.
🧩 UNDERSTAND EVERY PART OF THE FIGURE
1️⃣ AB₁ = First antibody 🪤
At the bottom of the well are many:
AB₁ antibodies
These antibodies are fixed to the plastic surface of the well.
Think of AB₁ as:
A trap attached to the floor.
Its job is to catch the hormone.
2️⃣ H = Hormone 🎯
The patient’s sample contains:
H = Hormone
When the sample is added:
Hormone binds to AB₁
So:
AB₁ 🪤 + H → AB₁—H
The hormone is now captured.
3️⃣ AB₂ = Second antibody 🔎
Next, another antibody is added:
AB₂
AB₂ recognizes the hormone at a different binding site.
So now:
AB₁ ↓Hormone ↓AB₂
The hormone is literally sandwiched between two antibodies.
That’s why this is often called a:
Sandwich-type ELISA
Think:
🥪 Antibody — Hormone — Antibody
4️⃣ AB₃ = Antibody against AB₂
Now comes the clever part.
We add:
AB₃
AB₃ recognizes and binds to:
AB₂
So the structure becomes:
AB₁ ↓H ↓AB₂ ↓AB₃
5️⃣ E = Enzyme 🧪
AB₃ has an:
Enzyme (E)
attached to it.
So now we have:
AB₃ + enzyme
The enzyme is going to create a colored product.
This is what allows us to detect the hormone.
6️⃣ S = Substrate
Now we add:
S = Substrate
The enzyme acts on the substrate.
Think:
Substrate = raw material
The enzyme converts it into:
P = Product
And the product is colored/fluorescent.
7️⃣ P = Colored Product 🌈
The figure shows:
S → P
where:
S = substrate
P = colored product
The enzyme converts the colorless/less detectable substrate into a detectable product.
Then we measure the amount of this product using an optical instrument.
🔥 THE MOST IMPORTANT RELATIONSHIP
The figure tells you:
Amount of colored product ∝ Amount of hormone
In simple words:
More hormone captured → more antibody complex → more enzyme → more colored product.
Therefore:
🌈 More color = more hormone
🌈 Less color = less hormone
provided the antibodies are in excess, as Guyton specifically states.
🧠 FOLLOW THE FIGURE FROM BOTTOM TO TOP
Let’s read every level:
AB₁ ↓Catches HORMONE ↓H ↓AB₂ ↓AB₃ ↓ENZYME (E) ↓SUBSTRATE (S) ↓COLORED PRODUCT (P) ↓MEASURE COLOR ↓CALCULATE HORMONE AMOUNT
That’s ELISA.
🥪 THE EASIEST STORY
Imagine a sandwich shop.
AB₁ = bottom bread 🍞
It catches the hormone.
H = filling 🥩
The hormone sits on AB₁.
AB₂ = top bread 🍞
It attaches to another part of the hormone.
So:
AB₁ — H — AB₂
Then:
AB₃ = label 🏷️
AB₃ attaches to AB₂.
E = color-producing machine 🎨
The enzyme attached to AB₃ makes color.
Therefore:
Find the color → estimate the amount of hormone.
🔬 WHY USE THREE ANTIBODIES?
This is a common point of confusion.
AB₁
Catches the hormone.
AB₂
Recognizes the hormone at another site.
AB₃
Recognizes AB₂ and carries the enzyme.
So memorize:
AB₁ catches → AB₂ identifies → AB₃ brings enzyme
🚨 DON’T CONFUSE AB₂ AND AB₃
AB₂ binds:
Hormone
AB₃ binds:
AB₂
Very important.
🎯 WHAT DOES THE ENZYME ACTUALLY DO?
The enzyme does not directly measure the hormone.
Instead:
Enzyme + substrate → colored product
Then we measure the color.
So the chain is:
Hormone → Enzyme → Color
The color is our indirect measurement of hormone concentration.
📈 WHY DOES MORE HORMONE PRODUCE MORE COLOR?
Suppose sample A has:
10 hormone molecules
Only 10 hormone molecules get captured → fewer antibody complexes → fewer enzymes → less product.
Sample B has:
100 hormone molecules
More hormone gets captured → more complexes → more enzymes → more product.
Therefore:
More hormone → more color
🧠 THE ENTIRE FIGURE IN 10 SECONDS
AB₁ catches hormone
⬇️
AB₂ binds hormone
⬇️
AB₃ binds AB₂
⬇️
AB₃ carries enzyme
⬇️
Enzyme converts S → P
⬇️
P gives color
⬇️
Measure color
⬇️
Color tells us hormone concentration
⭐ HIGH-YIELD EXAM TABLE
| Component | Job |
|---|---|
| H | Hormone being measured |
| AB₁ | Captures hormone |
| AB₂ | Binds hormone at another site |
| AB₃ | Binds AB₂ |
| E | Enzyme attached to AB₃ |
| S | Substrate for enzyme |
| P | Colored/fluorescent product |
| Optical measurement | Measures product/color |
| Final purpose | Determine hormone concentration |
🔑 GOLDEN MEMORY LINE
“AB₁ catches, AB₂ sandwiches, AB₃ brings the enzyme, enzyme makes color, and color tells hormone.”
Or even shorter:
🪤 Catch → Sandwich → Enzyme → Color → Measure
That’s the whole Guyton ELISA figure.
