


Figure Mentioned:
- Fig. 38.5 – Basic spirometer used to measure pulmonary ventilation.
- Fig. 38.6 – Spirogram showing changes in lung volume during different breathing conditions.
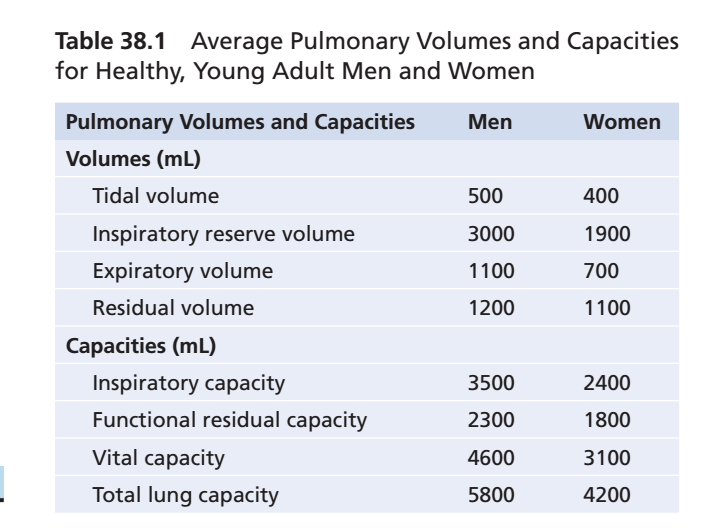
- Table Mentioned: Table 38.1 – Average pulmonary volumes and capacities in healthy young adult men and women.
Recording Changes in Pulmonary Volume—Spirometry
- Spirometry is a method used to study pulmonary ventilation.
- It records the volume of air moving into and out of the lungs.
Basic Spirometer
- Fig. 38.5 shows a basic spirometer.
- It consists of:
- A drum inverted over a chamber of water.
- A counterbalancing weight attached to the drum.
- The drum contains a breathing gas, usually:
- Air
- Oxygen
- A tube connects the person’s mouth to the gas chamber.
Working of the Spirometer
- When the person breathes into the chamber:
- The drum moves.
- When the person breathes out of the chamber:
- The drum moves in the opposite direction.
- These movements are recorded to measure changes in lung volume.
Spirogram
- Fig. 38.6 shows a spirogram.
- A spirogram records changes in lung volume during different types of breathing.
Pulmonary Volumes and Capacities
- For easier understanding, the air in the lungs is divided into:
- Four pulmonary volumes
- Four pulmonary capacities
- The values shown represent the average for a young adult man.
Average Values
- Table 38.1 summarizes the average pulmonary volumes and capacities for:
- Healthy young adult men
- Healthy young adult women
Key Concept
- Spirometry measures pulmonary ventilation by recording the volume of air moving into and out of the lungs. A basic spirometer (Fig. 38.5) produces a spirogram (Fig. 38.6), which divides lung air into four pulmonary volumes and four pulmonary capacities. Table 38.1 summarizes their average values in healthy adults.
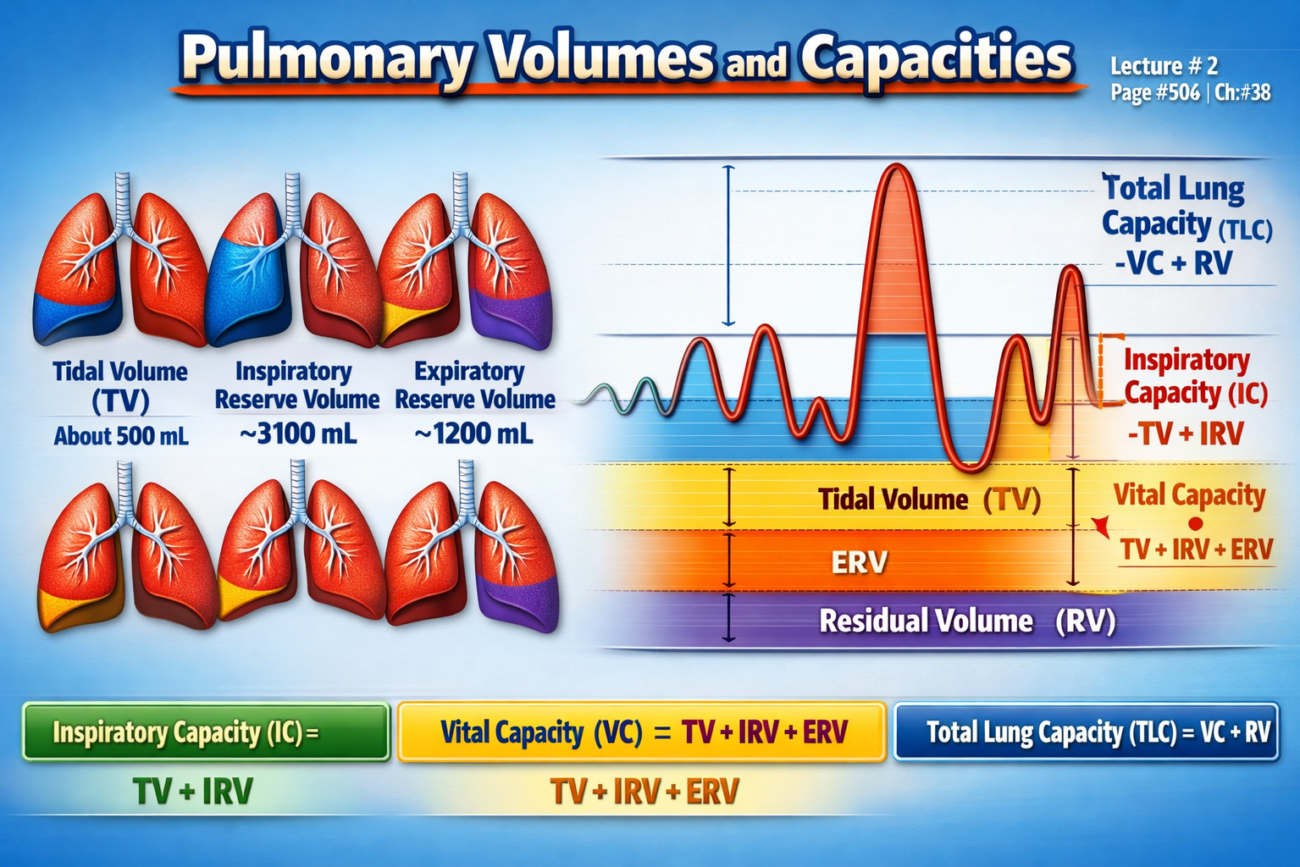
PULMONARY VOLUMES AND CAPACITIES
Figure Mentioned:
- Fig. 38.5 – Basic spirometer used to measure pulmonary ventilation.
- Fig. 38.6 – Spirogram showing changes in lung volume during different breathing conditions.
- Table Mentioned: Table 38.1 – Average pulmonary volumes and capacities in healthy young adult men and women.
Recording Changes in Pulmonary Volume—Spirometry
- Spirometry is a method used to study pulmonary ventilation.
- It records the volume of air moving into and out of the lungs.
Basic Spirometer
- Fig. 38.5 shows a basic spirometer.
- It consists of:
- A drum inverted over a chamber of water.
- A counterbalancing weight attached to the drum.
- The drum contains a breathing gas, usually:
- Air
- Oxygen
- A tube connects the person’s mouth to the gas chamber.
Working of the Spirometer
- When the person breathes into the chamber:
- The drum moves.
- When the person breathes out of the chamber:
- The drum moves in the opposite direction.
- These movements are recorded to measure changes in lung volume.
Spirogram
- Fig. 38.6 shows a spirogram.
- A spirogram records changes in lung volume during different types of breathing.
Pulmonary Volumes and Capacities
- For easier understanding, the air in the lungs is divided into:
- Four pulmonary volumes
- Four pulmonary capacities
- The values shown represent the average for a young adult man.
Average Values
- Table 38.1 summarizes the average pulmonary volumes and capacities for:
- Healthy young adult men
- Healthy young adult women
Key Concept
- Spirometry measures pulmonary ventilation by recording the volume of air moving into and out of the lungs. A basic spirometer (Fig. 38.5) produces a spirogram (Fig. 38.6), which divides lung air into four pulmonary volumes and four pulmonary capacities. Table 38.1 summarizes their average values in healthy adults.
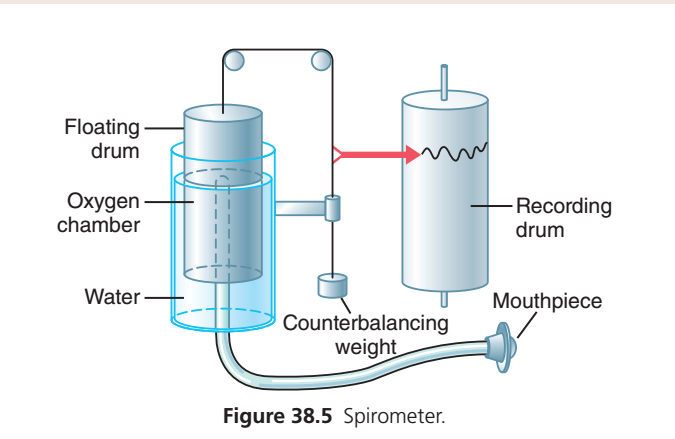
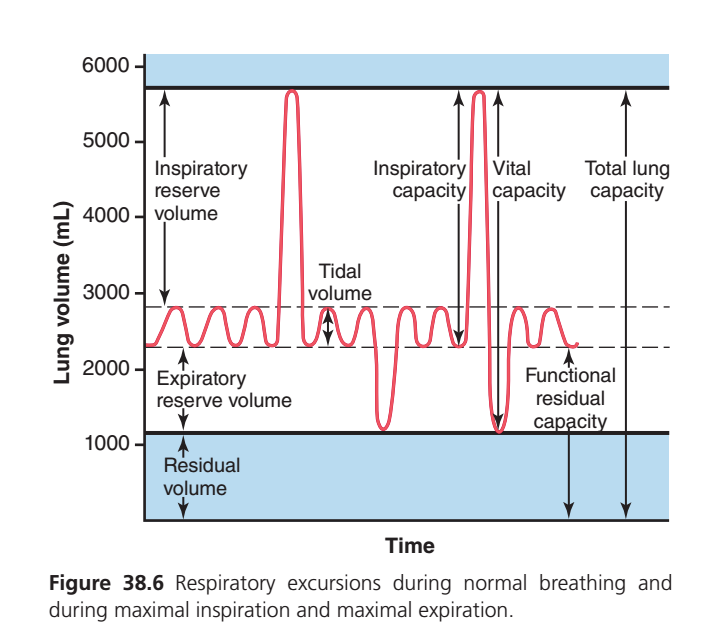
Figure 38.6: Respiratory Excursions During Normal Breathing and During Maximal Inspiration and Expiration
STEP 1: What does the graph represent?
The graph records the amount of air inside the lungs at every second.
The red line is the lung volume.
- Red line goes upward → Inspiration (air enters lungs)
- Red line goes downward → Expiration (air leaves lungs)
Think of the red line like the water level inside a bottle.
- More air enters → level rises.
- Air leaves → level falls.
STEP 2: Understanding the Axes
Y-axis = Lung Volume (mL)
6000 mL
↑
│  More air inside lungs
│
│
1000 mL
↓
Less air inside lungs
Higher position = More air in lungs
Lower position = Less air in lungsX-axis = Time
Time simply shows breathing occurring continuously.
Time →

Breath 1

Breath 2

Breath 3

Deep Breath

Forceful Expiration
STEP 3: The First Small Waves (Normal Breathing)
Look carefully.
      /\      /\      /\      /\
_____/  \____/  \____/  \____/  \____
Each wave represents one normal breath.
Every wave has two parts.ard Part
↑This is
Inspiration
Air enters lungs.
Lung volume increases.
Chest expands.
Diaphragm contracts.ownward Part
↓This is
Expiration
Air leaves lungs.
Lung volume decreases.
Chest relaxes.
Diaphragm relaxes.
STEP 4: Why do the Small Waves Stay Between Two Dashed Lines?
Notice these dashed lines.
Upper dashed line
-----------------

Small breathing

-----------------
Lower dashed line
The lungs are only using about 500 mL of air during quiet breathing.
This small amount is called
Tidal Volume (TV)
Tidal Volume
Definition
Amount of air inspired or expired during one normal quiet breath.
Normal Value
≈500 mL
Easy Example
Imagine drinking water.
One normal sip
↓
One normal swallow
↓
That small amount
↓
Tidal Volume
STEP 5: What Happens Suddenly?
Look here.
        /\
       /  \
______/    \______
Suddenly the red line shoots upward.
Why?
Because the person takes
Maximum Inspiration
The lungs are filled almost completely.
Which volume is used?
After normal inspiration,
there is still a huge amount of air that can be inhaled.
That extra air is
Inspiratory Reserve Volume (IRV)
Definition
Extra air inspired after normal inspiration.
Normal Value
≈3000 mL
Easy Concept
Doctor says
“Take the deepest breath possible.”
Everything above the normal breath
↓
Inspiratory Reserve Volume
STEP 6: Look at the Highest Point
          ▲
          │
This is
Maximum amount of air inside lungs.
The lungs cannot hold any more air.
This is
Total Lung Capacity
Normal Value
≈5800–6000 mL
Formula
TLC

=

IRV + TV + ERV + RV
STEP 7: What Happens Next?
Immediately after maximum inspiration,
the red line falls sharply.
      /\
     /
____/
This means
Maximum Expiration
The person blows out as much air as possible.
STEP 8: Why Doesn’t the Red Line Reach Zero?
This is the MOST IMPORTANT CONCEPT.
Even after blowing out as hard as possible,
the lungs still contain air.
Why?
Because alveoli should never collapse.
Therefore
some air always remains.
This remaining air is
Residual Volume (RV)
Residual Volume
Definition
Air remaining in lungs after maximum forced expiration.
Normal Value
≈1200 mL
Why is RV important?
Without RV
↓
Alveoli collapse
↓
Next breath becomes extremely difficult
↓
Gas exchange stops temporarily
Think of a balloon.
Even after squeezing it,
a little air always remains.
That is Residual Volume.
STEP 9: Expiratory Reserve Volume (ERV)
Look here.
Normal expiration

↓

Still more air can come out

↓↓↓↓↓↓
That extra air is
Expiratory Reserve Volume
Normal Value
≈1100 mL
Definition
Extra air expired after normal expiration.
STEP 10: Functional Residual Capacity (FRC)
After a normal expiration,
lungs still contain air.
What remains?
Residual Volume

+

Expiratory Reserve Volume
This is called
Functional Residual Capacity
Formula
FRC

=

ERV + RV
Normal Value
≈2300 mL
Why important?
Between every two breaths,
oxygen continues moving into blood because lungs still contain air.
Without FRC,
oxygen delivery would stop between breaths.
STEP 11: Inspiratory Capacity (IC)
Look at this arrow.
Starts
End of normal expirationEnds
Maximum inspirationEverything you can inhale after a normal expiration
=
Inspiratory Capacity
Formula
IC

=

TV + IRV
Normal Value
≈3500 mLSTEP 12: Vital Capacity (VC)
Look at this long arrow.
Starts
Maximum inspirationEnds
Maximum expirationEverything that can actually move in and out of lungs
=
Vital Capacity
Formula
VC

=

IRV

+

TV

+

ERV
Normal Value
≈4600 mL
Easy Concept
Take the deepest breath possible.
Now blow out everything possible.
Total movable air
↓
Vital Capacity
STEP 13: Understanding Every Arrow
Arrow 1
Inspiratory Reserve VolumeExtra air inhaled after a normal inspiration.
Arrow 2
Tidal VolumeNormal breathing.
Arrow 3
Expiratory Reserve VolumeExtra air exhaled after normal expiration.
Arrow 4
Residual VolumeAir that never leaves lungs.
Arrow 5
Inspiratory CapacityNormal expiration → Maximum inspiration
Arrow 6
Vital CapacityMaximum inspiration → Maximum expiration
Arrow 7
Functional Residual CapacityAir remaining after normal expiration.
Arrow 8
Total Lung CapacityMaximum amount lungs can contain.
STEP 14: Complete Story of the Red Line
Small waves
↓

Normal breathing

↓

Deep inspiration

↓

Maximum lung filling

↓

Forceful expiration

↓

Only residual air remains

↓

Normal breathing starts again
STEP 15: Relationships (Very High-Yield)
| Capacity | Formula | Normal Value |
|---|---|---|
| Tidal Volume (TV) | Normal breath | 500 mL |
| Inspiratory Reserve Volume (IRV) | Extra inspired | 3000 mL |
| Expiratory Reserve Volume (ERV) | Extra expired | 1100 mL |
| Residual Volume (RV) | Air left after maximal expiration | 1200 mL |
| Inspiratory Capacity (IC) | TV + IRV | 3500 mL |
| Functional Residual Capacity (FRC) | ERV + RV | 2300 mL |
| Vital Capacity (VC) | IRV + TV + ERV | 4600 mL |
| Total Lung Capacity (TLC) | VC + RV | 5800–6000 mL |
STEP 16: Clinical Correlation (MBBS Viva)
Which lung volumes cannot be measured by spirometry?
Because spirometry measures only the air that moves in and out of the lungs, it cannot measure Residual Volume (RV). Therefore, any capacity that includes RV also cannot be measured directly.
- ❌ Residual Volume (RV)
- ❌ Functional Residual Capacity (FRC = ERV + RV)
- ❌ Total Lung Capacity (TLC = VC + RV)
Only volumes and capacities that do not include RV (such as TV, IRV, ERV, IC, and VC) can be measured by simple spirometry.
🩺 MBBS Memory Trick
Imagine your lungs as a water tank:
- 🟢 Tidal Volume (TV): The small amount of water that moves in and out with each normal pump cycle.
- 🔵 Inspiratory Reserve Volume (IRV): Extra water you can add when you open the valve fully.
- 🟠 Expiratory Reserve Volume (ERV): Extra water you can drain after normal emptying.
- 🔴 Residual Volume (RV): Water that always remains at the bottom of the tank—it cannot be drained.
- 🟣 Vital Capacity (VC): All the water you can move in and out.
- ⚫ Total Lung Capacity (TLC): Every drop the tank can hold, including the water that always remains.
Golden Rule:
The red line never reaches zero because healthy lungs are never completely empty. Residual volume keeps the alveoli open, prevents lung collapse, and ensures continuous gas exchange even between breaths.
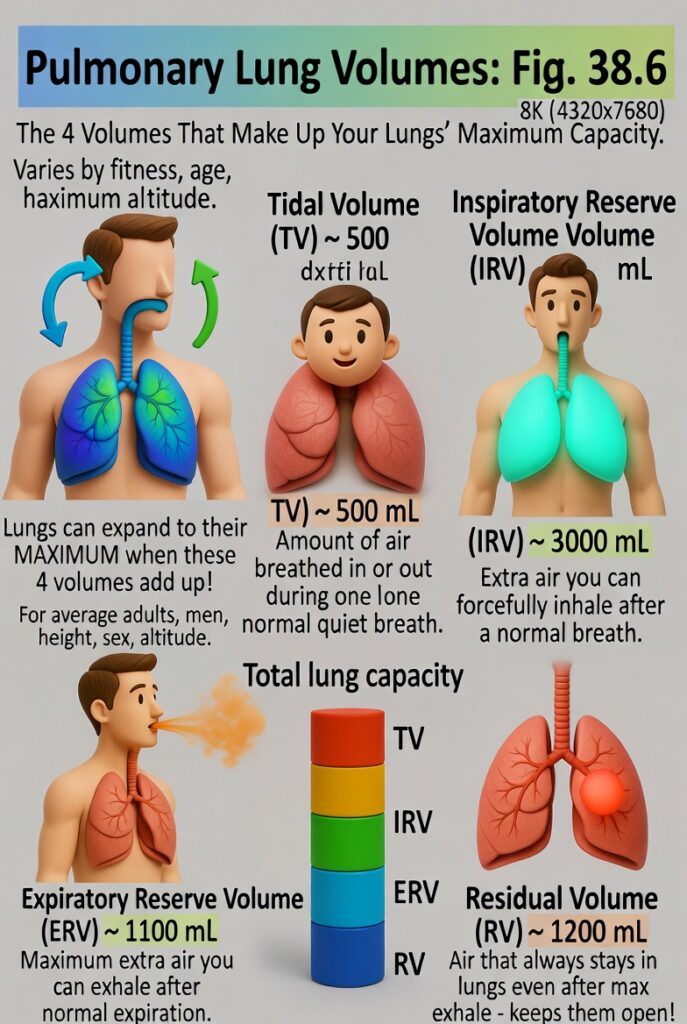
Pulmonary Volumes
Figure: Fig. 38.6
- Fig. 38.6 shows four pulmonary (lung) volumes.
- When these four lung volumes are added together, they give the maximum volume to which the lungs can expand.
- The lung volumes shown are for average adult men.
- Lung volumes can vary greatly depending on:
- Physical fitness
- Age
- Height
- Sex
- Altitude where a person lives
- The importance of each lung volume is explained below.
Tidal Volume
- Tidal volume is the amount of air breathed in or out during one normal breath.
- Normal tidal volume is about 500 mL.
Inspiratory Reserve Volume
- Inspiratory reserve volume is the extra amount of air that can be inhaled after a normal inspiration.
- This happens when a person breathes in with maximum effort.
- Normal inspiratory reserve volume is about 3000 mL.
Expiratory Reserve Volume
- Expiratory reserve volume is the maximum extra amount of air that can be exhaled after a normal expiration.
- This requires forceful expiration.
- Normal expiratory reserve volume is about 1100 mL.
Residual Volume
- Residual volume is the amount of air that remains in the lungs after the strongest possible expiration.
- Normal residual volume is about 1200 mL.
Key Concept
- The four pulmonary volumes are tidal volume, inspiratory reserve volume, expiratory reserve volume, and residual volume.
- Together, these four volumes equal the maximum volume to which the lungs can expand.
- Normal values: Tidal volume = 500 mL, Inspiratory reserve volume = 3000 mL, Expiratory reserve volume = 1100 mL, Residual volume = 1200 mL.
Pulmonary Capacities
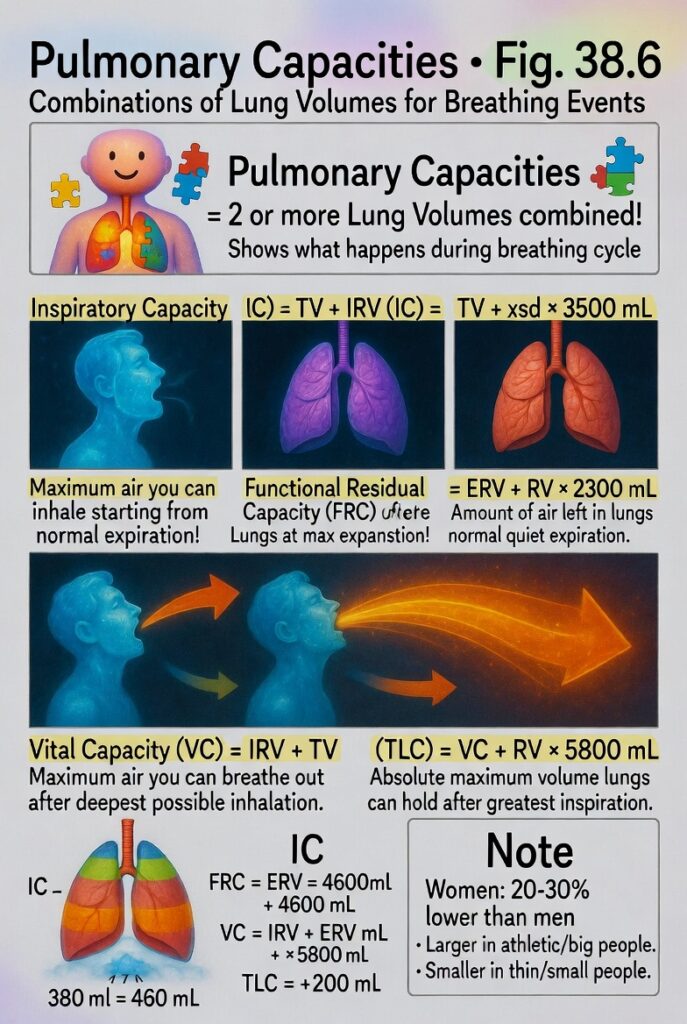
Figure: Fig. 38.6
- Sometimes, two or more lung volumes are combined to describe events during the pulmonary (breathing) cycle.
- These combinations are called pulmonary capacities.
- Fig. 38.6 shows the important pulmonary capacities.
Inspiratory Capacity
- Inspiratory capacity is tidal volume + inspiratory reserve volume.
- It is the amount of air a person can inhale after a normal expiration.
- The lungs expand to their maximum size during this inspiration.
- Normal inspiratory capacity is about 3500 mL.
Functional Residual Capacity
- Functional residual capacity is expiratory reserve volume + residual volume.
- It is the amount of air left in the lungs after a normal expiration.
- Normal functional residual capacity is about 2300 mL.
Vital Capacity
- Vital capacity is inspiratory reserve volume + tidal volume + expiratory reserve volume.
- It is the maximum amount of air a person can breathe out after first filling the lungs as much as possible.
- The air is then expired with maximum effort.
- Normal vital capacity is about 4600 mL.
Total Lung Capacity
- Total lung capacity is the maximum amount of air the lungs can hold after the greatest possible inspiration.
- It is equal to vital capacity + residual volume.
- Normal total lung capacity is about 5800 mL.
Pulmonary Capacities in Different People
- Most pulmonary volumes and capacities are about 20% to 30% lower in women than in men.
- Pulmonary volumes and capacities are greater in large and athletic people.
- They are smaller in small and asthenic (thin) people.
Key Concept
- Pulmonary capacities are formed by combining two or more pulmonary volumes.
- Inspiratory Capacity (IC) = Tidal Volume (TV) + Inspiratory Reserve Volume (IRV) = ~3500 mL
- Functional Residual Capacity (FRC) = Expiratory Reserve Volume (ERV) + Residual Volume (RV) = ~2300 mL
- Vital Capacity (VC) = Inspiratory Reserve Volume (IRV) + Tidal Volume (TV) + Expiratory Reserve Volume (ERV) = ~4600 mL
- Total Lung Capacity (TLC) = Vital Capacity (VC) + Residual Volume (RV) = ~5800 mL
- Women usually have 20%–30% lower pulmonary volumes and capacities than men.
- Large, athletic people have greater lung capacities than small, asthenic people.
Abbreviations and Symbols Used in Pulmonary Function Studies
Figure: Fig. 38.6
- Spirometry is one of the many methods used to measure pulmonary (lung) function.
- Pulmonary physicians use these measurement methods every day.
- Many of these methods depend on mathematical calculations.
- Standard abbreviations and symbols are used to make calculations and presentation of pulmonary function data easier.
- The important abbreviations and symbols are listed in Table 38.2.
- The following equations show the relationships between pulmonary volumes and capacities.
- Review Fig. 38.6 to understand and verify these relationships.
Equations
- VC = IRV + VT + ERV
- VC = IC + ERV
- TLC = VC + RV
- TLC = IC + FRC
- FRC = ERV + RV
Key Concept
- Standard abbreviations and symbols simplify pulmonary function calculations.
- Important relationships are:
- VC = IRV + VT + ERV
- VC = IC + ERV
- TLC = VC + RV
- TLC = IC + FRC
- FRC = ERV + RV
etermination of Functional Residual Capacity, Residual Volume, and Total Lung Capacity—Helium Dilution Method
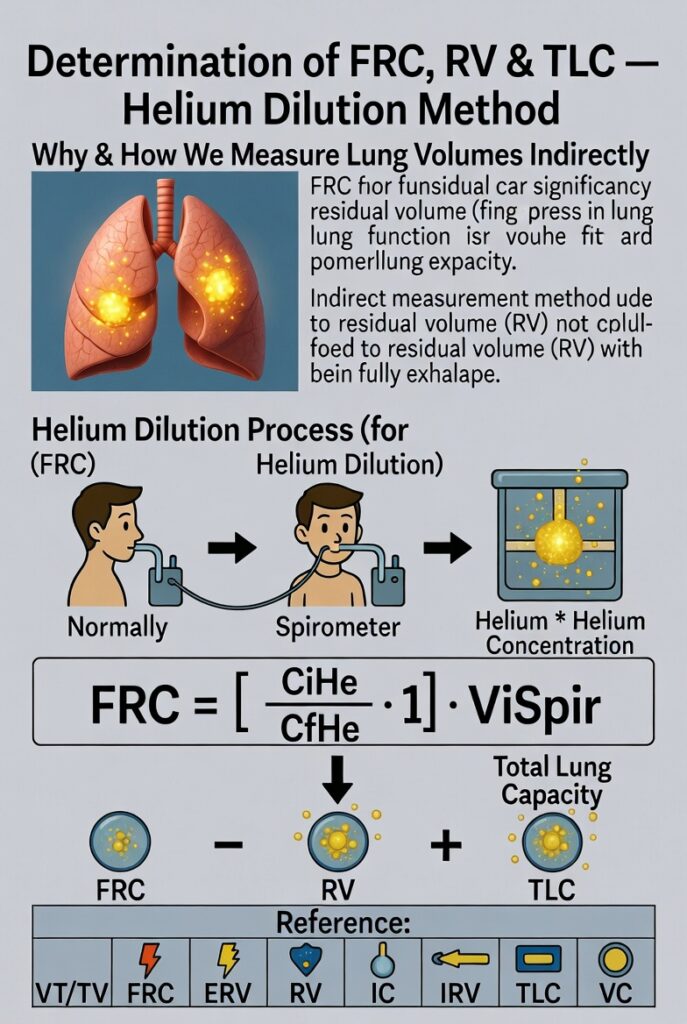
- Functional Residual Capacity (FRC) is the amount of air left in the lungs after a normal expiration.
- FRC is important for normal lung function.
- FRC changes significantly in some lung diseases.
- Therefore, measuring FRC is often necessary.
Why Spirometry Cannot Measure FRC Directly
- A spirometer cannot measure FRC directly.
- This is because the air in the residual volume (RV) cannot be exhaled into the spirometer.
- Residual volume makes up about half of the FRC.
- Therefore, FRC must be measured indirectly.
- The helium dilution method is commonly used.
Helium Dilution Method
- A spirometer with a known volume is filled with air mixed with helium of a known concentration.
- Before breathing from the spirometer, the person expires normally.
- At the end of normal expiration, the air remaining in the lungs equals the FRC.
- The person then immediately starts breathing from the spirometer.
- The gases in the spirometer mix with the gases in the lungs.
- As the gases mix, helium becomes diluted by the FRC air.
- The amount of helium dilution is used to calculate the FRC.
Formula for Functional Residual Capacity (FRC)
FRC = [(CiHe / CfHe) − 1] × ViSpir
Where:
- FRC = Functional residual capacity
- CiHe = Initial helium concentration in the spirometer
- CfHe = Final helium concentration in the spirometer
- ViSpir = Initial volume of the spirometer
Determination of Residual Volume (RV)
- After calculating FRC, the Residual Volume (RV) can be determined.
- Subtract the Expiratory Reserve Volume (ERV) from the FRC.
RV = FRC − ERV
Determination of Total Lung Capacity (TLC)
- After calculating FRC, the Total Lung Capacity (TLC) can be determined.
- Add the Inspiratory Capacity (IC) to the FRC.
TLC = FRC + IC
Abbreviations and Symbols for Pulmonary Function
| Abbreviation | Function |
|---|---|
| VT | Tidal volume |
| FRC | Functional residual capacity |
| ERV | Expiratory reserve volume |
| RV | Residual volume |
| IC | Inspiratory capacity |
| IRV | Inspiratory reserve volume |
| TLC | Total lung capacity |
| VC | Vital capacity |
| Raw | Resistance of the airways to airflow |
| C | Compliance |
| VD | Volume of dead space gas |
| VA | Volume of alveolar gas |
| VI | Inspired ventilation per minute |
| VE | Expired ventilation per minute |
| VS | Shunt flow |
| V̇A | Alveolar ventilation per minute |
| V̇O₂ | Oxygen uptake per minute |
| V̇CO₂ | Carbon dioxide eliminated per minute |
| V̇CO | Carbon monoxide uptake per minute |
| DLO₂ | Diffusing capacity of the lungs for oxygen |
| DLCO | Diffusing capacity of the lungs for carbon monoxide |
| PB | Atmospheric pressure |
| Palv | Alveolar pressure |
| Ppl | Pleural pressure |
| PO₂ | Partial pressure of oxygen |
| PCO₂ | Partial pressure of carbon dioxide |
| PN₂ | Partial pressure of nitrogen |
| PaO₂ | Partial pressure of oxygen in arterial blood |
| PaCO₂ | Partial pressure of carbon dioxide in arterial blood |
| PAO₂ | Partial pressure of oxygen in alveolar gas |
| PACO₂ | Partial pressure of carbon dioxide in alveolar gas |
| PAH₂O | Partial pressure of water in alveolar gas |
| R | Respiratory exchange ratio |
| Q | Cardiac output |
| CaO₂ | Oxygen concentration in arterial blood |
| CvO₂ | Oxygen concentration in mixed venous blood |
| SO₂ | Percentage saturation of hemoglobin with oxygen |
| SaO₂ | Percentage saturation of hemoglobin with oxygen in arterial blood |
Key Concept
- FRC is the air remaining in the lungs after normal expiration.
- Spirometry cannot measure FRC directly because residual volume cannot be exhaled.
- Helium dilution is an indirect method used to measure FRC.
- FRC = [(CiHe / CfHe) − 1] × ViSpir
- RV = FRC − ERV
- TLC = FRC + IC
- Standard abbreviations and symbols make pulmonary function measurements and calculations easier.
Helium Dilution Formula
FRC=(CfHeCiHe−1)×ViSp
Step 1: Before the Person Breathes
The spirometer contains:
- Known volume = ViSp
- Known helium concentration = CiHe
Example:
- Spirometer volume = 3 L
- Helium concentration = 10%
So,
| Spirometer | Value |
|---|---|
| Volume | 3 L |
| Helium | 10% |
Step 2: After the Person Breathes
The helium mixes with the air already inside the lungs (FRC).
Because helium spreads into a larger space, its concentration becomes lower.
Example:
| Before | After |
|---|---|
| 10% | 5% |
Notice:
- Initial concentration = 10%
- Final concentration = 5%
Helium became half as concentrated.
Step 3: Find How Many Times the Space Increased
Divide the initial concentration by the final concentration.CfHeCiHe=510=2
Meaning:
The helium is now spread through a space that is 2 times larger than the spirometer alone.
Step 4: Why Do We Subtract 1?
The answer 2 includes:
- 1 spirometer volume
- 1 lung volume
We only want the lung volume (FRC).
So,2−1=1
Now only the extra space (lungs) remains.
Step 5: Multiply by Spirometer Volume
Multiply by the known spirometer volume.1×3L=3L
Therefore,FRC=3L
Another Example
Suppose
- CiHe = 12%
- CfHe = 4%
- ViSp = 2 L
Step 1
412=3
Meaning:
The helium spread into a space 3 times larger.
Step 2
Subtract 1.3−1=2
Only the lung part remains.
Step 3
Multiply by spirometer volume.2×2L=4L
Answer
FRC=4L
Why Does This Formula Work?
Imagine you pour 1 spoon of blue ink into 1 glass of water.
The color is dark.
Now pour the same ink into 2 glasses of water.
The color becomes lighter because the ink is diluted.
Helium behaves in the same way:
- Small lung volume → Less dilution → Higher final helium concentration (CfHe).
- Large lung volume → More dilution → Lower final helium concentration (CfHe).
So, by measuring how much helium is diluted, we can calculate how much air was already present in the lungs (FRC).
Easy Memory Formula
Known helium in spirometer
            ↓
Breath into spirometer
            ↓
Helium mixes with lung air
            ↓
Helium concentration falls
            ↓
Measure the fall
            ↓
Use the formula
            ↓
Calculate FRC
Key Concept
- CiHe ÷ CfHe tells you how many times the helium-containing space increased after mixing.
- Subtract 1 to remove the original spirometer volume.
- Multiply by ViSp to convert that ratio into the actual lung volume (FRC).
- Greater helium dilution (smaller CfHe) means a larger FRC.
Minute Respiratory Volume Equals Respiratory Rate Times Tidal Volume
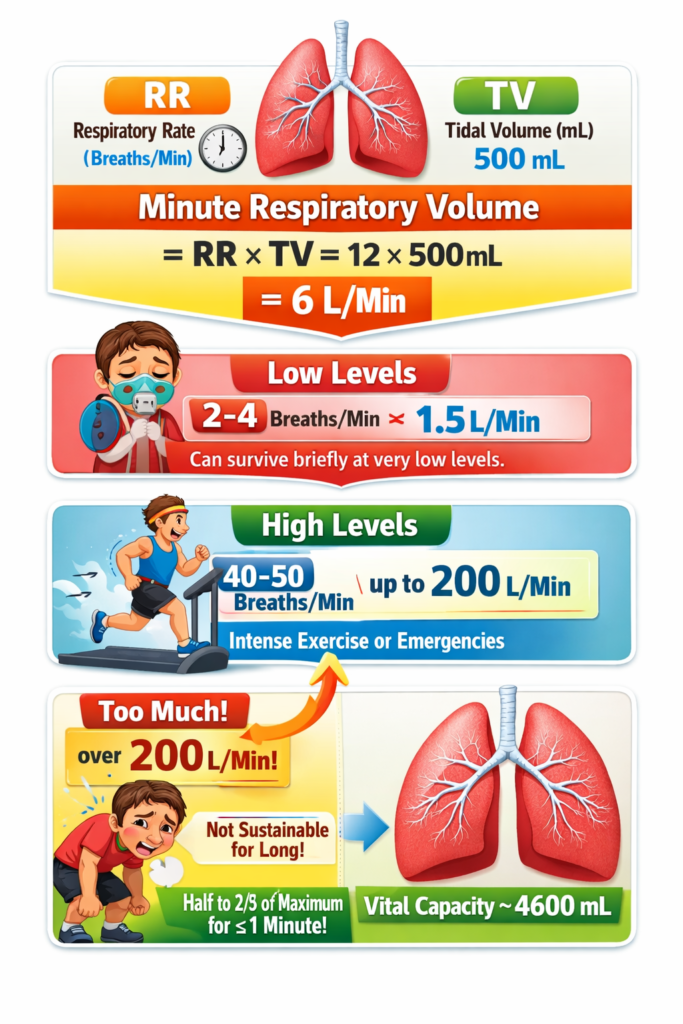
- Minute respiratory volume is the total amount of new air that enters the respiratory passages in one minute.
- It is calculated by multiplying tidal volume by the respiratory rate per minute.
Formula
Minute Respiratory Volume = Tidal Volume × Respiratory RateWhat Each Symbol Means
- Minute Respiratory Volume (MRV) = Total air entering the lungs in 1 minute
- Tidal Volume (TV) = Air inhaled or exhaled in one normal breath
- Respiratory Rate (RR) = Number of breaths taken in one minute
Easy Concept
Think of breathing like filling bottles with water.
- Tidal Volume (TV) = Water in one bottle
- Respiratory Rate (RR) = Number of bottles filled each minute
- Minute Respiratory Volume (MRV) = Total water filled in one minute
So,
Air in one breath × Number of breaths = Total air breathed in one minute
Step-by-Step Calculation (Normal Person)
Given:
- Tidal Volume = 500 mL
- Respiratory Rate = 12 breaths/min
Step 1: Write the formula
MRV = TV × RR
Step 2: Substitute the values
MRV = 500 mL × 12 breaths/min
Step 3: Multiply
MRV = 6000 mL/min
Step 4: Convert to liters
6000 mL = 6 L
Final Answer
Minute Respiratory Volume = 6 L/min
Very Low Minute Respiratory Volume
- A person can survive for a short time with:
- Minute Respiratory Volume = 1.5 L/min
- Respiratory Rate = 2–4 breaths/min
Maximum Minute Respiratory Volume
- Respiratory rate can increase to 40–50 breaths/min.
- Tidal volume can increase up to the Vital Capacity (4600 mL) in a young man.
- This can increase the minute respiratory volume to more than 200 L/min.
Step-by-Step Understanding of Maximum Value
Given:
- Tidal Volume ≈ 4600 mL
- Respiratory Rate ≈ 50 breaths/min
Formula
MRV = TV × RR
Substitute
MRV = 4600 × 50
Multiply
MRV = 230,000 mL/min
Convert to liters
230,000 mL = 230 L/min
Final Answer
Maximum Minute Respiratory Volume ≈ 230 L/min
This is greater than 200 L/min, as mentioned in the text.
Comparison
| Condition | Tidal Volume | Respiratory Rate | Minute Respiratory Volume |
|---|---|---|---|
| Normal | 500 mL | 12 breaths/min | 6 L/min |
| Very Low | — | 2–4 breaths/min | 1.5 L/min |
| Maximum | 4600 mL | 50 breaths/min | 230 L/min (>200 L/min) |
Key Concept
- Minute Respiratory Volume (MRV) = Tidal Volume (TV) × Respiratory Rate (RR)
- Normal: 500 mL × 12 = 6000 mL = 6 L/min
- Higher tidal volume or higher respiratory rate increases the minute respiratory volume.
- Maximum breathing can produce more than 200 L/min, but most people can sustain only about half to two-thirds of this level for longer than 1 minute.
ALVEOLAR VENTILATION
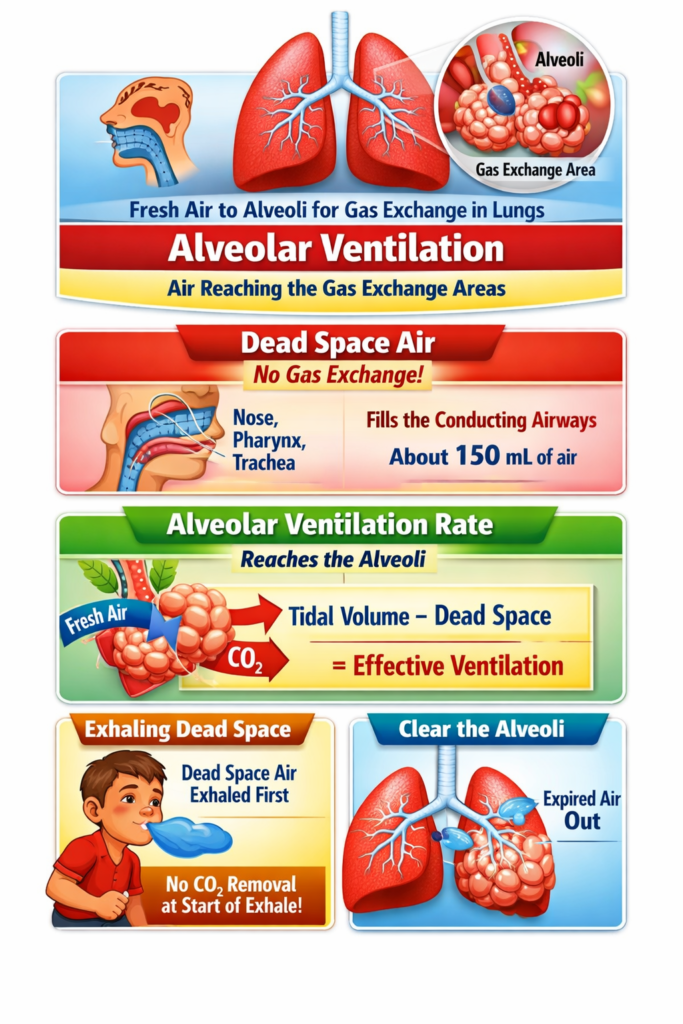
- The main purpose of pulmonary ventilation is to continuously replace the air in the gas exchange areas of the lungs.
- In these areas, air is very close to the pulmonary blood, allowing gas exchange.
- The gas exchange areas include:
- Alveoli
- Alveolar sacs
- Alveolar ducts
- Respiratory bronchioles
- The rate at which fresh air reaches these gas exchange areas is called the alveolar ventilation rate.
Dead Space and Its Effect on Alveolar Ventilation
- Some of the air we breathe does not reach the gas exchange areas.
- Instead, it remains in the conducting airways, where gas exchange does not occur.
- These airways include:
- Nose
- Pharynx
- Trachea
- This air is called dead space air.
- Dead space air does not take part in gas exchange, so it is not useful for exchanging oxygen and carbon dioxide.
- During expiration, dead space air leaves the lungs first.
- Air from the alveoli is exhaled only after the dead space air has been expelled.
- Therefore, dead space reduces the efficiency of removing gases from the lungs during expiration.
Key Concept
- Pulmonary ventilation keeps the gas exchange areas supplied with fresh air.
- Alveolar ventilation rate is the amount of fresh air reaching the alveoli, alveolar sacs, alveolar ducts, and respiratory bronchioles.
- Dead space air remains in the nose, pharynx, and trachea and does not participate in gas exchange.
- During expiration, dead space air is exhaled first, followed by alveolar air.
- Dead space decreases the efficiency of gas exchange by delaying the removal of alveolar air.
Measurement of Dead Space Volume
Figure: Fig. 38.7
- Dead space volume can be measured using a simple oxygen–nitrogen method.
- The method is illustrated in Fig. 38.7.
Procedure for Measuring Dead Space Volume
- The person takes a deep breath of 100% oxygen (O₂).
- This fills the entire dead space with pure oxygen.
- Some oxygen also mixes with the alveolar air, but it does not completely replace it.
- The person then breathes out through a nitrogen meter.
- The nitrogen meter continuously records the nitrogen concentration during expiration.
What Happens During Expiration?
Formula for Dead Space Volume
FormulaVD=Gray Area + Pink AreaGray Area×VE
What Each Symbol Means
Easy Concept
Think of the expired air as two parts:
- Gray Area = Dead space air (pure oxygen, no nitrogen)
- Pink Area = Alveolar air (contains nitrogen)
The formula calculates:
Dead Space = (Dead Space Portion ÷ Total Expired Air Portion) × Total Expired Volume
Step-by-Step Calculation
Given
- Gray Area = 30 cm²
- Pink Area = 70 cm²
- Total Expired Volume (VE) = 500 mL
Step 1: Add the Gray and Pink Areas
30+70=100
Total graph area = 100 cm²
Step 2: Find the Fraction Representing Dead Space
10030=0.3
This means 30% of the expired air is dead space air.
Step 3: Multiply by the Total Expired Volume
0.3×500=150 mL
Final Answer
VD=150 mL
Normal Dead Space Volume
- In a healthy young man, the normal dead space volume is about 150 mL.
- Dead space volume increases with:
- Body size
- Height
- Lung size
- Women usually have a smaller dead space volume because their airways are generally smaller.
- Dead space volume increases slightly after 50–60 years of age.
Anatomical Dead Space
- Anatomical dead space is the air present in the conducting airways.
- It includes all respiratory passages except the alveoli and other gas exchange areas.
- This air does not participate in gas exchange.
Physiological Dead Space
- Sometimes, some alveoli do not function properly because blood flow through nearby pulmonary capillaries is absent or reduced.
- These nonfunctional or partially functional alveoli also act as dead space.
- When alveolar dead space is added to anatomical dead space, it is called physiological dead space.
Anatomical vs Physiological Dead Space
| Anatomical Dead Space | Physiological Dead Space |
|---|---|
| Includes only the conducting airways | Includes conducting airways plus nonfunctional alveoli |
| Measured by the oxygen–nitrogen method | Includes anatomical dead space and alveolar dead space |
| Nearly equal to physiological dead space in healthy lungs | Can become much larger in lung disease |
Physiological Dead Space in Health and Disease
- In healthy lungs, anatomical dead space ≈ physiological dead space because all alveoli are functional.
- In lung disease, many alveoli may become partially functional or nonfunctional.
- As a result, physiological dead space can become up to 10 times greater than anatomical dead space.
- It may increase to 1–2 liters.
Key Concept
- Dead space volume is measured using the oxygen–nitrogen method shown in Fig. 38.7.
- During expiration:
- Dead space air (pure O₂) comes out first.
- Alveolar air (contains nitrogen) comes out later.
- Dead Space Formula: VD = (Gray Area ÷ (Gray Area + Pink Area)) × VE
- Example:
- Gray Area = 30
- Pink Area = 70
- VE = 500 mL
- VD = (30 ÷ 100) × 500 = 150 mL
- Normal dead space volume = 150 mL in a healthy young man.
- Anatomical dead space includes only the conducting airways.
- Physiological dead space includes the conducting airways plus nonfunctional alveoli.
- In healthy lungs, anatomical and physiological dead spaces are nearly equal.
- In lung disease, physiological dead space may increase to 1–2 liters.
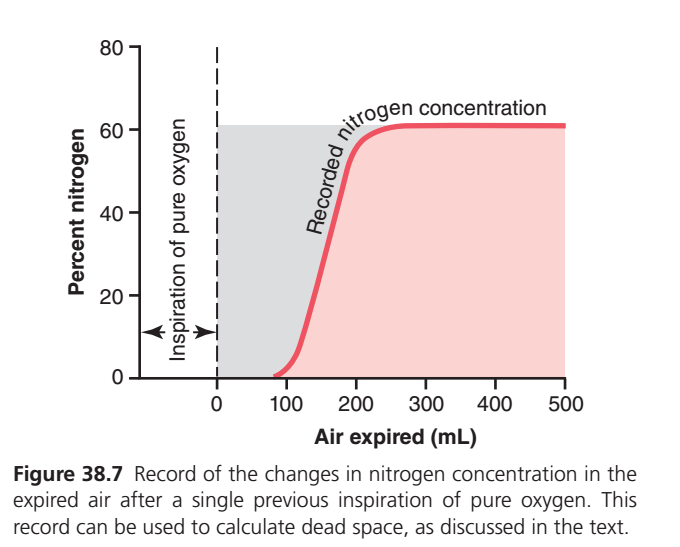
This figure (Guyton Physiology Fig. 38.7) is one of the most important graphs for understanding Anatomical Dead Space. Most students memorize it without understanding why the curve looks this way. Once you understand where each milliliter (mL) of expired air comes from, the graph becomes very easy. Concept of this the Graph
Imagine you take one deep breath of 100% pure oxygen.
Step 1
Normally the lungs contain:
- Oxygen (O₂)
- Nitrogen (N₂)
- Carbon dioxide (CO₂)
But after inhaling pure oxygen, the air inside your conducting airways (dead space) becomes almost 100% oxygen.
That means:
Dead space air contains almost NO nitrogen.
However,
The alveoli still contain nitrogen because it cannot disappear immediately.
So after one inspiration of pure oxygen we have:
| Part of respiratory tract | Nitrogen present? |
|---|---|
| Nose, trachea, bronchi (Dead space) | Almost 0% |
| Alveoli | About 60% |
This difference creates the graph.
Understanding the Axes
Y-axis (Vertical)
Percent Nitrogen (%)
This tells us
How much nitrogen is present in the expired air.
Higher point = more nitrogen.
Lower point = less nitrogen.
X-axis (Horizontal)
Air expired (mL)
This tells us
How much air has come out during expiration.
Example
0 mL → expiration just started
100 mL → first 100 mL expired
200 mL → next air expired
500 mL → almost the whole tidal volume expired
Now Understand the Graph Step by Step
① Left Side (Before Expiration)
The dotted vertical line at 0 mL
This marks
The exact moment expiration begins.
Nothing has come out yet.
② Dashed Vertical Line
This simply marks the starting point of expiration.
Everything to the left represents the previous inspiration.
③ Arrow
“Inspiration of pure oxygen”
⬅➡
This reminds you that
Just before expiration,
the person inhaled 100% oxygen.
This is the reason nitrogen becomes temporarily absent from the conducting airways.
④ Red Curve Starts Near Zero Nitrogen
At about 0–100 mL expired
Notice the curve stays almost at 0% nitrogen.
Why?
Because
The first expired air comes only from
- Nose
- Pharynx
- Larynx
- Trachea
- Bronchi
These are conducting airways.
They contain the oxygen that was inhaled.
Since this air is almost pure oxygen,
Nitrogen ≈ 0%
Therefore
The graph begins at zero.
Clinical Meaning
This first expired air never reached alveoli.
It did not participate in gas exchange.
This volume is called
Anatomical Dead Space
⑤ Why Does the Curve Suddenly Rise?
Around 100–200 mL
The curve rises very rapidly.
This is the most important part.
Now alveolar air begins mixing with dead-space air.
Remember
Alveolar air still contains nitrogen.
So now expiration contains
- Dead-space oxygen
- Alveolar air with nitrogen
Because nitrogen-rich alveolar air is entering the expired air,
Nitrogen concentration rises rapidly.
Think of mixing:
Glass A = Pure water
Glass B = Colored juice
At first you pour only water.
Then you start pouring juice.
Color suddenly increases.
Exactly the same happens here.
⑥ Why Is the Curve S-Shaped?
The increase is not perfectly vertical because
Initially,
only a small amount of alveolar air mixes with dead-space air.
Then
More alveolar air enters.
Finally
Almost all expired air becomes alveolar air.
So nitrogen increases gradually,
then rapidly,
then slowly.
That produces the classic S-shaped curve.
⑦ Plateau (Flat Part)
After about 200–250 mL
The graph becomes almost horizontal.
Why?
Now almost every breath coming out is
Alveolar air
Since alveolar nitrogen concentration remains nearly constant,
Nitrogen no longer increases.
So the graph becomes flat.
This flat region is called the
Alveolar Plateau
Why Is the Plateau Around 60%?
Normal alveolar air contains approximately
- Oxygen ≈ 104 mmHg
- Carbon dioxide ≈ 40 mmHg
- Water vapor
- Nitrogen ≈ 569 mmHg
Nitrogen therefore forms roughly
60–75% of alveolar gas.
So after dead-space air has been washed out,
expired air reaches about 60% nitrogen.
Understanding the Shaded Areas
There are two shaded regions.
Gray Shaded Area
This is the upper-left shaded region.
It represents
The nitrogen that could have been present if alveolar air had been expired immediately.
But during early expiration,
dead-space air contains almost no nitrogen.
So this nitrogen is “missing.”
Clinical Meaning
The gray area represents
Nitrogen absent because dead-space air comes out first.
This area is used in the Fowler method to calculate anatomical dead space.
Pink Shaded Area
This is the area under the red curve.
It represents
The actual nitrogen measured in expired air.
Early expiration
Very little nitrogen
Later expiration
Much more nitrogen
Why Are Both Shaded Areas Important?
Imagine
If there were no dead space
The expired air would immediately contain 60% nitrogen.
The graph would look like this:
60%
│──────────────
│
│
│
└──────────────
But because dead space exists,
nitrogen appears late.
So the curve shifts to the right.
The missing nitrogen (gray area) exactly balances the extra nitrogen appearing later (pink area).
This equality is used to determine anatomical dead space.
What Does the Red Curve Mean?
The red curve shows
The nitrogen concentration in expired air at every moment during expiration.
Early expiration
↓
Air comes from dead space
↓
Nitrogen ≈ 0%
↓
Middle expiration
↓
Mixed dead-space + alveolar air
↓
Nitrogen rises rapidly
↓
Late expiration
↓
Pure alveolar air
↓
Nitrogen reaches a constant plateau
Easy Story to Remember
Imagine a long pipe connected to a balloon.
- Pipe = Conducting airways (dead space)
- Balloon = Alveoli
You fill the pipe with pure oxygen.
The balloon still contains nitrogen-rich air.
Now squeeze the balloon.
First
Only oxygen from the pipe comes out.
➡ Nitrogen = 0%
Next
Oxygen from the pipe mixes with air from the balloon.
➡ Nitrogen begins to rise.
Finally
Only balloon air comes out.
➡ Nitrogen becomes constant (~60%).
That is exactly what the graph shows.
High-Yield MBBS Points
- Y-axis: Percentage of nitrogen in expired air.
- X-axis: Volume of expired air (mL).
- 0–100 mL: Dead-space air → almost 0% nitrogen.
- 100–200 mL: Mixed dead-space and alveolar air → nitrogen rises rapidly.
- After ~200 mL: Mostly alveolar air → nitrogen reaches a plateau (~60%).
- Gray shaded area: Missing nitrogen due to dead-space air; used in the Fowler method to estimate anatomical dead space.
- Pink shaded area: Actual nitrogen measured in expired air.
- Key concept: After inhaling pure oxygen, the conducting airways contain almost no nitrogen, while the alveoli still contain nitrogen. During expiration, dead-space air exits first, followed by alveolar air, creating the characteristic S-shaped nitrogen washout curve.
RATE OF ALVEOLAR VENTILATION
- Alveolar ventilation per minute is the total amount of fresh air entering the alveoli and nearby gas exchange areas in one minute.
- It is calculated by multiplying the respiratory rate by the amount of fresh air that actually reaches the alveoli with each breath.
Formula
VA = Freq × (VT − VD)
What Each Symbol Means
- VA = Alveolar ventilation per minute
- Freq = Respiratory rate (breaths per minute)
- VT = Tidal volume (air taken in with one normal breath)
- VD = Physiological dead space volume (air that does not participate in gas exchange)
Easy Concept
Think of each breath as carrying 500 mL of air.
However,
- Not all 500 mL reaches the alveoli.
- 150 mL stays in the dead space (nose, pharynx, trachea, etc.).
- Only the remaining air reaches the alveoli for gas exchange.
So,
Fresh air reaching alveoli in one breath = Total breath − Dead space air
Then,
Alveolar ventilation = Fresh alveolar air per breath × Number of breaths per minute
Step-by-Step Calculation
Given
- Respiratory Rate (Freq) = 12 breaths/min
- Tidal Volume (VT) = 500 mL
- Dead Space Volume (VD) = 150 mL
Step 1: Write the Formula
VA = Freq × (VT − VD)
Step 2: Calculate the Fresh Air Reaching the Alveoli in One Breath
VT − VD
= 500 − 150
= 350 mL
Meaning:
Out of 500 mL inhaled,
- 150 mL remains in the dead space
- 350 mL reaches the alveoli
Step 3: Multiply by the Respiratory Rate
VA = 12 × 350
Step 4: Multiply
VA = 4200 mL/min
Step 5: Convert to Liters
4200 mL = 4.2 L/min
Final Answer
Alveolar Ventilation = 4200 mL/min (4.2 L/min)
Easy Visualization
In One Breath
500 mL Inhaled Air
│
├── 150 mL → Dead Space
│             (No gas exchange)
│
└── 350 mL → Alveoli
              (Gas exchange occurs)
In One Minute
350 mL reaches alveoli in one breath
            ×
12 breaths/min
            │
            ▼
4200 mL/min
Why Do We Subtract Dead Space?
Because dead space air never reaches the alveoli.
Only the air that actually enters the alveoli can:
- Deliver oxygen (O₂) to the blood.
- Remove carbon dioxide (CO₂) from the blood.
Therefore,
Dead space air must be subtracted before calculating alveolar ventilation.
Importance of Alveolar Ventilation
- Alveolar ventilation is one of the main factors controlling the oxygen and carbon dioxide levels in the alveoli.
- Therefore, discussions of gas exchange mainly focus on alveolar ventilation.
Key Concept
- Alveolar Ventilation (VA) = Respiratory Rate × (Tidal Volume − Dead Space Volume)
- Formula:
- VA = Freq × (VT − VD)
- Normal Values:
- VT = 500 mL
- VD = 150 mL
- Respiratory Rate = 12 breaths/min
- Step 1: Air reaching alveoli per breath = 500 − 150 = 350 mL
- Step 2: Alveolar ventilation = 12 × 350 = 4200 mL/min = 4.2 L/min
- Only the air reaching the alveoli participates in gas exchange.
- Dead space air does not participate in gas exchange and must be subtracted from the tidal volume.
MADE BY SELF LEARNING CEO AND FOUNDER DR SHEEN
