


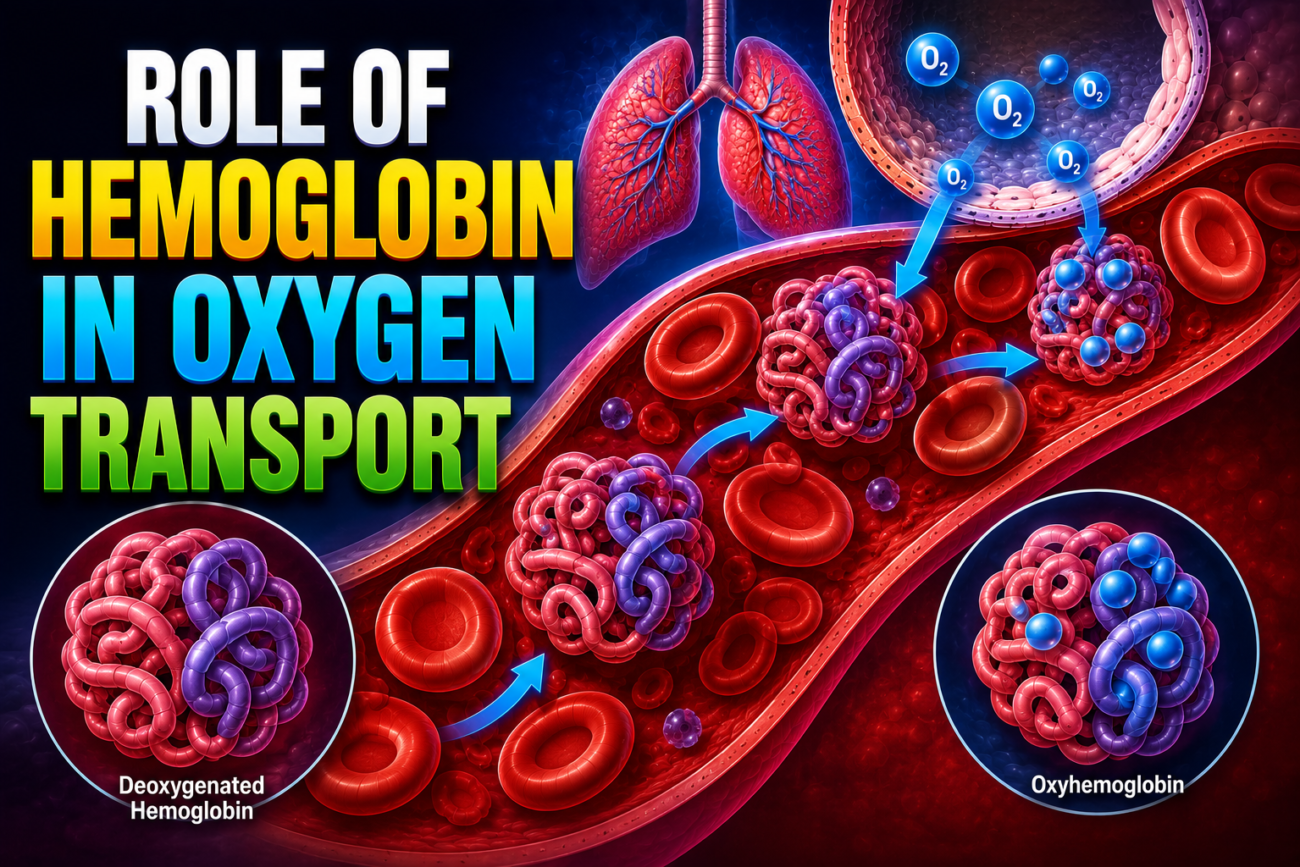
- Normally, about 97% of oxygen (O₂) is transported from the lungs to the tissues bound to hemoglobin inside red blood cells.
- The remaining 3% of oxygen is transported dissolved in the plasma and the water inside blood cells.
- Therefore, under normal conditions, almost all oxygen is carried by hemoglobin.
Reversible Combination of O₂ With Hemoglobin
- The O₂ molecule binds loosely and reversibly to the heme part of hemoglobin.
- When PO₂ is high, as in the pulmonary capillaries:
- O₂ binds to hemoglobin.
- When PO₂ is low, as in the tissue capillaries:
- O₂ is released from hemoglobin.
- This reversible binding and release is the main mechanism by which oxygen is transported from the lungs to the tissues.
Easy Concept
Think of hemoglobin as an oxygen taxi 🚕.
In the lungs (High PO₂):
High PO₂
      ↓
Hemoglobin picks up O₂
➡️ Hemoglobin becomes loaded with oxygen.
In the tissues (Low PO₂):
Low PO₂
      ↓
Hemoglobin releases O₂
➡️ Oxygen enters the cells where it is needed.
Easy Memory Trick
High PO₂ = Hemoglobin HOLDS O₂
Low PO₂  = Hemoglobin LETS GO of O₂
KEY CONCEPT
- Hemoglobin carries about 97% of the body’s oxygen. It binds oxygen in the lungs where PO₂ is high and releases oxygen in the tissues where PO₂ is low, making oxygen transport efficient and reversible.
Oxygen-Hemoglobin Dissociation Curve
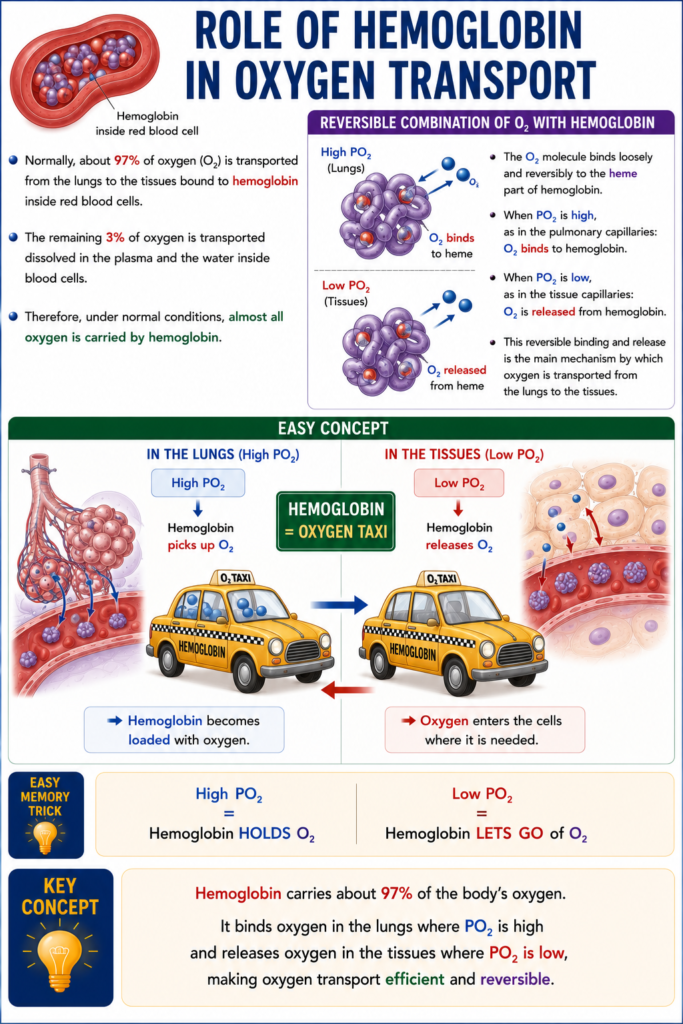
- Fig. 41.8 shows the oxygen-hemoglobin (O₂-Hb) dissociation curve.
- The curve shows how the percentage of hemoglobin bound with oxygen changes as blood PO₂ changes.
- The percentage of hemoglobin carrying oxygen is called the percent saturation of hemoglobin.
- As blood PO₂ increases, more oxygen binds to hemoglobin.
- As blood PO₂ decreases, less oxygen remains bound to hemoglobin.
- Blood leaving the lungs and entering the systemic arteries usually has:
- PO₂ = 95 mm Hg
- Hemoglobin saturation = about 97%
- Normal venous blood returning from the body tissues has:
- PO₂ = 40 mm Hg
- Hemoglobin saturation = about 75%
Fig. 41.8
- Arterial blood:
- PO₂ = 95 mm Hg
- Hemoglobin saturation ≈ 97%
- Venous blood:
- PO₂ = 40 mm Hg
- Hemoglobin saturation ≈ 75%
Easy Concept
Think of hemoglobin as a bus carrying oxygen passengers.
In the Lungs
PO₂ = 95 mm Hg

Bus is almost FULL- About 97% of hemoglobin seats are occupied by oxygen.
In the Tissues
PO₂ = 40 mm Hg

Bus drops passengers- Hemoglobin keeps only 75% of its oxygen.
- About 25% of the oxygen has been unloaded to the tissues.
Easy Memory Table
| Blood Location | PO₂ | Hemoglobin Saturation |
|---|---|---|
| Systemic arteries | 95 mm Hg | 97% |
| Systemic veins | 40 mm Hg | 75% |
What Does the Dissociation Curve Tell Us?
- High PO₂ → High hemoglobin saturation → More O₂ binds to hemoglobin.
- Low PO₂ → Low hemoglobin saturation → More O₂ is released to the tissues.
KEY CONCEPT
- The oxygen-hemoglobin dissociation curve shows that hemoglobin binds more oxygen as PO₂ increases and releases oxygen as PO₂ decreases. At a PO₂ of 95 mm Hg, hemoglobin is about 97% saturated, while at a PO₂ of 40 mm Hg, it is about 75% saturated.
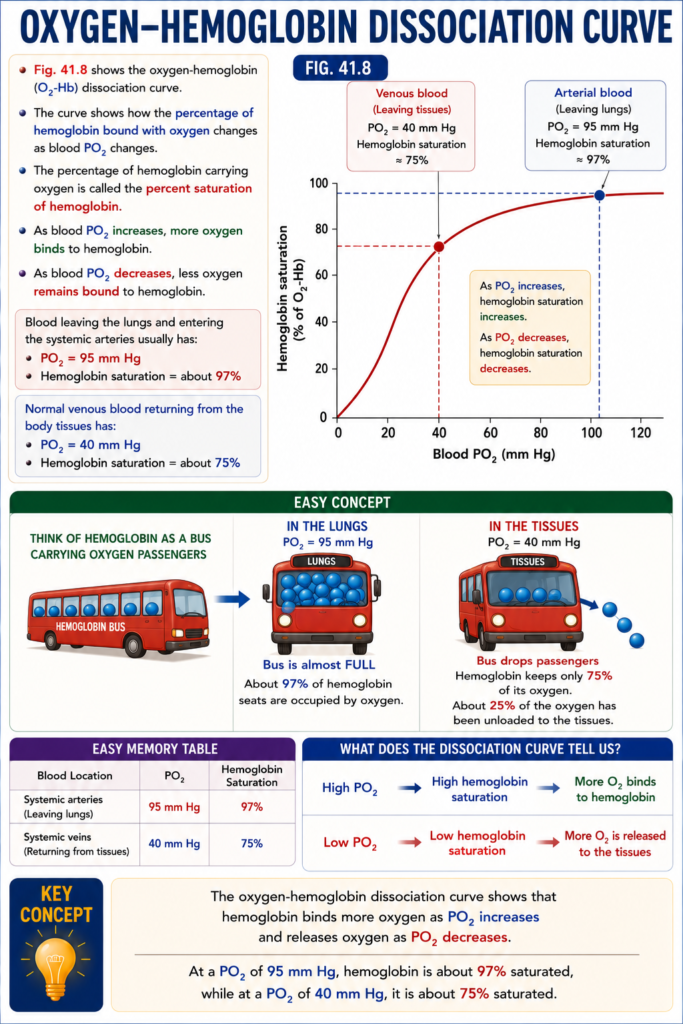
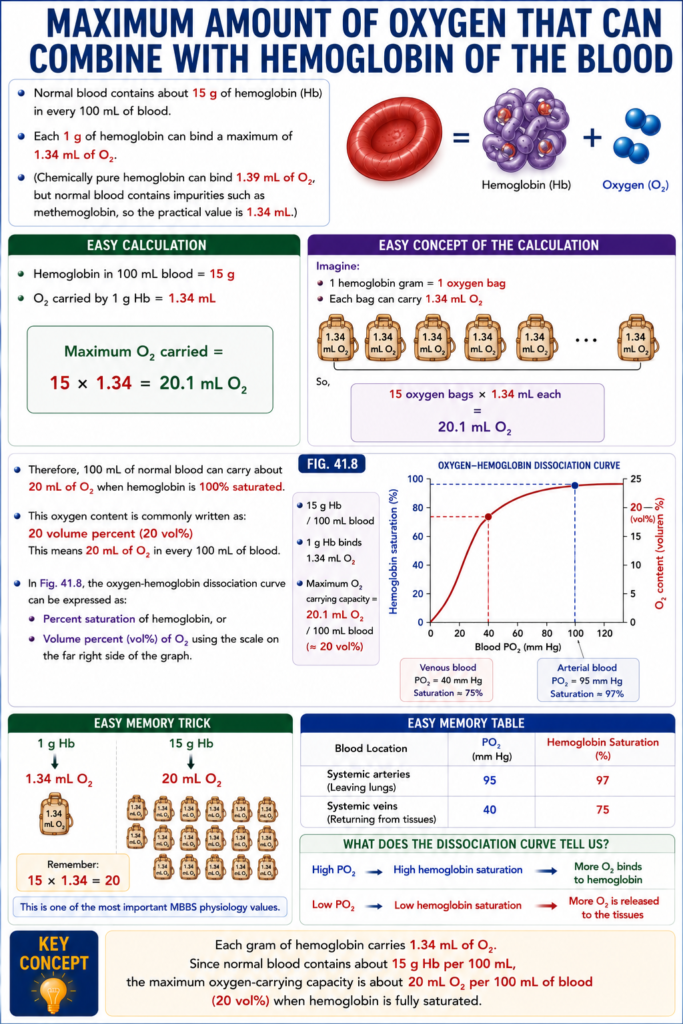
Maximum Amount of Oxygen That Can Combine With Hemoglobin of the Blood
- Normal blood contains about 15 g of hemoglobin (Hb) in every 100 mL of blood.
- Each 1 g of hemoglobin can bind a maximum of 1.34 mL of O₂.
- (Chemically pure hemoglobin can bind 1.39 mL of O₂, but normal blood contains impurities such as methemoglobin, so the practical value is 1.34 mL.)
Easy Calculation
- Hemoglobin in 100 mL blood = 15 g
- O₂ carried by 1 g Hb = 1.34 mL
Maximum O₂ carried =
15 × 1.34 = 20.1 mL O₂
Easy Concept of the Calculation
Imagine:
- 1 hemoglobin gram = 1 oxygen bag
- Each bag can carry 1.34 mL O₂
So,
15 oxygen bags × 1.34 mL each
=
20.1 mL O₂
Therefore:
- 100 mL of normal blood can carry about 20 mL of O₂ when hemoglobin is 100% saturated.
- This oxygen content is commonly written as:
- 20 volume percent (20 vol%)
- This means 20 mL of O₂ in every 100 mL of blood.
- In Fig. 41.8, the oxygen-hemoglobin dissociation curve can be expressed as:
- Percent saturation of hemoglobin, or
- Volume percent (vol%) of O₂ using the scale on the far right side of the graph.
Fig. 41.8
- 15 g Hb / 100 mL blood
- 1 g Hb binds 1.34 mL O₂
- Maximum O₂ carrying capacity = 20.1 mL O₂ / 100 mL blood (≈20 vol%)
Easy Memory Trick
1 g Hb
   ↓
1.34 mL O₂

15 g Hb
   ↓
20 mL O₂
Remember:
15 × 1.34 = 20
This is one of the most important MBBS physiology values.
KEY CONCEPT
- Each gram of hemoglobin carries 1.34 mL of O₂. Since normal blood contains about 15 g Hb per 100 mL, the maximum oxygen-carrying capacity is about 20 mL O₂ per 100 mL of blood (20 vol%) when hemoglobin is fully saturated.
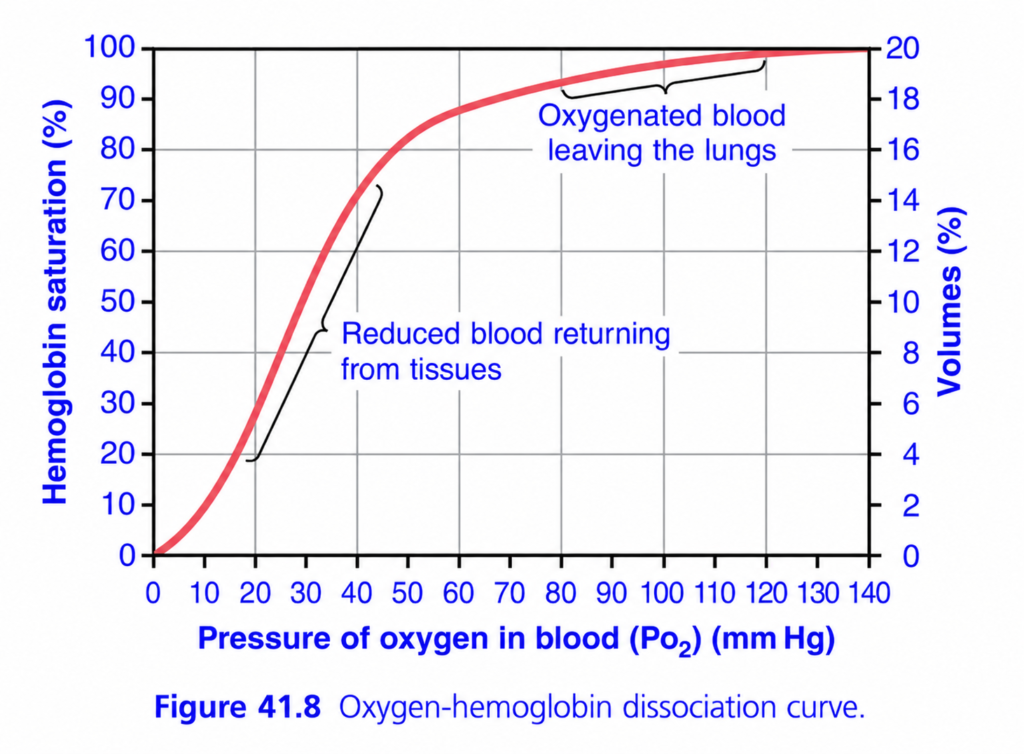
This is Figure 41.8 from Guyton Physiology, one of the most important graphs in physiology.
It is called the Oxygen-Hemoglobin (O₂-Hb) Dissociation Curve.
This graph explains:
- How much oxygen hemoglobin binds in the lungs
- How much oxygen hemoglobin releases in the tissues
- Why the curve is S-shaped (sigmoid)
- Why oxygen loading and unloading are so efficient
This graph is one of the most frequently asked in MBBS exams, USMLE, MRCP, and NEET-PG.
Figure 41.8: Oxygen-Hemoglobin Dissociation Curve
⭐ One-Line Concept
As blood PO₂ increases, hemoglobin binds more oxygen (saturation increases). As blood PO₂ decreases, hemoglobin releases oxygen to the tissues.
Simply,
High PO₂ → Hemoglobin loads oxygen
Low PO₂ → Hemoglobin unloads oxygen
Step 1: Understand the Axes
X-Axis (Horizontal)
Pressure of Oxygen in Blood (PO₂)
This is the partial pressure of oxygen dissolved in blood.
It tells us
How much oxygen is available for hemoglobin to bind.
Starts from
0 mmHg
↓
140 mmHg
Easy Concept
Move to the right
↓
More oxygen available
Move to the left
↓
Less oxygen available
Left Y-Axis
Hemoglobin Saturation (%)
This tells us
What percentage of hemoglobin molecules are carrying oxygen.
Examples
0%
↓
No oxygen attached
50%
↓
Half the hemoglobin molecules carry oxygen
100%
↓
Almost every hemoglobin molecule carries oxygen
Right Y-Axis
Oxygen Content (Volumes %)
This represents
The total amount of oxygen carried in blood.
Remember
100 mL blood normally carries about 20 mL oxygen.
Therefore
100% saturation
≈
20 mL O₂/100 mL blood
Understanding the Red Curve
Look carefully.
The curve is
NOT straight.
It has an
S shape
called a
Sigmoid Curve.
This is the most important feature.
Why Is the Curve S-Shaped?
This occurs because of
Cooperative Binding
Hemoglobin has
4 oxygen-binding sites.
When the first oxygen binds,
it is slightly difficult.
Once it binds,
the second oxygen binds more easily.
Then
the third binds even more easily.
Finally
the fourth binds most easily.
This is called
Positive Cooperativity.
Easy Analogy
Imagine
Four friends climbing into a bus.
The first person struggles to enter.
Once inside,
he helps the second.
Then two help the third.
Then three help the fourth.
Exactly the same happens with oxygen.
Divide the Curve into Three Parts
The easiest way is to divide it into
1. Lower Steep Part
PO₂
0–20 mmHg
What Happens?
Very little oxygen is attached.
Hemoglobin saturation remains low.
Why?
Very little oxygen is available.
Hemoglobin cannot bind much oxygen.
Clinical Example
Severe hypoxia
2. Middle Steep Portion
Approximately
20–60 mmHg
This is the most important part.
Why Is It So Steep?
A very small increase in PO₂ causes a huge increase in oxygen binding.
Example
PO₂
20
↓
40
Saturation increases dramatically.
Why Is This Good?
Because
when tissues need oxygen,
even a small fall in PO₂ causes
a large release of oxygen.
This is called
Efficient Oxygen Unloading.
Look at the Label
Reduced blood returning from tissues
This part represents
Venous blood.
Normal Tissue Values
PO₂
≈40 mmHg
Hemoglobin saturation
≈75%
Meaning
Even after delivering oxygen,
hemoglobin still carries
about
75% of its oxygen.
Therefore
Hemoglobin releases
about
25%
of its oxygen
to resting tissues.
3. Upper Flat Portion
PO₂
60–140 mmHg
This represents
Blood inside the lungs.
Why Is It Flat?
Even if alveolar PO₂ changes slightly,
hemoglobin remains almost fully saturated.
Example
PO₂
100 mmHg
↓
Saturation
≈97%
PO₂
120 mmHg
↓
Saturation
≈99%
Very little difference.
Why Is This Important?
Suppose
A person climbs a mountain.
Alveolar PO₂ falls slightly.
Even then,
hemoglobin remains highly saturated.
This provides a safety margin.
Look at the Label
“Oxygenated blood leaving the lungs”
This is arterial blood.
Normal Lung Values
PO₂
≈100 mmHg
Hemoglobin Saturation
≈97%
Why Doesn’t Saturation Become 100%?
Because
a small amount of physiological shunt blood mixes with oxygenated blood.
Therefore,
arterial saturation is about
97%
instead of
100%.
Understanding Oxygen Content (Right Y-Axis)
Notice
100% saturation
=
20 volumes %
This means
100 mL blood carries
about
20 mL oxygen.
If saturation becomes
50%
Then
blood carries about
10 mL oxygen.
This is why
oxygen content
changes with saturation.
Important Point on the Curve
PO₂ = 100 mmHg
Normal arterial blood
Saturation
≈97%
PO₂ = 40 mmHg
Normal venous blood
Saturation
≈75%
What Does This Mean?
Suppose
Blood leaves lungs
with
100 oxygen molecules.
After supplying tissues,
it still contains
75 molecules.
Therefore,
25 molecules
were delivered.
Why Is This Useful?
Resting tissues need only about
25%
of oxygen carried by hemoglobin.
The remaining
75%
acts as a reserve.
During Exercise
Muscle PO₂ falls.
Maybe
40
↓
20 mmHg
Now look at the steep part.
Hemoglobin saturation falls dramatically.
Therefore,
much more oxygen is released.
Exactly what exercising muscles need.
Why Is the Plateau Important?
Imagine
Normal PO₂
100 mmHg
Now lung disease decreases it to
80 mmHg.
Hemoglobin saturation remains around
95%.
Very little oxygen is lost.
Thus,
the plateau protects oxygen loading in the lungs.
Why Is the Steep Part Important?
Imagine
Tissue PO₂ falls
40
↓
30 mmHg
A small decrease in PO₂
causes
a large release of oxygen.
Thus,
the steep portion protects tissues.
Compare the Two Parts
| Flat Upper Part | Steep Lower Part |
|---|---|
| Represents lungs | Represents tissues |
| Oxygen loading | Oxygen unloading |
| PO₂ 60–140 mmHg | PO₂ 20–60 mmHg |
| Saturation changes very little | Saturation changes rapidly |
| Safety margin for oxygen loading | Efficient oxygen delivery |
Clinical Correlation
1. Exercise
Muscles consume much more oxygen.
Tissue PO₂ falls.
Hemoglobin releases much more oxygen because blood is on the steep part of the curve.
2. High Altitude
Alveolar PO₂ decreases.
Because arterial blood is on the flat plateau, hemoglobin saturation decreases only slightly at first.
This helps maintain oxygen delivery.
3. Severe Lung Disease
If arterial PO₂ falls below 60 mmHg, the curve enters the steep region.
Now a small fall in PO₂ causes a large fall in hemoglobin saturation, leading to hypoxemia.
High-Yield MBBS Viva Points
| Parameter | Normal Value |
|---|---|
| Normal arterial PO₂ | ≈100 mmHg |
| Arterial Hb saturation | ≈97% |
| Normal venous PO₂ | ≈40 mmHg |
| Venous Hb saturation | ≈75% |
| Oxygen released to resting tissues | ≈25% of Hb-bound oxygen |
| Maximum oxygen content | ≈20 mL O₂/100 mL blood |
Super Easy Memory Story
Imagine a bus with 4 seats:
- 🚌 Bus = Hemoglobin
- 👨👩👧👦 Passengers = Oxygen molecules
In the lungs (Upper flat part)
Many passengers are waiting.
The bus becomes almost completely full.
➡️ 97–100% saturation
In resting tissues (Middle steep part)
About one-quarter of the passengers get off.
➡️ Saturation falls to ~75%
The tissues receive the oxygen they need.
During exercise
Many more passengers get off because the tissues demand more oxygen.
The steep part of the curve allows this to happen easily.
🎯 MBBS Golden Rule
| Region | PO₂ | What Happens? | Importance |
|---|---|---|---|
| Lower part (0–20 mmHg) | Very low | Minimal oxygen binding | Severe hypoxia |
| Steep part (20–60 mmHg) | Tissue range | Large oxygen unloading | Efficient oxygen delivery to tissues |
| Flat plateau (60–140 mmHg) | Lung range | Nearly full saturation | Protects oxygen loading in the lungs |
Final Concept to Never Forget
The S-shaped (sigmoid) oxygen-hemoglobin dissociation curve is perfectly designed for physiology:
- Flat upper plateau → Ensures hemoglobin stays almost fully saturated in the lungs, even if alveolar PO₂ falls moderately.
- Steep lower portion → Ensures hemoglobin releases large amounts of oxygen to tissues whenever tissue PO₂ decreases, such as during exercise or increased metabolic activity.
This unique shape allows the same hemoglobin molecule to load oxygen efficiently in the lungs and unload it efficiently in the tissues, making it one of the most elegant physiological adaptations in the human body.
Amount of Oxygen Released From Hemoglobin When Systemic Arterial Blood Flows Through Tissues
- Systemic arterial blood is about 97% saturated with oxygen.
- At this saturation, hemoglobin carries about 19.4 mL of O₂ per 100 mL of blood.
- As blood flows through the tissue capillaries, hemoglobin releases oxygen to the tissues.
- After passing through the tissues:
- PO₂ decreases to about 40 mm Hg.
- Hemoglobin saturation decreases to about 75%.
- O₂ content decreases to about 14.4 mL per 100 mL of blood.
Easy Calculation
- O₂ in arterial blood = 19.4 mL/100 mL
- O₂ in venous blood = 14.4 mL/100 mL
O₂ released to tissues =
19.4 − 14.4 = 5.0 mL O₂/100 mL blood
Easy Concept of the Calculation
Imagine hemoglobin as a delivery truck carrying oxygen.
Before reaching the tissues:
O₂ Load = 19.4 mLAfter leaving the tissues:
O₂ Remaining = 14.4 mLOxygen delivered:
19.4 − 14.4
= 5.0 mL O₂- Therefore, every 100 mL of blood delivers about 5 mL of oxygen to the tissues under normal resting conditions.
Fig. 41.9
- Arterial blood:
- PO₂ = 95 mm Hg
- Hb saturation = 97%
- O₂ content = 19.4 mL/100 mL blood
- Venous blood:
- PO₂ = 40 mm Hg
- Hb saturation = 75%
- O₂ content = 14.4 mL/100 mL blood
- O₂ delivered to tissues = 5 mL/100 mL blood
Easy Memory Trick
Lungs → 19.4 mL O₂

Tissues → 14.4 mL O₂

Difference = 5 mL O₂ delivered
Remember:
19.4 → 14.4 = 5
KEY CONCEPT
- As blood passes through the tissues, hemoglobin releases about 5 mL of O₂ for every 100 mL of blood. Oxygen content falls from 19.4 mL to 14.4 mL because hemoglobin saturation decreases from 97% to 75%.
Transport of Oxygen Is Markedly Increased During Strenuous Exercise
- During strenuous exercise, muscle cells use oxygen (O₂) much more rapidly.
- As a result, the muscle interstitial PO₂ decreases:
- From about 40 mm Hg
- To as low as 15 mm Hg
- At a PO₂ of 15 mm Hg, hemoglobin carries only about 4.4 mL of O₂ per 100 mL of blood.
Easy Calculation
- O₂ in arterial blood = 19.4 mL/100 mL
- O₂ remaining in venous blood during exercise = 4.4 mL/100 mL
O₂ delivered to muscles =
19.4 − 4.4 = 15 mL O₂/100 mL blood
Easy Concept of the Calculation
At rest:
Blood leaves lungs = 19.4 mL O₂

Blood leaves tissues = 14.4 mL O₂

Delivered = 5 mL O₂
During strenuous exercise:
Blood leaves lungs = 19.4 mL O₂

Blood leaves tissues = 4.4 mL O₂

Delivered = 15 mL O₂- Therefore, during exercise, each 100 mL of blood delivers about 15 mL of O₂ to the tissues.
- This is 3 times more oxygen than is delivered at rest.
- During strenuous exercise:
- Cardiac output can increase 6–7 times in well-trained marathon runners.
- Each 100 mL of blood carries 3 times more usable oxygen to the tissues.
Easy Overall Calculation
- Increase in cardiac output = 6–7 times
- Increase in O₂ delivered per 100 mL blood = 3 times
Total increase in oxygen transport =
6–7 × 3 ≈ 18–21 times
≈ 20-fold increase
- This allows the body to supply the large amount of oxygen needed during strenuous exercise.
- Other factors also help oxygen move into the muscles.
- Therefore, even during very heavy exercise, muscle tissue PO₂ usually falls only slightly below normal.
Fig. 41.9
- Normal arterial blood: 19.4 mL O₂/100 mL blood
- Normal venous blood: 14.4 mL O₂/100 mL blood
- Venous blood during exercise: 4.4 mL O₂/100 mL blood
- O₂ delivered during exercise: 15 mL/100 mL blood
KEY CONCEPT
- During strenuous exercise, muscles extract much more oxygen from the blood. Oxygen delivery increases from 5 mL to 15 mL per 100 mL of blood (3-fold). Combined with a 6–7-fold increase in cardiac output, total oxygen transport to the tissues can increase by about 20 times.
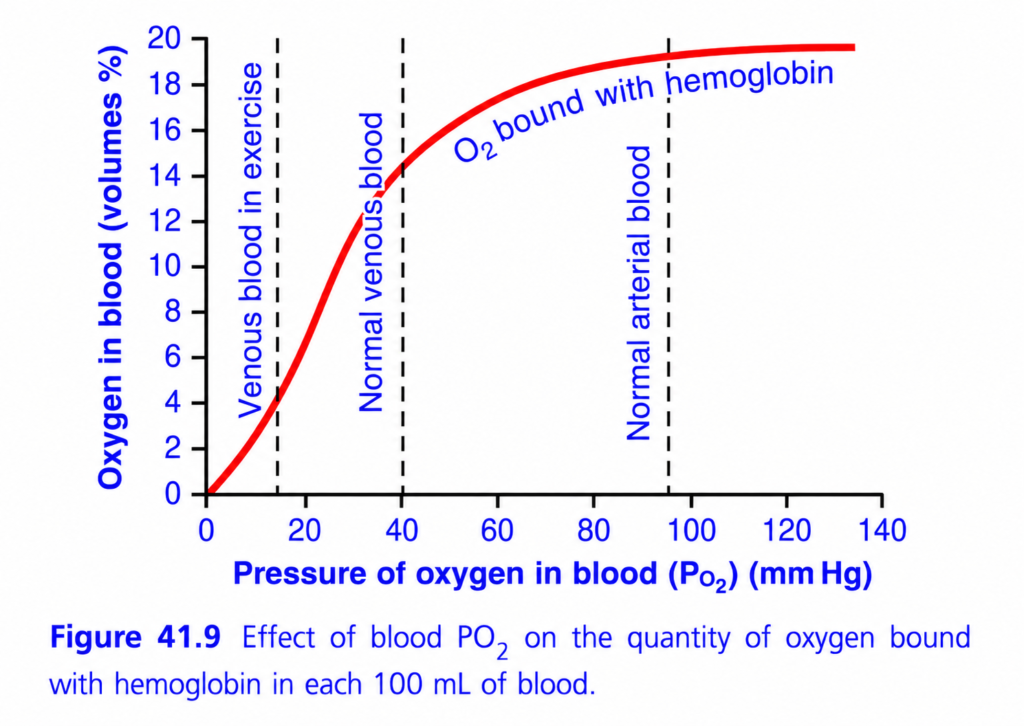
This is Figure 41.9 from Guyton Physiology, and it is actually another way of looking at the oxygen-hemoglobin dissociation curve (Figure 41.8).
The difference is:
- Figure 41.8 shows Hemoglobin Saturation (%) vs PO₂
- Figure 41.9 shows Actual Oxygen Content (mL O₂/100 mL blood) vs PO₂
So instead of asking:
“What percentage of hemoglobin is carrying oxygen?”
this graph asks:
“Exactly how many milliliters of oxygen are present in 100 mL of blood?”
Figure 41.9: Effect of Blood PO₂ on the Amount of Oxygen Bound to Hemoglobin
⭐ One-Line Concept
As blood PO₂ increases, more oxygen binds to hemoglobin, increasing the oxygen content of blood until hemoglobin becomes almost fully saturated (about 20 mL O₂/100 mL blood).
Step 1: Understand the Axes
X-Axis (Horizontal)
Pressure of Oxygen in Blood (PO₂)
This is the partial pressure of oxygen dissolved in blood.
It tells us
How much oxygen is available for hemoglobin.
Starts from
0 mmHg
↓
140 mmHg
Easy Memory
Move right
↓
More oxygen available
Move left
↓
Less oxygen available
Y-Axis (Vertical)
Oxygen in Blood (Volumes %)
This means
How many milliliters of oxygen are present in every 100 mL of blood.
Example
20 Vol%
=
20 mL oxygen
per
100 mL blood
Why Is Maximum About 20 mL?
Normal blood contains about
15 g hemoglobin/100 mL blood
Each gram of hemoglobin binds
1.34 mL O₂
So
15 × 1.34

≈20 mL O₂
Therefore
Maximum oxygen content
≈20 mL O₂/100 mL blood
Understanding the Red Curve
Notice
The curve is
S-shaped (sigmoid).
Exactly the same reason as Figure 41.8.
Because of
Cooperative binding of oxygen to hemoglobin.
Why Is the Curve Initially Flat?
Look at the left side.
PO₂
0–10 mmHg
Very little oxygen is available.
Very few oxygen molecules bind hemoglobin.
Therefore,
oxygen content increases slowly.
Why Does the Curve Become Very Steep?
Between
approximately
20–50 mmHg
Look carefully.
A small increase in PO₂
causes
a huge increase
in oxygen content.
Why?
Once the first oxygen molecule binds,
hemoglobin binds the next oxygen molecules much more easily.
Therefore,
oxygen content rises rapidly.
Why Does the Curve Flatten Again?
After about
60–70 mmHg,
most hemoglobin molecules are already carrying oxygen.
There are very few empty binding sites left.
Adding more oxygen produces only a tiny increase.
Therefore,
the curve becomes flat.
Three Important Vertical Dashed Lines
These are extremely important.
First Dashed Line
Venous Blood During Exercise
PO₂
≈15 mmHg
Why Is It So Low?
During heavy exercise,
muscles consume enormous amounts of oxygen.
Blood leaving muscles contains
very little oxygen.
Therefore,
venous PO₂ falls to about
15 mmHg.
Oxygen Content
Look at the graph.
Only about
4–5 mL oxygen
remains
per
100 mL blood.
Most oxygen has already been delivered to muscles.
Easy Memory
Heavy exercise
↓
Muscles use lots of oxygen
↓
Venous PO₂ becomes very low
↓
Hemoglobin releases much more oxygen.
Second Dashed Line
Normal Venous Blood
PO₂
≈40 mmHg
Oxygen Content
About
15 mL O₂/100 mL blood
remains.
What Does This Mean?
Blood originally carried
20 mL.
Now it contains
15 mL.
Therefore,
5 mL oxygen
has been delivered to tissues.
This is exactly
25%
of total oxygen.
Therefore
Normal tissues extract
approximately
5 mL oxygen
from every
100 mL blood.
Third Dashed Line
Normal Arterial Blood
PO₂
≈95–100 mmHg
Oxygen Content
Almost
20 mL O₂/100 mL blood.
This is oxygen-rich blood leaving the lungs.
Why Isn’t It Exactly 20?
Because
arterial hemoglobin saturation is about
97%.
A tiny physiological shunt prevents complete saturation.
Compare the Three Blood Samples
| Blood | PO₂ | Oxygen Content |
|---|---|---|
| Arterial blood | 95–100 mmHg | ≈20 mL/100 mL |
| Normal venous blood | 40 mmHg | ≈15 mL/100 mL |
| Venous blood during exercise | 15 mmHg | ≈4–5 mL/100 mL |
How Much Oxygen Is Delivered?
At Rest
Blood leaves lungs
↓
20 mL
Returns
↓
15 mL
Therefore
Delivered
↓
5 mL oxygen
per
100 mL blood.
During Heavy Exercise
Blood leaves lungs
↓
20 mL
Returns
↓
5 mL
Delivered
↓
15 mL oxygen
per
100 mL blood.
Notice
Exercise increases oxygen extraction
about
threefold.
Why Is This Important?
Suppose
Cardiac output remains the same.
Even then,
exercising muscles receive much more oxygen
because hemoglobin releases much more.
Understanding the Plateau
Look carefully.
Between
80
↓
100
↓
120 mmHg
Very little increase
in oxygen content.
Why?
Hemoglobin is already almost full.
Very few empty oxygen-binding sites remain.
Clinical Importance
Suppose
Alveolar PO₂ decreases
100
↓
80 mmHg.
Blood oxygen content changes only slightly.
This provides a
Safety Margin
for oxygen loading.
Understanding the Steep Portion
Now look
20
↓
40 mmHg.
Very large increase
in oxygen content.
Why Is This Important?
When tissue PO₂ falls slightly,
hemoglobin releases
large amounts
of oxygen.
This makes oxygen delivery highly efficient.
Easy Analogy
Imagine
A bus with
20 seats.
Lungs
Almost every seat is occupied.
↓
20 passengers.
Normal Tissues
Five passengers get off.
↓
15 passengers remain.
Exercising Muscle
Fifteen passengers get off.
↓
Only five remain.
Exactly the same as oxygen.
Clinical Correlation
1. Exercise
Venous PO₂ falls from
40
↓
15 mmHg.
Hemoglobin unloads much more oxygen.
This meets the increased oxygen demand of muscles.
2. High Altitude
Arterial PO₂ decreases.
Because of the plateau,
oxygen content decreases only slightly until PO₂ falls below about 60 mmHg.
3. Severe Lung Disease
When arterial PO₂ drops below 60 mmHg, oxygen content begins to fall rapidly because the curve enters the steep region.
High-Yield MBBS Viva Points
| Parameter | Normal Value |
|---|---|
| Maximum oxygen content | ≈20 mL O₂/100 mL blood |
| Normal arterial PO₂ | ≈95–100 mmHg |
| Arterial oxygen content | ≈20 mL/100 mL blood |
| Normal venous PO₂ | ≈40 mmHg |
| Venous oxygen content | ≈15 mL/100 mL blood |
| Oxygen delivered to resting tissues | ≈5 mL/100 mL blood |
| Venous PO₂ during heavy exercise | ≈15 mmHg |
| Oxygen remaining during heavy exercise | ≈4–5 mL/100 mL blood |
Comparison of the Three Dashed Lines
| Dashed Line | Blood Type | PO₂ | Oxygen Content | Physiological Meaning |
|---|---|---|---|---|
| Left | Venous blood during exercise | ≈15 mmHg | ≈4–5 mL/100 mL | Maximum oxygen extraction by active muscles |
| Middle | Normal venous blood | ≈40 mmHg | ≈15 mL/100 mL | Resting tissues have extracted about 5 mL O₂/100 mL blood |
| Right | Normal arterial blood | ≈95–100 mmHg | ≈20 mL/100 mL | Oxygen-rich blood leaving the lungs |
Relationship Between Figures 41.8 and 41.9
| Figure 41.8 | Figure 41.9 |
|---|---|
| Shows hemoglobin saturation (%) | Shows actual oxygen content (mL O₂/100 mL blood) |
| Y-axis = % saturation | Y-axis = Oxygen volume (%) |
| Helps understand oxygen loading and unloading | Helps calculate how much oxygen is actually transported |
Both graphs have the same sigmoid shape because both describe oxygen binding to hemoglobin.
🎯 Super Easy Memory Trick
Imagine a 20-liter water tank:
- 💧 Tank = Hemoglobin
- 💦 Water = Oxygen
🫁 In the lungs (Normal arterial blood)
The tank is almost completely full.
➡️ ≈20 mL O₂/100 mL blood
🚶 At resting tissues (Normal venous blood)
Only about 5 liters of water are used.
➡️ ≈15 mL O₂/100 mL blood remains
🏃 During heavy exercise
The tissues use almost all the water.
Only 4–5 liters remain.
➡️ ≈4–5 mL O₂/100 mL blood remains
🎓 MBBS Golden Rule
Remember these three numbers:
- Arterial blood: PO₂ ≈100 mmHg → ~20 mL O₂/100 mL blood
- Normal venous blood: PO₂ ≈40 mmHg → ~15 mL O₂/100 mL blood
- Exercise venous blood: PO₂ ≈15 mmHg → ~4–5 mL O₂/100 mL blood
These values explain how much oxygen hemoglobin actually carries and delivers under normal conditions and during exercise, which is the central message of Figure 41.9.
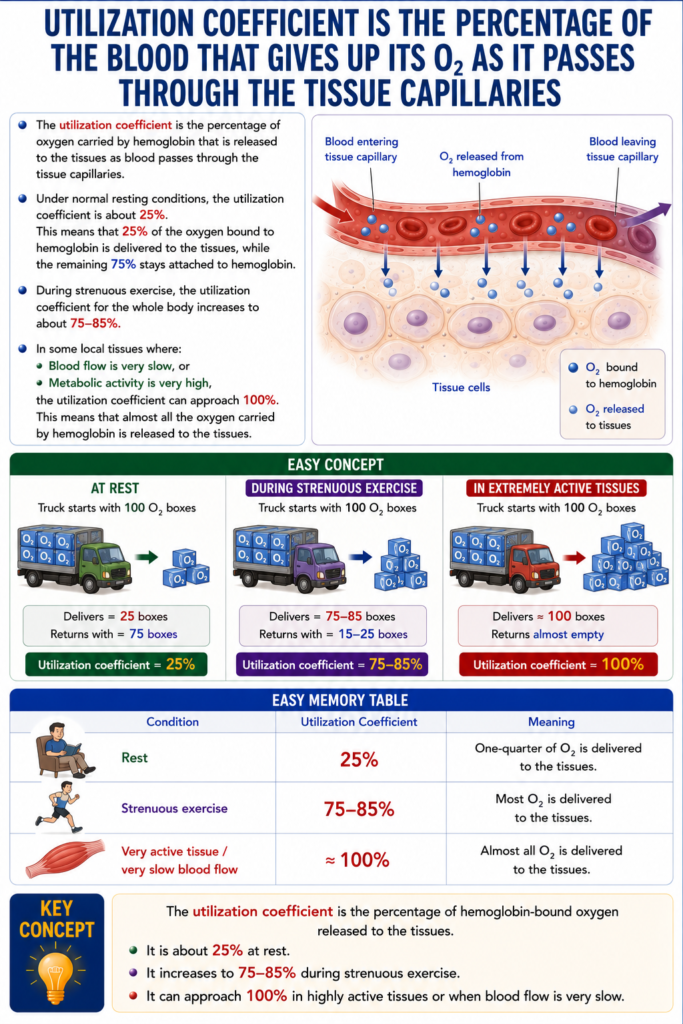
Utilization Coefficient Is the Percentage of the Blood That Gives Up Its O₂ as It Passes Through the Tissue Capillaries
- The utilization coefficient is the percentage of oxygen carried by hemoglobin that is released to the tissues as blood passes through the tissue capillaries.
- Under normal resting conditions, the utilization coefficient is about 25%.
- This means that 25% of the oxygen bound to hemoglobin is delivered to the tissues, while the remaining 75% stays attached to hemoglobin.
- During strenuous exercise, the utilization coefficient for the whole body increases to about 75–85%.
- In some local tissues where:
- Blood flow is very slow, or
- Metabolic activity is very high,
the utilization coefficient can approach 100%.
- This means that almost all the oxygen carried by hemoglobin is released to the tissues.
Easy Concept
Imagine hemoglobin as a delivery truck carrying 100 oxygen boxes.
At Rest
Truck starts with 100 O₂ boxes

Delivers = 25 boxes

Returns with = 75 boxes
Utilization coefficient = 25%
During Strenuous Exercise
Truck starts with 100 O₂ boxes

Delivers = 75–85 boxes

Returns with = 15–25 boxes
Utilization coefficient = 75–85%
In Extremely Active Tissues
Truck starts with 100 O₂ boxes

Delivers ≈100 boxes

Returns almost empty
Utilization coefficient ≈100%
Easy Memory Table
| Condition | Utilization Coefficient | Meaning |
|---|---|---|
| Rest | 25% | One-quarter of O₂ is delivered |
| Strenuous exercise | 75–85% | Most O₂ is delivered |
| Very active tissue / very slow blood flow | ≈100% | Almost all O₂ is delivered |
KEY CONCEPT
- The utilization coefficient is the percentage of hemoglobin-bound oxygen released to the tissues. It is about 25% at rest, increases to 75–85% during strenuous exercise, and can approach 100% in highly active tissues or when blood flow is very slow.
Hemoglobin “Buffers” Tissue PO₂
- Hemoglobin not only transports oxygen (O₂) but also acts as a tissue oxygen buffer.
- This buffering action helps keep the tissue PO₂ relatively stable.
- This function is essential for normal tissue oxygen supply.
Hemoglobin Helps Maintain Nearly Constant PO₂ in the Tissues
- Under normal resting conditions, the tissues need about 5 mL of O₂ from each 100 mL of blood.
- As shown in Fig. 41.9, releasing 5 mL of O₂ requires the blood PO₂ to fall to about 40 mm Hg.
- Therefore, tissue PO₂ normally remains around 40 mm Hg.
- If tissue PO₂ rises above 40 mm Hg:
- Hemoglobin releases less oxygen.
- The tissues would not receive the oxygen they need.
- Thus, hemoglobin sets an upper limit of about 40 mm Hg for tissue PO₂.
- During strenuous exercise, the tissues need much more oxygen (up to 20 times normal).
- Even then, tissue PO₂ decreases only slightly because:
- The oxygen-hemoglobin dissociation curve is very steep at low PO₂.
- Tissue blood flow increases when PO₂ falls.
- Therefore:
- A small decrease in PO₂ causes a large release of oxygen from hemoglobin.
- Increased blood flow delivers even more oxygen to the tissues.
- As a result, hemoglobin automatically keeps tissue PO₂ between about 15 and 40 mm Hg.
Fig. 41.9
- At rest:
- Tissue receives 5 mL O₂/100 mL blood
- Tissue PO₂ ≈ 40 mm Hg
- During exercise:
- Much more O₂ is released.
- Tissue PO₂ usually remains between 15–40 mm Hg.
Easy Concept
Imagine hemoglobin as a smart oxygen bank.
When tissues have enough oxygen
Tissue PO₂ = 40 mm Hg

Hemoglobin says:
"Don't release too much oxygen."
➡️ Tissue PO₂ stays stable.
When tissues need more oxygen (Exercise)
Tissue PO₂ falls slightly

Hemoglobin says:
"Release much more oxygen!"
➡️ A small fall in PO₂ causes a large increase in O₂ release.Why is Hemoglobin Called a Buffer?
Think of a water tank with an automatic valve.
- Water = Oxygen
- Tank = Hemoglobin
- House = Tissue
- If the house needs little water → the valve opens a little.
- If the house needs much more water → the valve opens much wider.
- The water pressure in the house remains fairly stable.
Similarly:
- Low tissue demand → Less O₂ released
- High tissue demand → More O₂ released
- Tissue PO₂ stays within a safe range (15–40 mm Hg)
KEY CONCEPT
- Hemoglobin acts as an oxygen buffer by automatically adjusting oxygen release according to tissue PO₂. At rest, it maintains tissue PO₂ around 40 mm Hg. During exercise, a small fall in PO₂ causes a large increase in oxygen release, keeping tissue PO₂ within about 15–40 mm Hg despite greatly increased oxygen demand.
The word “Buffer” is one of the most misunderstood terms in physiology. Once you understand its concept, you’ll never need to memorize it.
What Does “Buffer” Mean?
Simple Definition
A buffer is something that prevents big changes.
It keeps a value stable even when conditions change.
Easy Memory
Buffer = Stabilizer = Shock Absorber = Balance Keeper
Real-Life Example 1: Car Shock Absorber
Imagine a car driving on a rough road.
Without a shock absorber:
Road ↑↓↑↓

Car jumps violently
With a shock absorber:
Road ↑↓↑↓

Car moves smoothly
The shock absorber is a buffer.
It does not stop movement completely.
It simply prevents sudden large changes.
Real-Life Example 2: Water Tank
Imagine a house with a water tank.
People open taps at different times.
Without a tank:
One person opens tap

Pressure drops immediately
With a tank:
Tank stores water

Water pressure stays almost constant
The water tank buffers water pressure.
Now Apply This to Hemoglobin
Instead of buffering water…
Hemoglobin buffers oxygen (O₂).
What Happens Without Hemoglobin?
Imagine there is no hemoglobin.
Tissue suddenly needs more oxygen.
Need ↑

O₂ level crashes
Then demand decreases.
Need ↓

O₂ level rises sharply
Oxygen levels would keep swinging up and down.
What Happens With Hemoglobin?
Hemoglobin stores oxygen.
When tissues need more oxygen…
Need ↑

Hemoglobin releases O₂
When tissues need less oxygen…
Need ↓

Hemoglobin holds O₂
So oxygen stays relatively stable.
This is buffering.
Think of Hemoglobin as an Oxygen Bank
Imagine a bank.
When you need money,
the bank gives you money.
When you don’t need money,
the bank stores it.
Hemoglobin works exactly the same way.
In the lungs
High PO₂

Hemoglobin deposits oxygen.
In tissues
Low PO₂

Hemoglobin withdraws oxygen.
So hemoglobin is an
Oxygen Bank
Exercise Example
At Rest
Muscles need only a little oxygen.
Hemoglobin says
Take only 25%.Everything stays normal.
During Running
Now muscles suddenly need much more oxygen.
Without hemoglobin
Tissue PO₂

40

↓

5

↓

0
Cells would quickly become oxygen deficient.
With hemoglobin
Need ↑

Hemoglobin immediately releases extra oxygen.
So tissue PO₂ becomes
40

↓

30

↓

25

↓

20
Instead of falling to zero.
This is buffering.
Easy Analogy: Rechargeable Battery 🔋
Hemoglobin behaves like a battery.
Charging
In lungs
Battery charges

O₂ stored
Discharging
In tissues
Battery gives energy

O₂ released
A battery keeps electricity available.
Hemoglobin keeps oxygen available.
Why Doesn’t Tissue PO₂ Become Very High?
Suppose tissue PO₂ rises to 60 mm Hg.
Hemoglobin says
No need to release oxygen.So oxygen release decreases.
PO₂ falls back.
Why Doesn’t Tissue PO₂ Become Very Low?
Suppose tissue PO₂ falls to 20 mm Hg.
Hemoglobin says
Emergency!

Release much more oxygen.
Large amounts of oxygen are released.
PO₂ rises again.
This Is Why It Is Called a Buffer
Hemoglobin does not keep PO₂ exactly constant.
Instead, it keeps it within a safe range.
Without Hemoglobin

PO₂

60
|
|
20
|
|
0
Large fluctuations.
With Hemoglobin

PO₂

40
|
35
|
30
|
25
|
20
|
15
Small, controlled changes.
Super MBBS Memory Trick
Imagine a smart oxygen warehouse.
High PO₂ (Lungs)

Store oxygen 📦
↓
Normal tissues

Release a little oxygen 📦
↓
Exercise

Release lots of oxygen 📦📦📦
↓
PO₂ stays safeOne-Line Exam Definition
A buffer is a substance that resists large changes in a value. Hemoglobin acts as an oxygen buffer by storing oxygen when PO₂ is high (lungs) and releasing oxygen when PO₂ is low (tissues), thereby keeping tissue PO₂ relatively stable despite changes in oxygen demand.
FINAL KEY CONCEPT
Think of hemoglobin as a smart oxygen bank, rechargeable battery, or water tank. It stores oxygen when there is plenty available and releases it when tissues need more, preventing large swings in tissue PO₂. That stabilizing action is why hemoglobin is called an oxygen buffer.
When Atmospheric Oxygen Concentration Changes Markedly, the Buffer Effect of Hemoglobin Still Maintains Almost Constant Tissue PO₂
- The normal alveolar PO₂ is about 104 mm Hg.
- At high altitude (mountains or airplanes), alveolar PO₂ may fall to less than half of its normal value.
- In high-pressure environments (deep sea or pressurized chambers), alveolar PO₂ may rise up to 10 times the normal value.
- Despite these large changes, tissue PO₂ changes very little.
- As shown in Fig. 41.8:
- If alveolar PO₂ falls from 104 mm Hg to 60 mm Hg:
- Hemoglobin saturation decreases only from 97% to 89%.
- This is only an 8% decrease.
- If alveolar PO₂ falls from 104 mm Hg to 60 mm Hg:
- The tissues still remove about 5 mL of O₂ from each 100 mL of blood.
- To supply this oxygen:
- Venous blood PO₂ falls from 40 mm Hg to 35 mm Hg.
- This is only a 5 mm Hg decrease.
- Therefore, tissue PO₂ changes very little, even though alveolar PO₂ has decreased greatly.
- If alveolar PO₂ increases to 500 mm Hg:
- Hemoglobin saturation cannot increase above 100%.
- This is only 3% higher than the normal saturation of 97%.
- Only a small additional amount of oxygen dissolves in the blood plasma.
- As blood passes through the tissues:
- It releases oxygen.
- Capillary PO₂ falls to only slightly above the normal value of 40 mm Hg.
- Therefore:
- Alveolar PO₂ may vary widely (60 to >500 mm Hg).
- Tissue PO₂ remains close to normal.
- This demonstrates the oxygen-buffering function of hemoglobin.
Fig. 41.8
Low Alveolar PO₂
- Alveolar PO₂: 104 → 60 mm Hg
- Hb saturation: 97% → 89%
- Venous PO₂: 40 → 35 mm Hg
- Tissue PO₂ changes only slightly.
High Alveolar PO₂
- Alveolar PO₂: 500 mm Hg
- Hb saturation: Maximum = 100%
- Only a small extra amount of O₂ dissolves in plasma.
- Tissue PO₂ remains close to normal.
Easy Concept
Imagine Hemoglobin as a Smart Water Tank
The water tank = Hemoglobin
The water = Oxygen
The house = Body tissues
Situation 1: Less Water Coming In (High Altitude)
Normally:
Water Tank = Full (97%)At high altitude:
Less water enters

Tank is still almost full (89%)
Even though the incoming water decreases a lot, the house still gets enough water.
Similarly:
- Alveolar PO₂ falls greatly.
- Hemoglobin still carries most of its oxygen.
- Tissue PO₂ changes only a little.
Situation 2: Too Much Water Coming In (Hyperbaric Conditions)
Now imagine:
Huge amount of water arrivesCan the tank hold more than full?
No!
Once the tank is 100% full, it cannot store more.
Similarly:
- Hemoglobin becomes 100% saturated.
- Extra oxygen can only dissolve in the plasma in small amounts.
- Tissue PO₂ still changes very little.
Why is Hemoglobin Such a Good Buffer?
Think of hemoglobin as a smart oxygen manager.
When oxygen is low (high altitude)
Atmospheric O₂ ↓↓↓

Hemoglobin:
"I'll still hold most of the oxygen."
➡️ Tissues continue receiving oxygen.
When oxygen is very high
Atmospheric O₂ ↑↑↑

Hemoglobin:
"I'm already full."
➡️ It prevents excessive increases in tissue PO₂.
MBBS Memory Table
| Situation | Alveolar PO₂ | Hb Saturation | Tissue PO₂ |
|---|---|---|---|
| Normal | 104 mm Hg | 97% | Nearly constant |
| High altitude | 60 mm Hg | 89% | Slightly decreased |
| High-pressure environment | 500 mm Hg | 100% | Slightly increased |
SUPER MEMORY TRICK
Low Atmospheric O₂
        ↓
Hemoglobin still carries most O₂
        ↓
Tissue PO₂ stays nearly normal
High Atmospheric O₂
↓
Hemoglobin already full
↓
Tissue PO₂ still stays nearly normalKEY CONCEPT
- Hemoglobin acts as an oxygen buffer by preventing large changes in tissue PO₂. Whether alveolar PO₂ falls to about 60 mm Hg (high altitude) or rises to about 500 mm Hg (high-pressure environments), hemoglobin adjusts oxygen transport so that tissue PO₂ remains close to normal.
Factors That Shift the Oxygen–Hemoglobin Dissociation Curve and Their Importance for Oxygen Transport
- The oxygen–hemoglobin (O₂-Hb) dissociation curve shown in Figs. 41.8 and 41.9 represents normal blood.
- Several factors can shift the dissociation curve:
- To the right
- To the left
- As shown in Fig. 41.10:
- If the blood becomes more acidic:
- Blood pH decreases from 7.4 to 7.2.
- The O₂-Hb dissociation curve shifts about 15% to the right.
- If the blood becomes more alkaline:
- Blood pH increases from 7.4 to 7.6.
- The O₂-Hb dissociation curve shifts about 15% to the left.
- Besides changes in pH, three other factors also shift the curve to the right:
- Increased CO₂ concentration
- Increased blood temperature
- Increased 2,3-bisphosphoglycerate (2,3-BPG), a phosphate compound present in red blood cells whose level changes with different metabolic conditions.
Fig. 41.10
Right Shift
Occurs with:
- ↓ pH (7.4 → 7.2)
- ↑ CO₂
- ↑ Temperature
- ↑ 2,3-BPG
Left Shift
Occurs with:
- ↑ pH (7.4 → 7.6)
Easy Concept
Think of hemoglobin as a hand holding oxygen.
Right Shift
Hemoglobin hand opens easily
        ↓
Oxygen is released more easily
Occurs when tissues need more oxygen.
Examples:
- Exercise
- Fever
- High CO₂
- Acidosis
Left Shift
Hemoglobin hand holds oxygen tightly
        ↓
Less oxygen is released
Occurs when hemoglobin has a higher affinity for oxygen.
Example:
- Alkalosis (high pH)
Easy Memory Trick
RIGHT Shift = “Release O₂”
Remember:
“CADET, face Right!”
- C = ↑ CO₂
- A = ↑ Acid (↓ pH)
- D = 2,3-DPG/BPG
- E = Exercise (raises temperature and CO₂)
- T = ↑ Temperature
➡️ Right shift = Easier oxygen unloading to tissues
LEFT Shift = “Love O₂”
- ↑ pH
- Hemoglobin holds oxygen more tightly.
➡️ Left shift = Less oxygen released to tissues
KEY CONCEPT
- The oxygen–hemoglobin dissociation curve shifts to the right when pH decreases, CO₂ increases, temperature increases, or 2,3-BPG increases. A right shift helps hemoglobin release more oxygen to the tissues. An increase in pH shifts the curve to the left, causing hemoglobin to hold oxygen more tightly.
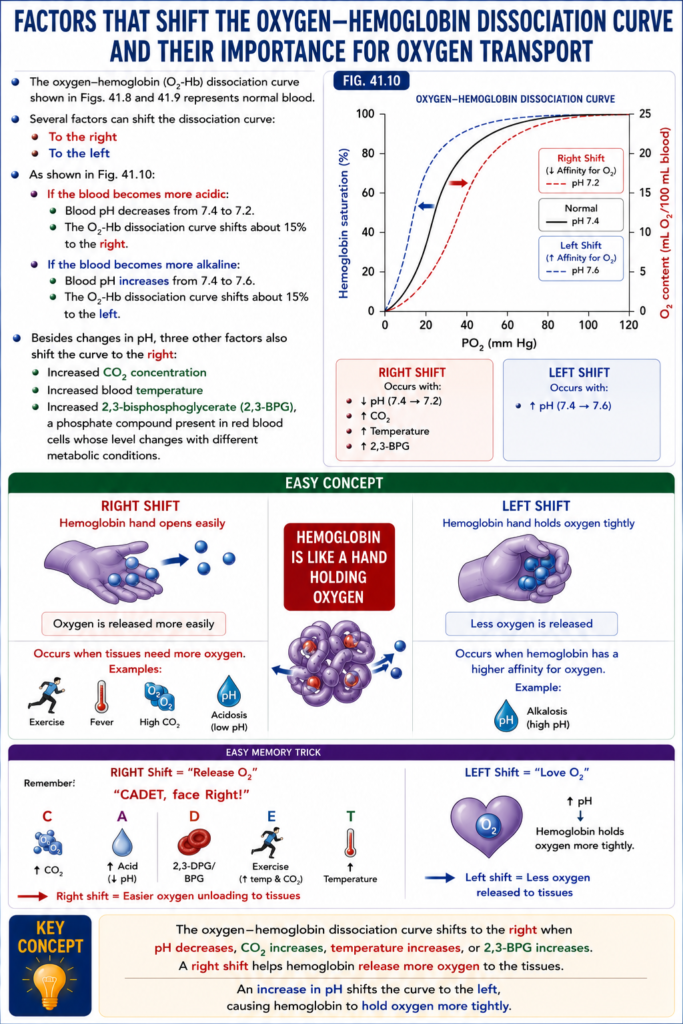
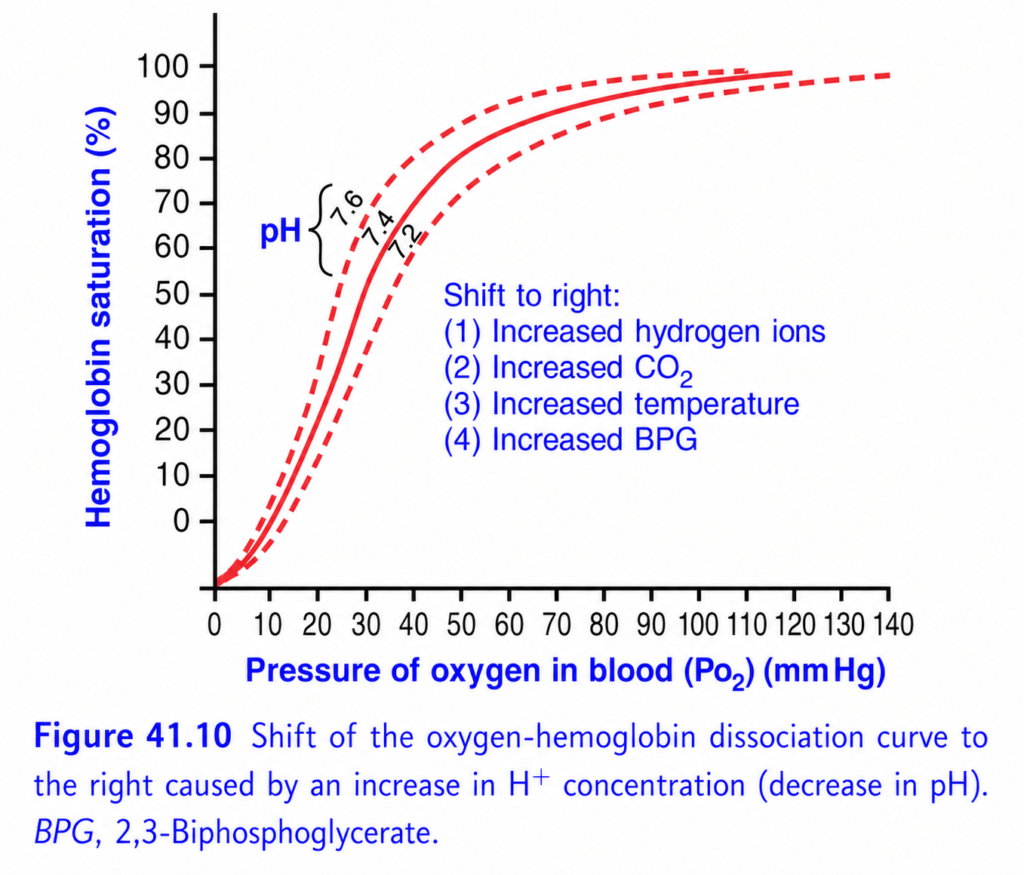
This is Figure 41.10 from Guyton Physiology, and it explains one of the most important concepts in respiratory physiology:
⭐ Shift of the Oxygen–Hemoglobin Dissociation Curve
This figure answers the question:
Why does hemoglobin release more oxygen during exercise, fever, acidosis, or high CO₂?
The answer is:
The oxygen-hemoglobin dissociation curve shifts to the RIGHT.
This phenomenon is called the Bohr Effect (when caused by increased CO₂ and H⁺).
🎯 One-Line Concept
A right shift means hemoglobin releases oxygen more easily to the tissues.
A left shift means hemoglobin holds oxygen more tightly.
Think of hemoglobin as a delivery truck carrying oxygen.
- Right shift = Truck unloads oxygen easily.
- Left shift = Truck keeps holding oxygen.
Step 1: Understand the Axes
X-Axis (Horizontal)
Pressure of Oxygen in Blood (PO₂)
This is the oxygen available in blood.
Move right →
Higher PO₂
Move left →
Lower PO₂
Y-Axis (Vertical)
Hemoglobin Saturation (%)
This tells us
What percentage of hemoglobin is carrying oxygen.
100%
↓
All hemoglobin loaded with oxygen.
50%
↓
Half loaded.
The Three Curves
There are three oxygen-hemoglobin dissociation curves.
🔴 Middle Solid Curve
Normal Curve
This represents
Normal conditions.
Normal values:
- pH = 7.4
- Temperature = 37°C
- Normal CO₂
- Normal 2,3-BPG
This is your reference curve.
🔺 Left Dashed Curve
pH = 7.6 (Alkalosis)
This curve shifts
⬅️ To the Left
🔻 Right Dashed Curve
pH = 7.2 (Acidosis)
This curve shifts
➡️ To the Right
Why Does pH Change the Curve?
Remember
Lower pH
=
More H⁺ ions
=
Acidic blood
This changes the structure of hemoglobin.
Hemoglobin becomes
less attracted to oxygen.
Therefore,
it releases oxygen more easily.
Understanding the Left Shift
Look carefully.
At
PO₂ = 40 mmHg
The left curve has
higher hemoglobin saturation.
Why?
Because hemoglobin is holding oxygen tightly.
It does
NOT
want to release oxygen.
Easy Memory
Left shift
↓
Love oxygen
↓
Keeps oxygen
↓
Less oxygen reaches tissuesnderstanding the Right Shift
Now look at the right curve.
At the same PO₂
(40 mmHg)
Hemoglobin saturation is lower.
Why?
Because
hemoglobin has already released much of its oxygen.
Therefore,
more oxygen enters tissues.
Easy Memory
Right shift
↓
Release oxygen
↓
Tissues receive more oxygen
The Four Causes of Right Shift
Guyton lists four important causes.
① Increased Hydrogen Ions (↓ pH)
This means
Acidosis.
Examples
- Lactic acidosis
- Diabetic ketoacidosis
- Severe exercise
What Happens?
Cells become acidic.
Hemoglobin releases oxygen more easily.
This is beneficial because active tissues need more oxygen.
② Increased CO₂
This is called the
Bohr Effect
During exercise,
cells produce large amounts of CO₂.
CO₂ enters red blood cells.
This increases H⁺ concentration.
Hemoglobin releases oxygen.
Easy Memory
High CO₂
↓
Right shift
↓
More oxygen released
③ Increased Temperature
Examples
- Fever
- Exercise
- Infection
Warm tissues need more oxygen.
Therefore,
hemoglobin unloads oxygen more easily.
Easy Memory
Hot muscles
↓
Need oxygen
↓
Right shift
④ Increased 2,3-BPG
2,3-BPG
(2,3-Bisphosphoglycerate)
is produced inside red blood cells.
What Does It Do?
It decreases hemoglobin’s affinity for oxygen.
Therefore,
oxygen is released more easily.
When Does 2,3-BPG Increase?
Examples
- High altitude
- Chronic hypoxia
- Anemia
It helps deliver more oxygen to tissues.
Why Does the Entire Curve Shift?
Imagine
Hemoglobin has become
“less interested”
in oxygen.
So,
at every PO₂,
it carries
slightly less oxygen.
Therefore,
the entire curve shifts right.
Compare the Curves at PO₂ = 40 mmHg
This is the easiest way to understand.
Left Shift
Saturation
≈75%
Hemoglobin keeps oxygen.
Normal
Saturation
≈75%
Normal oxygen delivery.
Right Shift
Saturation
≈60%
Hemoglobin has released much more oxygen.
Conclusion
Right shift
↓
More oxygen reaches tissues.
Why Doesn’t the Plateau Change Much?
Look at the upper flat part.
Even after shifting,
hemoglobin remains highly saturated in lungs.
Why?
Because lung PO₂
≈100 mmHg
is very high.
Therefore,
oxygen loading remains efficient.
Clinical Importance
Exercise
During exercise
All four right-shift factors occur:
✔ Increased CO₂
✔ Increased H⁺
✔ Increased temperature
✔ Increased 2,3-BPG (with prolonged adaptation)
Therefore,
the curve shifts
RIGHT.
More oxygen reaches muscles.
Fever
Body temperature increases.
Curve shifts right.
More oxygen delivered.
Acidosis
Hydrogen ions increase.
Curve shifts right.
Oxygen unloading improves.
High Altitude
Initially
Low PO₂.
After a few days
↓
2,3-BPG increases.
↓
Right shift.
↓
Improved oxygen delivery.
Causes of Left Shift
The opposite occurs when hemoglobin wants to keep oxygen.
Examples
- Increased pH (alkalosis)
- Decreased CO₂
- Decreased temperature
- Decreased 2,3-BPG
- Fetal hemoglobin (HbF)
- Carbon monoxide poisoning
Easy Story
Imagine
Hemoglobin is a delivery driver.
Left Shift
Driver refuses to unload packages.
Packages remain in the truck.
Tissues receive fewer packages.
Right Shift
Driver unloads packages quickly.
Tissues receive more packages.
Exactly the same with oxygen.
Compare Left and Right Shift
| Left Shift | Right Shift |
|---|---|
| Holds oxygen tightly | Releases oxygen easily |
| Increased affinity | Decreased affinity |
| Less oxygen delivered | More oxygen delivered |
| Alkalosis | Acidosis |
| Low CO₂ | High CO₂ |
| Low temperature | High temperature |
| Low BPG | High BPG |
The Bohr Effect
This is one of the most important MBBS concepts.
Definition
An increase in CO₂ or H⁺ (decrease in pH) shifts the oxygen-hemoglobin dissociation curve to the right, promoting oxygen release to tissues.
This allows metabolically active tissues to receive more oxygen exactly where it is needed.
Clinical Correlation
1. Running a Marathon
Active muscles produce:
- ↑ CO₂
- ↑ Lactic acid (↓ pH)
- ↑ Temperature
Result:
➡️ Right shift
➡️ More oxygen released to muscles.
2. Septic Fever
Temperature rises.
Curve shifts right.
Helps increase oxygen delivery to tissues.
3. Hyperventilation
CO₂ decreases.
Blood becomes alkaline.
Curve shifts left.
Hemoglobin holds oxygen more tightly, which can reduce oxygen unloading to tissues.
4. High Altitude
Over several days:
↑ 2,3-BPG
↓
Right shift
↓
Improved oxygen delivery despite lower atmospheric oxygen.
High-Yield MBBS Viva Points
Causes of Right Shift
- ↑ H⁺ (↓ pH)
- ↑ PCO₂
- ↑ Temperature
- ↑ 2,3-BPG
Causes of Left Shift
- ↓ H⁺ (↑ pH)
- ↓ PCO₂
- ↓ Temperature
- ↓ 2,3-BPG
- Fetal hemoglobin
- Carbon monoxide
Super Easy Memory Trick
RIGHT = “Release”
Both words start with R.
So,
Right Shift = Release Oxygen
Remember the four causes with “CADET, face Right!”
C = ↑ CO₂
A = ↑ Acid (H⁺)
D = 2,3-DPG/BPG ↑
E = Exercise (represents increased metabolism)
T = ↑ Temperature
These all make hemoglobin release oxygen more easily.
🎯 MBBS Golden Rule
| Condition | Curve Shift | Hemoglobin Affinity | Oxygen Delivery to Tissues |
|---|---|---|---|
| ↑ CO₂ | Right | ↓ | ↑ |
| ↑ H⁺ (↓ pH) | Right | ↓ | ↑ |
| ↑ Temperature | Right | ↓ | ↑ |
| ↑ 2,3-BPG | Right | ↓ | ↑ |
| ↓ CO₂ | Left | ↑ | ↓ |
| ↑ pH | Left | ↑ | ↓ |
| ↓ Temperature | Left | ↑ | ↓ |
| ↓ 2,3-BPG | Left | ↑ | ↓ |
Final Concept to Never Forget
The body shifts the oxygen-hemoglobin dissociation curve to the right whenever tissues need more oxygen (exercise, fever, acidosis, high CO₂). This decreases hemoglobin’s affinity for oxygen, allowing it to unload oxygen more readily.
Conversely, a left shift increases hemoglobin’s affinity for oxygen, helping oxygen loading but making oxygen unloading in the tissues more difficult. This balance ensures oxygen is delivered where and when it is most needed.
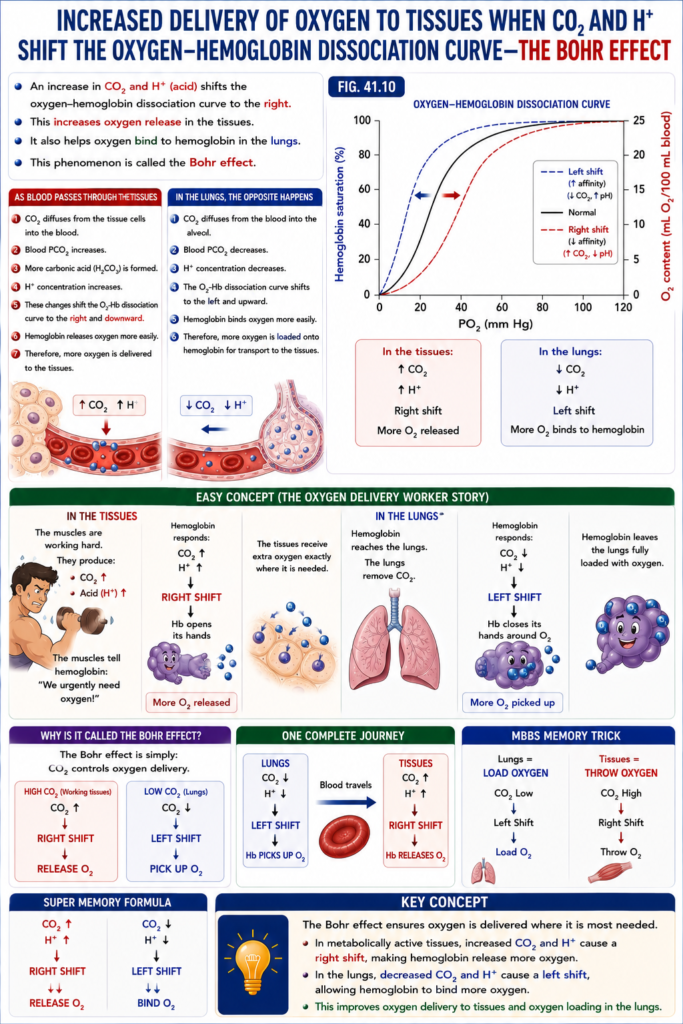
Increased Delivery of Oxygen to Tissues When CO₂ and H⁺ Shift the Oxygen-Hemoglobin Dissociation Curve—the Bohr Effect
- An increase in CO₂ and H⁺ (acid) shifts the oxygen-hemoglobin dissociation curve to the right.
- This increases oxygen release in the tissues.
- It also helps oxygen bind to hemoglobin in the lungs.
- This phenomenon is called the Bohr effect.
- As blood passes through the tissues:
- CO₂ diffuses from the tissue cells into the blood.
- Blood PCO₂ increases.
- More carbonic acid (H₂CO₃) is formed.
- H⁺ concentration increases.
- These changes shift the O₂-Hb dissociation curve to the right and downward.
- Hemoglobin releases oxygen more easily.
- Therefore, more oxygen is delivered to the tissues.
- In the lungs, the opposite happens:
- CO₂ diffuses from the blood into the alveoli.
- Blood PCO₂ decreases.
- H⁺ concentration decreases.
- The O₂-Hb dissociation curve shifts to the left and upward.
- Hemoglobin binds oxygen more easily.
- Therefore, more oxygen is loaded onto hemoglobin for transport to the tissues.
Fig. 41.10
- In the tissues:
- ↑ CO₂
- ↑ H⁺
- Right shift
- More O₂ released
- In the lungs:
- ↓ CO₂
- ↓ H⁺
- Left shift
- More O₂ binds to hemoglobin
Easy Concept (The Oxygen Delivery Worker Story)
Imagine Hemoglobin is an oxygen delivery worker carrying oxygen boxes.
In the Tissues 🏃
The muscles are working hard.
They produce:
- CO₂ ↑
- Acid (H⁺) ↑
The muscles tell hemoglobin:
“We urgently need oxygen!”
Hemoglobin immediately responds:
CO₂ ↑
H⁺ ↑
     ↓
RIGHT SHIFT
     ↓
Hb opens its hands
     ↓
More O₂ released
The tissues receive extra oxygen exactly where it is needed.
In the Lungs 🫁
Now hemoglobin reaches the lungs.
The lungs remove CO₂.
CO₂ ↓
H⁺ ↓
     ↓
LEFT SHIFT
     ↓
Hb closes its hands around O₂
     ↓
More O₂ picked up
Hemoglobin leaves the lungs fully loaded with oxygen.
Why Is It Called the Bohr Effect?
The Bohr effect is simply:
CO₂ controls oxygen delivery.
High CO₂ (Working tissues)
CO₂ ↑
↓
Right Shift
↓
Release O₂
Low CO₂ (Lungs)
CO₂ ↓
↓
Left Shift
↓
Pick up O₂
One Complete Journey
LUNGS
CO₂ ↓
H⁺ ↓
      ↓
LEFT SHIFT
      ↓
Hb PICKS UP O₂
      ↓
Blood travels
      ↓
TISSUES
CO₂ ↑
H⁺ ↑
      ↓
RIGHT SHIFT
      ↓
Hb RELEASES O₂
MBBS Memory Trick
Lungs = Load Oxygen
CO₂ Low
↓
Left Shift
↓
Load O₂
Tissues = Throw Oxygen
CO₂ High
↓
Right Shift
↓
Throw O₂
Super Memory Formula
CO₂ ↑
H⁺ ↑
↓↓
RIGHT SHIFT
↓↓
Release O₂
CO₂ ↓
H⁺ ↓
↓↓
LEFT SHIFT
↓↓
Bind O₂KEY CONCEPT
- The Bohr effect ensures oxygen is delivered where it is most needed. In metabolically active tissues, increased CO₂ and H⁺ cause a right shift, making hemoglobin release more oxygen. In the lungs, decreased CO₂ and H⁺ cause a left shift, allowing hemoglobin to bind more oxygen. This improves oxygen delivery to tissues and oxygen loading in the lungs.
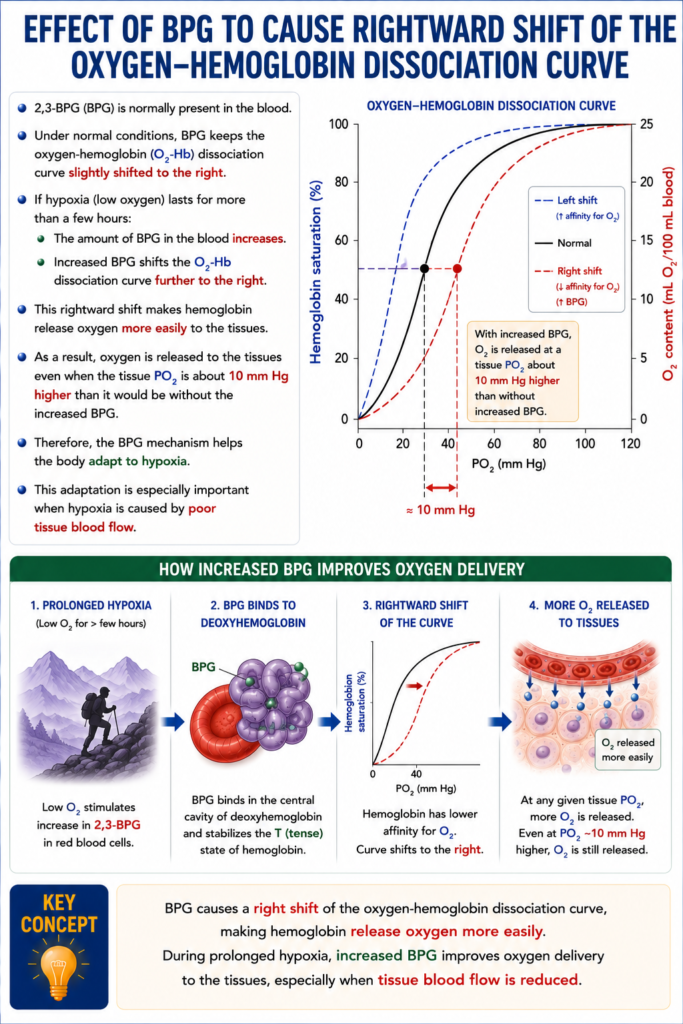
Effect of BPG to Cause Rightward Shift of the Oxygen-Hemoglobin Dissociation Curve
- 2,3-BPG (BPG) is normally present in the blood.
- Under normal conditions, BPG keeps the oxygen-hemoglobin (O₂-Hb) dissociation curve slightly shifted to the right.
- If hypoxia (low oxygen) lasts for more than a few hours:
- The amount of BPG in the blood increases.
- Increased BPG shifts the O₂-Hb dissociation curve further to the right.
- This rightward shift makes hemoglobin release oxygen more easily to the tissues.
- As a result, oxygen is released to the tissues even when the tissue PO₂ is about 10 mm Hg higher than it would be without the increased BPG.
- Therefore, the BPG mechanism helps the body adapt to hypoxia.
- This adaptation is especially important when hypoxia is caused by poor tissue blood flow.
KEY CONCEPT
- BPG causes a right shift of the oxygen-hemoglobin dissociation curve, making hemoglobin release oxygen more easily. During prolonged hypoxia, increased BPG improves oxygen delivery to the tissues, especially when tissue blood flow is reduced.
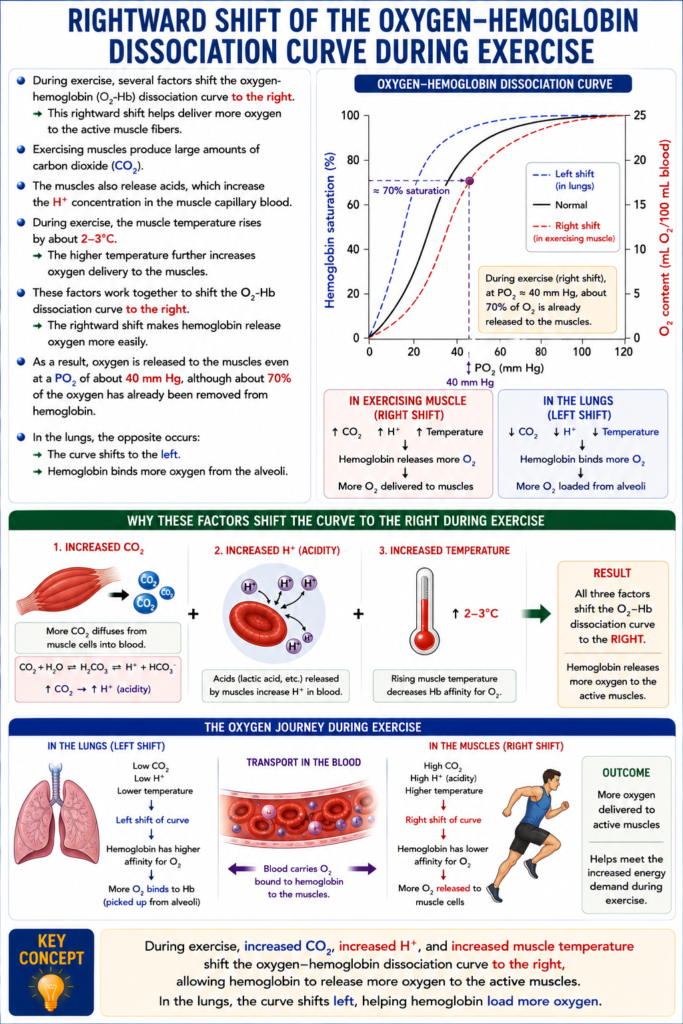
Rightward Shift of the Oxygen-Hemoglobin Dissociation Curve During Exercise
- During exercise, several factors shift the oxygen-hemoglobin (O₂-Hb) dissociation curve to the right.
- This rightward shift helps deliver more oxygen to the active muscle fibers.
- Exercising muscles produce large amounts of carbon dioxide (CO₂).
- The muscles also release acids, which increase the H⁺ concentration in the muscle capillary blood.
- During exercise, the muscle temperature rises by about 2–3°C.
- The higher temperature further increases oxygen delivery to the muscles.
- These factors work together to shift the O₂-Hb dissociation curve to the right.
- The rightward shift makes hemoglobin release oxygen more easily.
- As a result, oxygen is released to the muscles even at a PO₂ of about 40 mm Hg, although about 70% of the oxygen has already been removed from hemoglobin.
- In the lungs, the opposite occurs:
- The curve shifts to the left.
- Hemoglobin binds more oxygen from the alveoli.
KEY CONCEPT
- During exercise, increased CO₂, increased H⁺, and increased muscle temperature shift the oxygen-hemoglobin dissociation curve to the right, allowing hemoglobin to release more oxygen to the active muscles. In the lungs, the curve shifts left, helping hemoglobin load more oxygen.
METABOLIC USE OF OXYGEN BY CELLS
- Only a very small oxygen pressure (PO₂) is needed for normal chemical reactions inside the cells.
- The cell’s respiratory enzyme systems work normally as long as the intracellular PO₂ is above 1 mm Hg.
- Therefore, when intracellular PO₂ is greater than 1 mm Hg, oxygen is not the limiting factor for cellular metabolism.
- Instead, the main factor controlling oxygen use is the concentration of adenosine diphosphate (ADP) inside the cells.
- Fig. 41.11 shows the relationship between:
- Intracellular PO₂
- Rate of oxygen (O₂) usage
- Different ADP concentrations
- The figure shows that:
- When intracellular PO₂ is above 1 mm Hg, the oxygen usage rate remains constant for any given ADP level.
- If the ADP concentration increases or decreases, the oxygen usage rate changes in the same direction.
- Inside the cells:
- Adenosine triphosphate (ATP) provides energy.
- When ATP is used, it is converted into ADP.
- An increase in ADP stimulates the use of oxygen.
- Oxygen helps release energy from nutrients.
- This energy converts ADP back into ATP.
- Therefore, under normal conditions, the rate of oxygen use by the cells is ultimately controlled by the rate of energy expenditure, which determines how much ADP is produced from ATP.
Fig. 41.11
- Intracellular PO₂ > 1 mm Hg
- O₂ is not the limiting factor.
- ADP concentration controls O₂ usage.
- Higher ADP
- → Higher O₂ usage
- Lower ADP
- → Lower O₂ usage
KEY CONCEPT
- Cells need only a very small PO₂ (>1 mm Hg) for normal metabolism. Above this level, oxygen availability is sufficient, and the rate of oxygen use is controlled mainly by ADP concentration. As ATP is converted to ADP during energy use, increased ADP stimulates greater oxygen consumption to regenerate ATP.
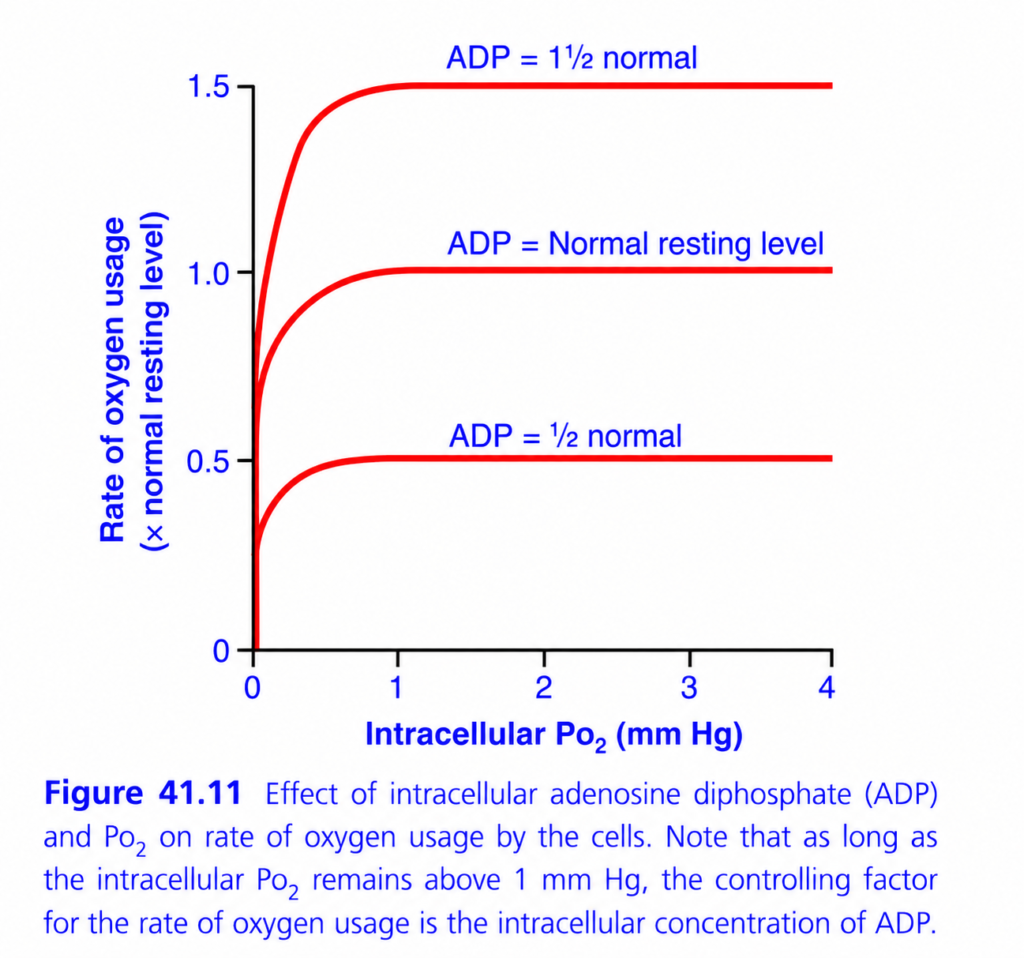
This is Figure 41.11 from Guyton Physiology, and it explains what actually controls oxygen consumption by cells (cellular respiration).
Many students think:
“More oxygen (PO₂) always means more oxygen consumption.”
❌ This is NOT true.
This graph proves that oxygen availability is usually NOT the limiting factor.
Instead,
The major controller of oxygen consumption is intracellular ADP concentration (energy demand).
This is one of the highest-yield concepts in physiology.
Figure 41.11: Effect of Intracellular ADP and PO₂ on Cellular Oxygen Consumption
⭐ One-Line Concept
As long as intracellular PO₂ is above about 1 mmHg, oxygen consumption depends mainly on ADP (energy demand), not on oxygen availability.
In simple words:
- More ADP → More ATP needs to be made → More oxygen is used.
- Less ADP → Less ATP production → Less oxygen is used.
First Understand the Big Concept
Cells use oxygen only to make ATP.
The simplified reaction is:
Glucose + O₂
      ↓
ATP + CO₂ + H₂O
But oxygen is not the switch that starts ATP production.
The real switch is:
ADP
Why ADP?
Remember
ATP
↓ (Energy used)

ADP
Whenever a cell uses energy,
ATP becomes
ADP.
Now the cell needs to regenerate ATP.
To regenerate ATP,
mitochondria consume oxygen.
Therefore
More ADP = More oxygen consumption.
Step 1: Understand the Axes
X-Axis (Horizontal)
Intracellular PO₂ (mmHg)
This is
oxygen pressure inside the cell.
Starts from
0 mmHg
↓
4 mmHg
Notice something important.
The values are
very low.
Normal intracellular PO₂ is only
about
1–3 mmHg.
Easy Memory
This graph is
NOT
about blood oxygen.
It is about
oxygen
inside the cell.
Y-Axis (Vertical)
Rate of Oxygen Usage
This tells us
How fast the cell is consuming oxygen.
The values are expressed as
multiples of the normal resting rate.
Examples
0.5
↓
Half normal oxygen use
1
↓
Normal oxygen use
1.5
↓
50% more oxygen consumption
Why Are There Three Curves?
Each curve represents
a different
intracellular ADP level.
🔻 Lower Curve
ADP = ½ Normal
This means
The cell has
very little ADP.
What Does That Mean?
Little ADP means
little ATP has been used.
The cell is resting.
It does not need much ATP.
Therefore,
mitochondria consume
little oxygen.
Oxygen Consumption
Only
0.5
times normal.
Examples
- Sleeping muscle
- Resting neuron
- Inactive tissue
Easy Memory
Little ADP
↓
Little ATP production
↓
Little oxygen used
🔴 Middle Curve
ADP = Normal Resting Level
This is
normal resting metabolism.
Oxygen Consumption=
1×
Normal
This represents
a healthy resting cell.
🔺 Upper Curve
ADP = 1½ Times Normal
Now
The cell contains
much more ADP.
Why?
Because
the cell has used lots of ATP.
Therefore
mitochondria must produce ATP rapidly.
To make ATP,
more oxygen is consumed.
Oxygen Consumption
=
1.5×
Normal.
Examples
- Exercising muscle
- Contracting heart
- Active neurons
The Most Important Feature
Look carefully.
All three curves
rise sharply
at first,
then
become
almost
horizontal.
Why Do They Rise Initially?
Look at very low PO₂.
Suppose
PO₂
=
0 mmHg
There is almost no oxygen.
Without oxygen,
mitochondria cannot perform oxidative phosphorylation.
Therefore,
oxygen consumption is low.
Now
PO₂ increases
from
0
↓
1 mmHg.
Suddenly,
mitochondria receive enough oxygen.
ATP production becomes normal.
Therefore,
oxygen consumption rises rapidly.
Why Do the Curves Become Flat?
This is
the most important concept.
After
PO₂ reaches
about
1 mmHg,
there is already enough oxygen for mitochondria.
Adding more oxygen
does
NOT
increase ATP production.
Because
oxygen is no longer the limiting factor.
Instead,
the limiting factor becomes
ADP.
Easy Analogy
Imagine
A bakery.
Oxygen
=
Flour.
ADP
=
Customer orders.
Suppose
The bakery already has enough flour.
Adding
more flour
will
NOT
make more bread.
The bakery only bakes more bread
when
more customers place orders.
Exactly the same.
Cells already have enough oxygen.
More oxygen alone
doesn’t increase oxygen consumption.
Only more ADP does.
Why Does ADP Control Oxygen Consumption?
Remember
ATP is the energy currency.
When ATP is used,
ADP accumulates.
High ADP tells mitochondria
“Make more ATP.”
Mitochondria increase
oxidative phosphorylation.
Therefore,
oxygen consumption increases.
Why Doesn’t High PO₂ Increase Oxygen Use?
Suppose
Intracellular PO₂
changes
from
2
↓
4 mmHg.
Look carefully.
Almost
nothing changes.
Why?
Because mitochondria already had enough oxygen.
Extra oxygen cannot force mitochondria to make unnecessary ATP.
Cells only make ATP
when they need ATP.
Compare the Three Curves
| ADP Level | Oxygen Consumption |
|---|---|
| ½ Normal | Lowest |
| Normal | Normal |
| 1½ Normal | Highest |
Notice
At the same intracellular PO₂,
higher ADP always causes
greater oxygen consumption.
The Critical Point
Look at
1 mmHg
This is the most important number.
Guyton states:
As long as intracellular PO₂ remains above about 1 mmHg, oxygen availability is not the limiting factor.
Therefore
Above
1 mmHg
↓
ADP controls respiration.
Below
1 mmHg
↓
Oxygen becomes limiting.
Clinical Correlation
1. Resting Muscle
ATP demand is low.
ADP is low.
Oxygen consumption is low.
2. Exercise
Muscles rapidly use ATP.
ADP rises.
Mitochondria immediately increase oxygen consumption.
This is why exercising muscles consume much more oxygen.
3. Myocardium
The heart contracts continuously.
ATP demand is very high.
ADP remains relatively high.
Therefore,
the heart continuously consumes large amounts of oxygen.
4. Severe Ischemia
Blood flow decreases markedly.
Intracellular PO₂ falls below
1 mmHg.
Now oxygen becomes the limiting factor.
ATP production falls.
Cells begin to fail.High-Yield MBBS Viva Points
- Normal intracellular PO₂ is only about 1–3 mmHg.
- Above ~1 mmHg, oxygen is usually not the limiting factor for ATP production.
- Intracellular ADP is the major regulator of cellular oxygen consumption.
- High ADP stimulates oxidative phosphorylation and increases oxygen use.
- Only when intracellular PO₂ falls below ~1 mmHg does oxygen become the limiting factor.
Comparison of the Three Curves
| Curve | ADP Level | Oxygen Consumption | Physiological State |
|---|---|---|---|
| Lower | ½ Normal | 0.5× normal | Resting/inactive cell |
| Middle | Normal | 1× normal | Normal resting metabolism |
| Upper | 1½ Normal | 1.5× normal | Active/exercising cell |
Super Easy Memory Story
Imagine a power plant:
- 🪨 Coal = Oxygen
- 📩 Electricity orders = ADP
- ⚡ Electricity produced = ATP
Situation 1
The power plant already has plenty of coal (oxygen).
If there are no new electricity orders,
it does not produce more electricity.Situation 2
Suddenly,
many new orders arrive (↑ ADP).
The power plant burns more coal (oxygen)
to generate more electricity (ATP).
Situation 3
If coal runs out completely (PO₂ < 1 mmHg),
the plant cannot make electricity,
no matter how many orders arrive.
🎯 MBBS Golden Rule
| Intracellular PO₂ | Main Controller of Oxygen Consumption |
|---|---|
| > 1 mmHg | ADP (energy demand) |
| < 1 mmHg | Oxygen availability |
Final Concept to Never Forget
The body does not consume oxygen simply because oxygen is present.
Cells consume oxygen only when they need to make ATP, and that need is signaled by an increase in ADP.
Think of ADP as the “demand signal” and oxygen as the “raw material.” As long as enough oxygen is available (intracellular PO₂ > 1 mmHg), ADP—not oxygen—determines how much oxygen the cell uses. This is the central physiological message of Figure 41.11.
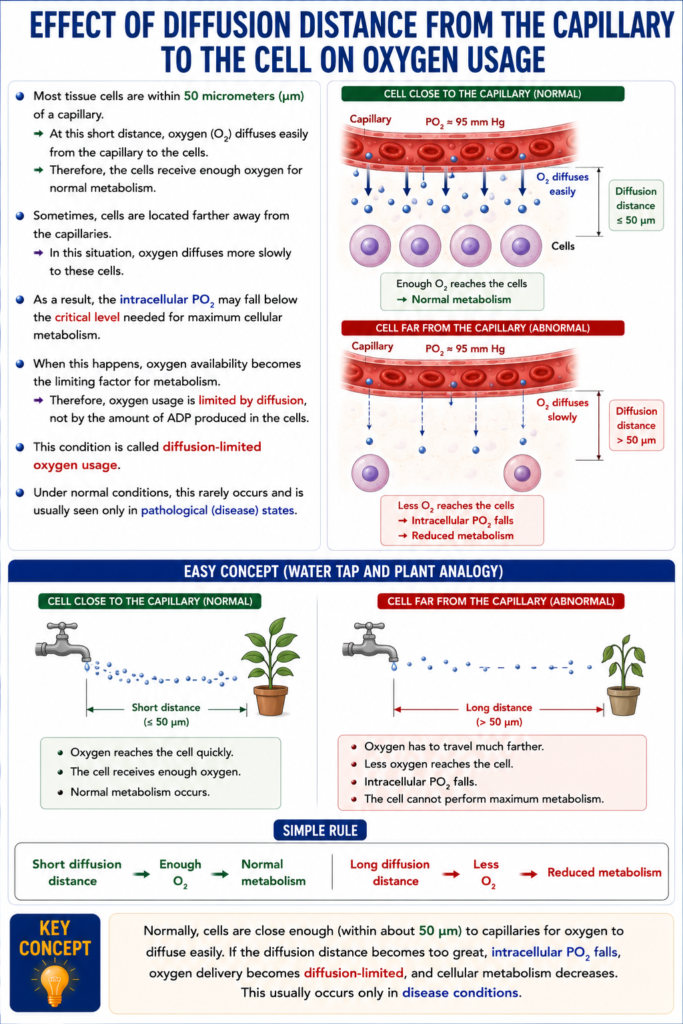
Effect of Diffusion Distance From the Capillary to the Cell on Oxygen Usage
- Most tissue cells are within 50 micrometers (µm) of a capillary.
- At this short distance, oxygen (O₂) diffuses easily from the capillary to the cells.
- Therefore, the cells receive enough oxygen for normal metabolism.
- Sometimes, cells are located farther away from the capillaries.
- In this situation, oxygen diffuses more slowly to these cells.
- As a result, the intracellular PO₂ may fall below the critical level needed for maximum cellular metabolism.
- When this happens, oxygen availability becomes the limiting factor for metabolism.
- Therefore, oxygen usage is limited by diffusion, not by the amount of ADP produced in the cells.
- This condition is called diffusion-limited oxygen usage.
- Under normal conditions, this rarely occurs and is usually seen only in pathological (disease) states.
Easy Concept
Imagine the capillary is a water tap and the cell is a plant.
Cell Close to the Capillary (Normal)
Capillary 🚰 ───── 🌱 Cell
Short distance- Oxygen reaches the cell quickly.
- The cell receives enough oxygen.
- Normal metabolism occurs.
Cell Far From the Capillary
Capillary 🚰 ───────────────────────── 🌱 Cell
Long distance- Oxygen has to travel much farther.
- Less oxygen reaches the cell.
- Intracellular PO₂ falls.
- The cell cannot perform maximum metabolism.
Simple Rule
- Short diffusion distance → Enough O₂ → Normal metabolism
- Long diffusion distance → Less O₂ → Reduced metabolism
KEY CONCEPT
- Normally, cells are close enough (within about 50 µm) to capillaries for oxygen to diffuse easily. If the diffusion distance becomes too great, intracellular PO₂ falls, oxygen delivery becomes diffusion-limited, and cellular metabolism decreases. This usually occurs only in disease conditions.
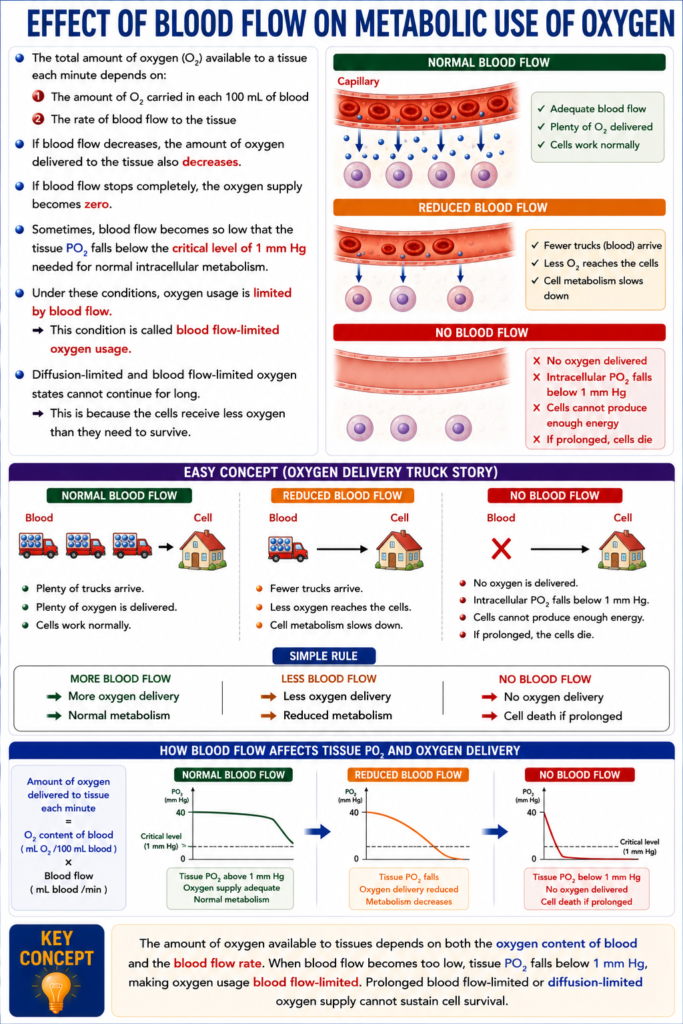
Effect of Blood Flow on Metabolic Use of Oxygen
- The total amount of oxygen (O₂) available to a tissue each minute depends on:
- The amount of O₂ carried in each 100 mL of blood
- The rate of blood flow to the tissue
- If blood flow decreases, the amount of oxygen delivered to the tissue also decreases.
- If blood flow stops completely, the oxygen supply becomes zero.
- Sometimes, blood flow becomes so low that the tissue PO₂ falls below the critical level of 1 mm Hg needed for normal intracellular metabolism.
- Under these conditions, oxygen usage is limited by blood flow.
- This condition is called blood flow-limited oxygen usage.
- Diffusion-limited and blood flow-limited oxygen states cannot continue for long.
- This is because the cells receive less oxygen than they need to survive.
Easy Concept
Imagine oxygen is food, blood is the delivery truck, and cells are houses.
Normal Blood Flow
Blood 🚚 🚚 🚚 → Cell 🏠- Plenty of trucks arrive.
- Plenty of oxygen is delivered.
- Cells work normally.
Reduced Blood Flow
Blood 🚚 → Cell 🏠- Fewer trucks arrive.
- Less oxygen reaches the cells.
- Cell metabolism slows down.
No Blood Flow
❌ Blood 🚚

Cell 🏠- No oxygen is delivered.
- Intracellular PO₂ falls below 1 mm Hg.
- Cells cannot produce enough energy.
- If prolonged, the cells die.
Simple Rule
- More blood flow → More oxygen delivery → Normal metabolism
- Less blood flow → Less oxygen delivery → Reduced metabolism
- No blood flow → No oxygen → Cell death if prolonged
KEY CONCEPT
- The amount of oxygen available to tissues depends on both the oxygen content of blood and the blood flow rate. When blood flow becomes too low, tissue PO₂ falls below 1 mm Hg, making oxygen usage blood flow-limited. Prolonged blood flow-limited or diffusion-limited oxygen supply cannot sustain cell survival.
Transport of Oxygen in the Dissolved State
- At the normal arterial PO₂ of 95 mm Hg, about 0.29 mL of O₂ is dissolved in every 100 mL of blood.
- When blood reaches the tissue capillaries, the PO₂ falls to about 40 mm Hg.
- At this PO₂, only 0.12 mL of O₂ remains dissolved in every 100 mL of blood.
Easy Calculation
- Dissolved O₂ in arterial blood = 0.29 mL/100 mL
- Dissolved O₂ in venous blood = 0.12 mL/100 mL
O₂ delivered in dissolved form =
0.29 − 0.12 = 0.17 mL O₂/100 mL blood
- Therefore, only 0.17 mL of O₂ is normally delivered to the tissues in the dissolved state by every 100 mL of blood.
- In comparison:
- Hemoglobin transports about 5 mL of O₂ per 100 mL of blood to the tissues.
- Therefore:
- About 97% of oxygen is transported by hemoglobin.
- Only about 3% is transported in the dissolved state.
- During strenuous exercise:
- Hemoglobin releases about 3 times more oxygen to the tissues.
- Therefore, the relative contribution of dissolved oxygen decreases to about 1.5%.
- If a person breathes oxygen at very high alveolar PO₂:
- Much more oxygen dissolves directly in the blood.
- The amount of dissolved oxygen can become very high.
- This may cause oxygen (O₂) poisoning.
- Severe oxygen poisoning can lead to:
- Brain convulsions
- Death
Easy Concept
Imagine oxygen travels in two ways:
1. Main Bus (Hemoglobin) 🚌
97 passengers- Carries 97% of oxygen.
2. Walking (Dissolved Oxygen) 🚶
3 passengers- Carries only 3% of oxygen.
Normally:
Hemoglobin 🚌 = 97%

Dissolved 🚶 = 3%
During exercise:
- The bus carries even more oxygen.
- The walkers still carry very little.
So the dissolved oxygen contribution falls to about 1.5%.
If breathing very high-pressure oxygen:
Many more walkers 🚶🚶🚶🚶🚶Too much oxygen dissolves in the blood.
This can cause oxygen poisoning.
KEY CONCEPT
- Only a small amount of oxygen (about 3%) is transported dissolved in plasma, while about 97% is carried by hemoglobin. During exercise, the dissolved fraction becomes even smaller (about 1.5%). However, breathing very high concentrations of oxygen greatly increases dissolved oxygen, which can lead to oxygen poisoning.
Combination of Hemoglobin With Carbon Monoxide—Displacement of O₂
- Carbon monoxide (CO) binds to hemoglobin (Hb) at the same site as oxygen (O₂).
- Therefore, CO competes with and displaces O₂ from hemoglobin.
- This reduces the oxygen-carrying capacity of the blood.
- CO binds to hemoglobin with about 250 times greater affinity than O₂.
- Fig. 41.12 shows the CO-hemoglobin dissociation curve.
- The curve is almost the same as the O₂-hemoglobin dissociation curve, except that:
- The CO partial pressures are only 1/250 of the O₂ partial pressures.
Easy Concept of the 250× Affinity
- Normal alveolar PO₂ ≈ 100 mm Hg
- CO needs only 0.4 mm Hg to compete equally with O₂.
Calculation:
100 ÷ 250 = 0.4 mm Hg
- Therefore:
- CO partial pressure = 0.4 mm Hg
- → About 50% of hemoglobin binds to CO instead of O₂.
- A CO partial pressure of only 0.6 mm Hg (less than 1 part per 1000 of air) can be fatal.
- In CO poisoning:
- The oxygen content of the blood decreases greatly.
- However, the blood PO₂ may remain normal.
- Because PO₂ remains normal:
- The blood appears bright red.
- There is no cyanosis (bluish lips or fingertips).
- The normal increase in breathing caused by low PO₂ does not occur.
- The brain is one of the first organs affected by lack of oxygen.
- Therefore, the person may become:
- Disoriented
- Unconscious
- Before realizing the danger.
- Severe CO poisoning is treated by giving pure oxygen (100% O₂).
- High alveolar PO₂ helps displace CO from hemoglobin.
- Giving 5% CO₂ together with oxygen:
- Strongly stimulates the respiratory center.
- Increases alveolar ventilation.
- Helps remove CO from the lungs more quickly.
- Combined O₂ + CO₂ therapy can remove CO from the blood up to 10 times faster than without treatment.
Fig. 41.12
- CO binds Hb at the same site as O₂.
- CO affinity = 250× greater than O₂.
- 100 mm Hg O₂ ÷ 250 = 0.4 mm Hg CO
- 0.4 mm Hg CO → 50% Hb bound to CO
- 0.6 mm Hg CO → Can be lethal
KEY CONCEPT
- Carbon monoxide binds to hemoglobin 250 times more strongly than oxygen, preventing oxygen transport. Even though blood PO₂ may remain normal, oxygen content falls dangerously, making CO poisoning difficult to recognize. Treatment with 100% oxygen, often combined with 5% CO₂, rapidly removes CO from hemoglobin.
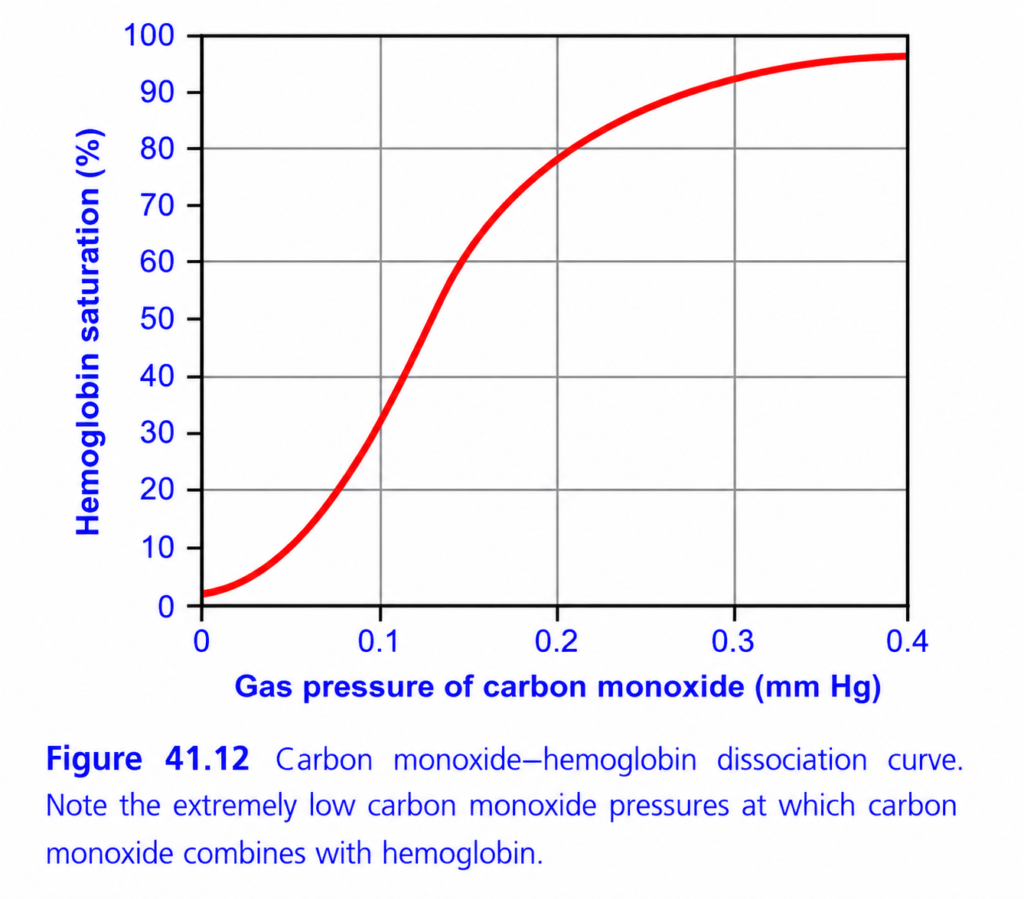
This is Figure 41.12 from Guyton Physiology, and it explains one of the most dangerous concepts in respiratory physiology:
⭐ Carbon Monoxide (CO)–Hemoglobin Dissociation Curve
This graph explains how easily carbon monoxide (CO) binds to hemoglobin, even when the amount of CO in the air is extremely small.
This is why carbon monoxide poisoning is so dangerous.
🎯 One-Line Concept
Even a tiny partial pressure of carbon monoxide (CO) can bind a large percentage of hemoglobin because CO has about 250 times greater affinity for hemoglobin than oxygen.
In simple words:
Very little CO → Very large amount of hemoglobin becomes occupied by CO.
First Understand What Carbon Monoxide Is
Carbon monoxide (CO) is
- Colorless
- Odorless
- Tasteless
- Poisonous gas
Common sources:
- Car exhaust
- House fires
- Faulty gas heaters
- Coal stoves
- Charcoal burning in closed rooms
- Generator exhaust
Why Is CO Dangerous?
Normally,
Hemoglobin carries
Oxygen (O₂).
Hemoglobin + Oxygen
        ↓
Oxyhemoglobin
But CO competes for the same binding site.
Hemoglobin + CO
        ↓
Carboxyhemoglobin (HbCO)
The problem is:
CO binds about 250 times more strongly than oxygen.
Therefore,
even a tiny amount of CO can replace oxygen.
Step 1: Understand the AxesX-Axis (Horizontal)
Gas Pressure of Carbon Monoxide (mmHg)
This shows
How much CO is present in the air (or alveoli).
Notice something unusual.
The values are
only
0
↓
0.4 mmHg
These are extremely tiny pressures.
Easy Memory
Moving right
↓
More CO present
Y-Axis (Vertical)
Hemoglobin Saturation (%)
This means
What percentage of hemoglobin is occupied by CO.
NOT oxygen.
Example
0%
↓
No hemoglobin has CO attached.
100%
↓
Almost all hemoglobin carries CO.
Understanding the Red Curve
Look carefully.
The curve rises
very steeply.oes It Rise So Quickly?
Because
hemoglobin loves CO.
Remember
CO affinity
=
250×
greater than oxygen.
Therefore,
even tiny increases in CO pressure
cause
large increases
in carboxyhemoglobin.
Why Does the Curve Become Flat?
Eventually,
almost all hemoglobin molecules are occupied by CO.
There are very few empty binding sites left.
Therefore,
adding more CO
produces little additional binding.
The curve reaches a plateau.
The Most Important Observation
Look at the X-axis.
Maximum value
=
0.4 mmHg.
That is
an extremely tiny pressure.
Yet,
hemoglobin saturation approaches
almost
100%.
Why?
Because
CO binds extraordinarily tightly.
This is the main message of the graph.
Compare Oxygen and Carbon Monoxide
Suppose
Both gases are present.
Who wins?
Always
CO.
Because
CO affinity
=
250×
greater.
Example
Imagine
Two people trying to sit on one chair.
Person 1
=
Oxygen
Person 2
=
Carbon monoxide
Carbon monoxide grabs the chair
250 times more strongly.
Oxygen almost never gets the seat.hat Happens to Oxygen Transport?
Normally
Hemoglobin
↓
Carries oxygen.
After CO poisoning
Hemoglobin becomes
Carboxyhemoglobin.
Now
Hemoglobin cannot carry oxygen.
Therefore,
oxygen transport falls dramatically.
CO Causes Two Major Problems
Problem 1
Less oxygen can bind hemoglobin.
Because CO occupies binding sites.
↓
Reduced oxygen-carrying capacity.
Problem 2
The oxygen that remains bound to hemoglobin is held more tightly.
CO causes a left shift of the oxygen-hemoglobin dissociation curve.
Therefore,
oxygen is released less easily to tissues.
So tissues suffer from hypoxia even if some oxygen is still present in the blood.
Why Is Carbon Monoxide Poisoning So Dangerous?
The patient may have:
- Normal lungs
- Normal breathing
- Normal PO₂
Yet,
the tissues receive very little oxygen.
Why?
Because
Hemoglobin is occupied by CO,
not oxygen.
Easy Analogy
Imagine
20 seats on a bus.
Normally
Oxygen passengers occupy all seats.
Now
CO passengers enter.
Once they sit,
they refuse to leave.
No oxygen passengers can sit.
Therefore,
the bus reaches tissues
almost empty of oxygen.hy Doesn’t Breathing Room Air Help Much?
Remember
CO binds very tightly.
Simply breathing normal air
removes CO very slowly.
Half-life of carboxyhemoglobin:
- Room air: ~4–6 hours
- 100% oxygen: ~60–90 minutes
- Hyperbaric oxygen: ~20–30 minutes
This is why patients with significant CO poisoning are treated with 100% oxygen, and in severe cases, hyperbaric oxygen therapy.
Clinical Correlation
1. House Fire
Smoke contains CO.
Victim develops
carboxyhemoglobin.
Result:
Severe tissue hypoxia.
2. Car Exhaust in Closed Garage
CO accumulates.
Hemoglobin rapidly binds CO.
Patient may lose consciousness.
3. Faulty Gas Heater
One of the most common causes of accidental CO poisoning.
Symptoms of CO Poisoning
Because tissues receive very little oxygen:
- Headache
- Dizziness
- Weakness
- Nausea
- Confusion
- Syncope
- Coma
- Death (severe poisoning)
A classic textbook description is “cherry-red” skin, but this is uncommon in living patients and should not be relied upon for diagnosis.
Diagnosis
The best test is
Carboxyhemoglobin (COHb) level
measured by
Co-oximetry (blood gas analyzer with co-oximetry).
Standard pulse oximetry can be misleading because it often cannot distinguish oxyhemoglobin from carboxyhemoglobin and may show a falsely normal oxygen saturation.
Treatment
- Remove the patient from the CO source.
- Give 100% oxygen immediately.
- Consider hyperbaric oxygen therapy for severe poisoning (e.g., neurological symptoms, significant COHb levels, pregnancy with significant exposure, or severe acidosis).
High-Yield MBBS Viva Points
| Parameter | Important Fact |
|---|---|
| CO affinity for Hb | ≈250 times greater than O₂ |
| Binding site | Same heme site as oxygen |
| Compound formed | Carboxyhemoglobin (COHb) |
| Main effect | Decreases oxygen-carrying capacity |
| Additional effect | Causes left shift of O₂-Hb dissociation curve |
| Poisoning treatment | 100% oxygen, ± hyperbaric oxygen |
Understanding the Curve Step by Step
| CO Pressure | What Happens? |
|---|---|
| Very low | Very little CO binds initially |
| Slight increase | Large increase in HbCO because affinity is extremely high |
| Moderate increase | Most hemoglobin becomes occupied by CO |
| Higher values | Curve plateaus because nearly all Hb binding sites are occupied |
Super Easy Memory Story
Imagine 20 hotel rooms (hemoglobin).
Two guests arrive:
- 😊 Oxygen
- 😈 Carbon monoxide
Carbon monoxide says:
“I have VIP priority—250 times stronger!”
It occupies almost all the rooms.
Oxygen has nowhere to stay.
Even though plenty of oxygen is outside,
it cannot use the hotel.
This is exactly what happens in CO poisoning.
🎯 MBBS Golden Rule
Carbon Monoxide
- ✔ Binds the same site on hemoglobin as oxygen.
- ✔ Has ~250× greater affinity than oxygen.
- ✔ Forms carboxyhemoglobin (COHb).
- ✔ Reduces oxygen-carrying capacity.
- ✔ Shifts the O₂-Hb dissociation curve to the left, reducing oxygen unloading to tissues.
- ✔ Causes severe tissue hypoxia despite a normal arterial PO₂ because the dissolved oxygen in plasma may remain normal while hemoglobin cannot effectively transport and release oxygen.
Final Concept to Never Forget
The key message of Figure 41.12 is not that carbon monoxide requires a high concentration to be dangerous. It is exactly the opposite:
Even an extremely small partial pressure of carbon monoxide can occupy a large fraction of hemoglobin because of its extraordinarily high affinity. This is why carbon monoxide poisoning is life-threatening even when the concentration of CO in the environment seems very low.
MADE BY SELF LEARNING CEO AND FOUNDER DR SHEEN
