


Anticoagulants are used in some thromboembolic conditions.
- In some thromboembolic conditions, slowing down blood clotting is helpful.
- For this purpose, different anticoagulant medicines have been developed.
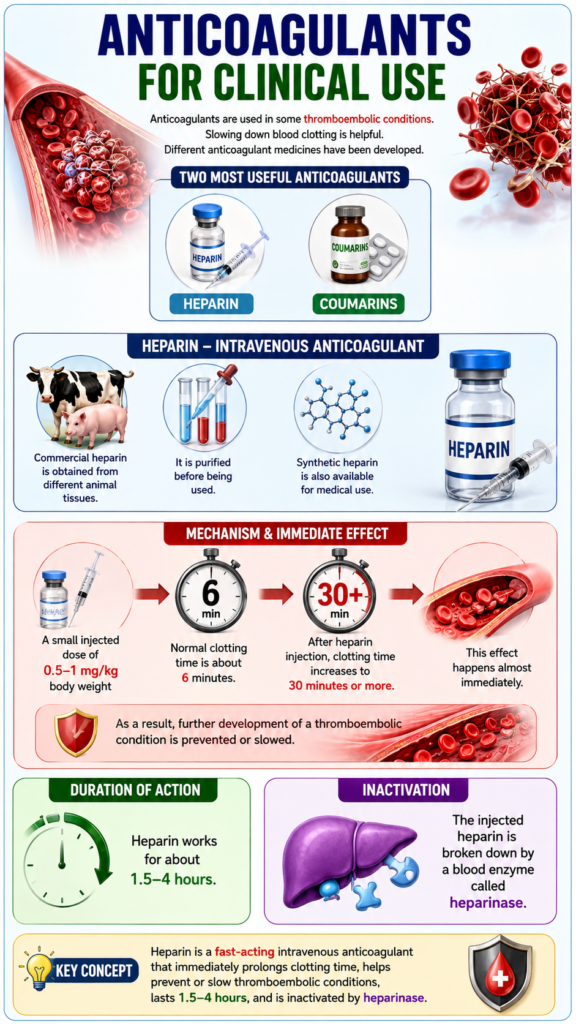
- The two most useful anticoagulants in clinical practice are:
- Heparin
- Coumarins
Heparin—Intravenous Anticoagulant
- Commercial heparin is obtained from different animal tissues.
- It is purified before being used.
- Synthetic heparin is also available for medical use.
- A small injected dose of 0.5–1 mg/kg body weight increases blood clotting time.
- Normal clotting time is about 6 minutes.
- After heparin injection, clotting time increases to 30 minutes or more.
- This effect happens almost immediately.
- As a result, further development of a thromboembolic condition is prevented or slowed.
Duration of Action
- Heparin works for about 1.5–4 hours.
- The injected heparin is broken down by a blood enzyme called heparinase.
Key Concept
- Heparin is a fast-acting intravenous anticoagulant that immediately prolongs clotting time, helps prevent or slow thromboembolic conditions, lasts 1.5–4 hours, and is inactivated by heparinase.
Coumarins as Anticoagulants
Effect of Coumarins on Coagulation Factors
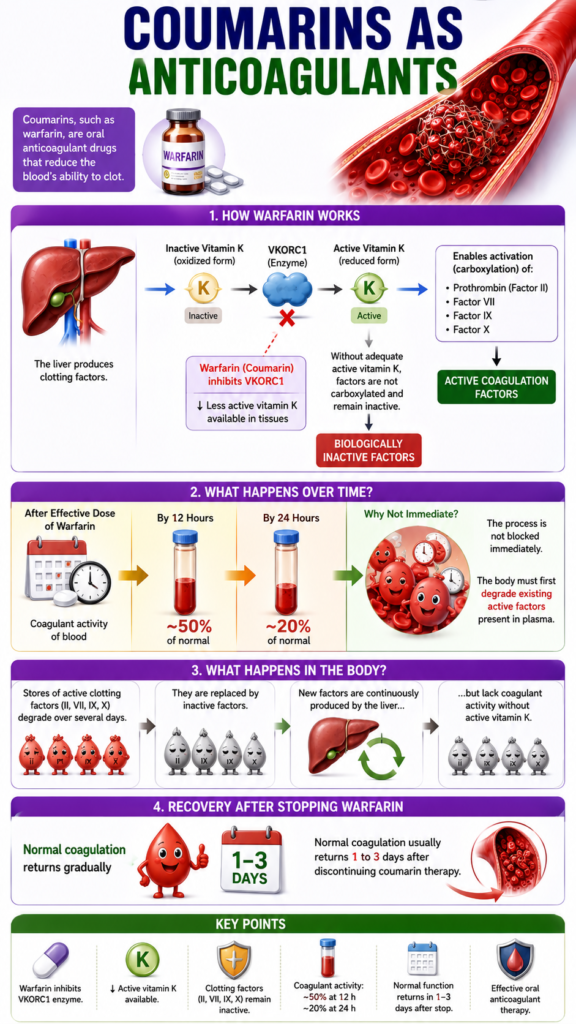
- Coumarins, such as warfarin, are given to reduce blood clotting.
- After warfarin is given, the levels of active prothrombin and factors VII, IX, and X begin to decrease.
- These clotting factors are produced by the liver.
Action of Warfarin
- Warfarin works by inhibiting the enzyme VKORC1.
- Normally, VKORC1 converts inactive (oxidized) vitamin K into its active (reduced) form.
- When VKORC1 is inhibited, less active vitamin K is available in the tissues.
Effect on Vitamin K
- Without enough active vitamin K, coagulation factors are not carboxylated.
- Non-carboxylated coagulation factors become biologically inactive.
- Over several days, the body’s stored active coagulation factors break down.
- They are replaced by inactive coagulation factors.
- The liver continues to produce coagulation factors.
- However, these newly produced factors have greatly reduced clotting activity.
Time Course of Warfarin Effect
- After an effective dose of warfarin:
- Blood clotting activity falls to about 50% of normal by 12 hours.
- Blood clotting activity falls to about 20% of normal by 24 hours.
- Warfarin does not block coagulation immediately.
- The body must first break down the active clotting factors already present in the plasma.
- Normal blood clotting usually returns 1–3 days after stopping coumarin therapy.
Key Concept
- Warfarin inhibits VKORC1, reduces active vitamin K, produces inactive coagulation factors, decreases blood clotting gradually, and normal coagulation usually returns 1–3 days after stopping treatment.
Prevention of Blood Coagulation Outside the Body
Blood Clotting in Different Containers
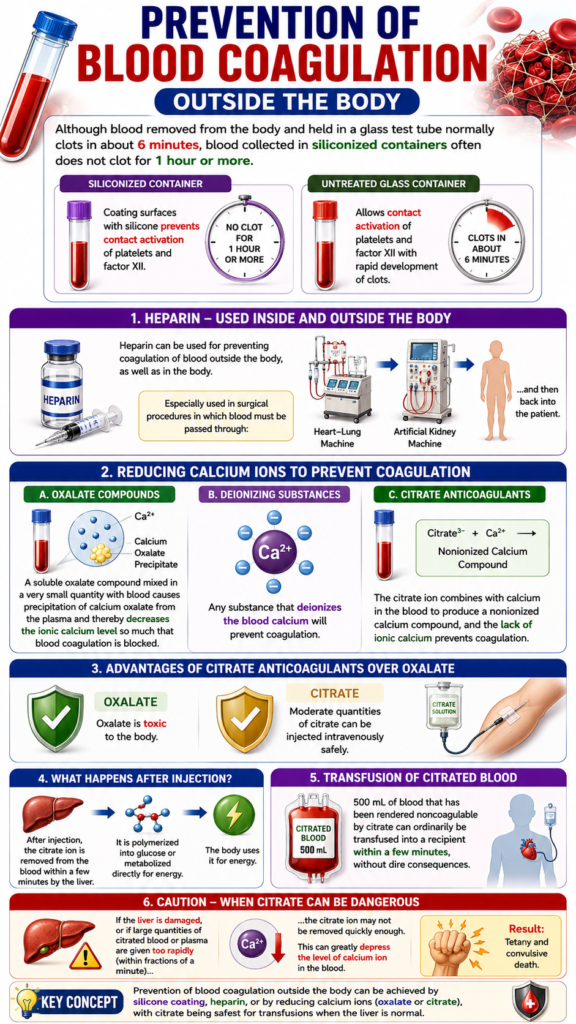
- Blood removed from the body usually clots in about 6 minutes when kept in a glass test tube.
- Blood collected in siliconized containers may not clot for 1 hour or more.
- Silicone coating prevents contact activation of:
- Platelets
- Factor XII
- Platelets and factor XII are the two main factors that start the intrinsic clotting pathway.
- Untreated glass containers allow contact activation of platelets and factor XII.
- As a result, blood clots develop quickly.
Heparin for Preventing Coagulation Outside the Body
- Heparin prevents blood clotting both outside and inside the body.
- It is especially used during surgical procedures.
- It is used when blood passes through:
- Heart-lung machine
- Artificial kidney machine
- After passing through the machine, the blood is returned to the patient.
Calcium Ion Reduction Prevents Coagulation
- Substances that reduce calcium ion (Ca²⁺) concentration can prevent blood clotting outside the body.
- Calcium ions are essential for blood coagulation.
Oxalate as an Anticoagulant
- A small amount of soluble oxalate can be mixed with blood.
- Oxalate forms calcium oxalate precipitate in the plasma.
- This greatly lowers the level of ionic calcium.
- Without enough ionic calcium, blood coagulation is blocked.
Citrate as an Anticoagulant
- Any substance that removes ionic calcium prevents blood clotting.
- Citrate ion is especially useful for this purpose.
- Citrate is usually added as:
- Sodium citrate
- Ammonium citrate
- Potassium citrate
- Citrate combines with calcium in the blood.
- This forms a non-ionized calcium compound.
- The lack of ionic calcium prevents coagulation.
Advantages of Citrate
- Citrate is safer than oxalate.
- Oxalate is toxic to the body.
- Moderate amounts of citrate can be injected intravenously.
- After injection, the liver removes citrate from the blood within a few minutes.
- The liver converts citrate into glucose or metabolizes it directly to produce energy.
- About 500 mL of citrated blood can usually be transfused safely within a few minutes.
Risk of Excess Citrate
- Problems can occur if:
- The liver is damaged.
- Large amounts of citrated blood or plasma are transfused too rapidly.
- In these situations, citrate is not removed quickly enough.
- Citrate lowers the blood calcium ion level significantly.
- Severe reduction in calcium can cause:
- Tetany
- Convulsive death
Key Concept
- Silicone prevents contact activation, heparin prevents clotting during extracorporeal circulation, and oxalate or citrate prevent coagulation by reducing ionic calcium, with citrate being safer but excessive citrate may cause severe hypocalcemia.
Blood Coagulation Tests
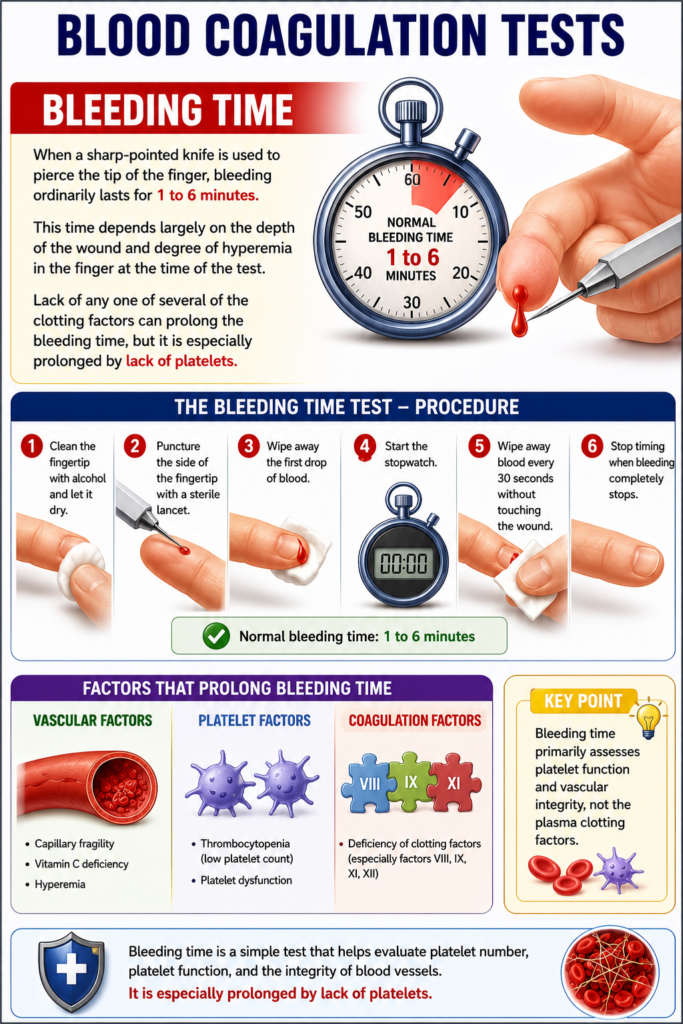
Bleeding Time
- Bleeding time measures how long bleeding continues after a small skin puncture.
- A sharp-pointed knife is used to pierce the tip of the finger.
- Normal bleeding time is about 1–6 minutes.
- The bleeding time mainly depends on:
- The depth of the wound.
- The degree of hyperemia (increased blood flow) in the finger during the test.
- Deficiency of any one of several clotting factors can prolong the bleeding time.
- Bleeding time is especially prolonged when there is a lack of platelets.
Key Concept
- Normal bleeding time is 1–6 minutes, depends on wound depth and finger hyperemia, and is prolonged by clotting factor deficiency, especially platelet deficiency.
CLOTTING TIME
Clotting Time
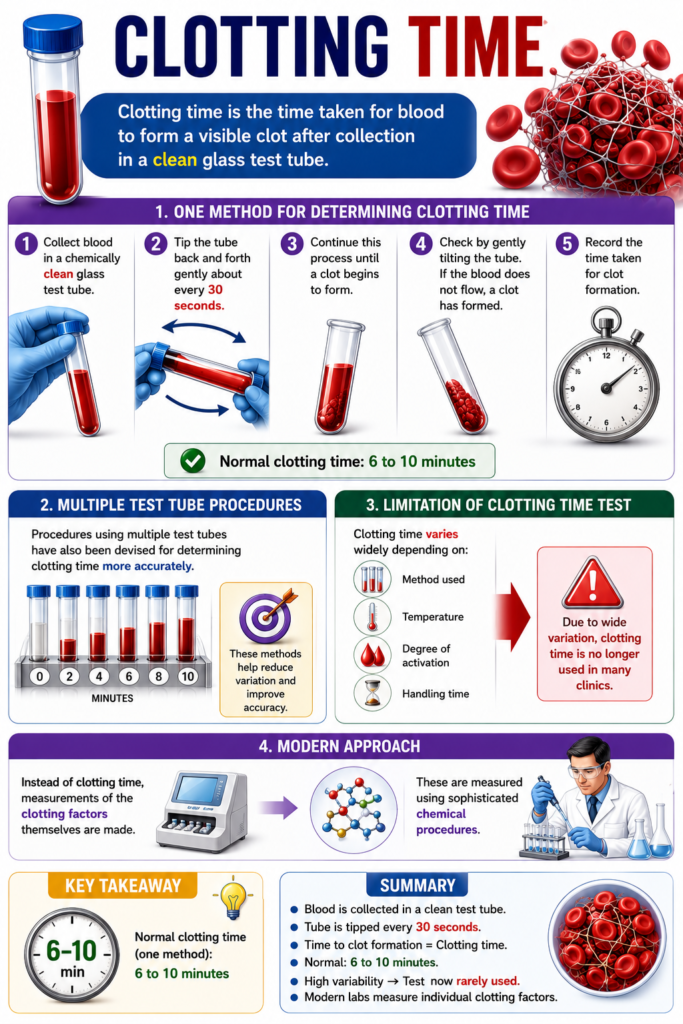
- Clotting time measures how long blood takes to form a clot.
- One method is to collect blood in a chemically clean glass test tube.
- The test tube is tilted back and forth every 30 seconds.
- This is continued until the blood forms a clot.
- Using this method, the normal clotting time is 6–10 minutes.
- Methods using multiple test tubes have also been developed.
- These methods measure clotting time more accurately.
Limitation of Clotting Time Test
- Clotting time varies widely depending on the method used.
- Because of this variation, the test is no longer used in many clinics.
- Instead, the clotting factors themselves are measured.
- These measurements are performed using sophisticated chemical procedures.
Key Concept
- Normal clotting time is 6–10 minutes, but because results vary with different methods, modern laboratories usually measure specific clotting factors instead of clotting time.
Prothrombin Time and International Normalized Ratio
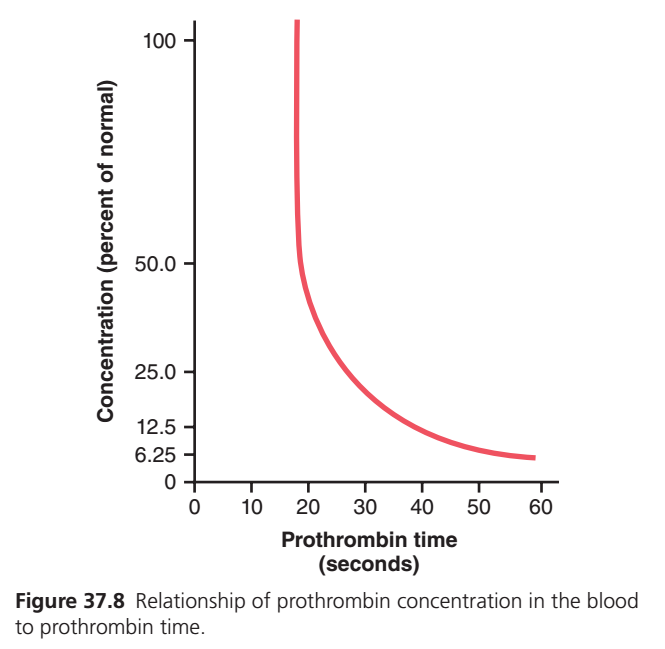
Figure Mentioned: Fig. 37.8 – Relationship between prothrombin concentration and prothrombin time.
Prothrombin Time (PT)
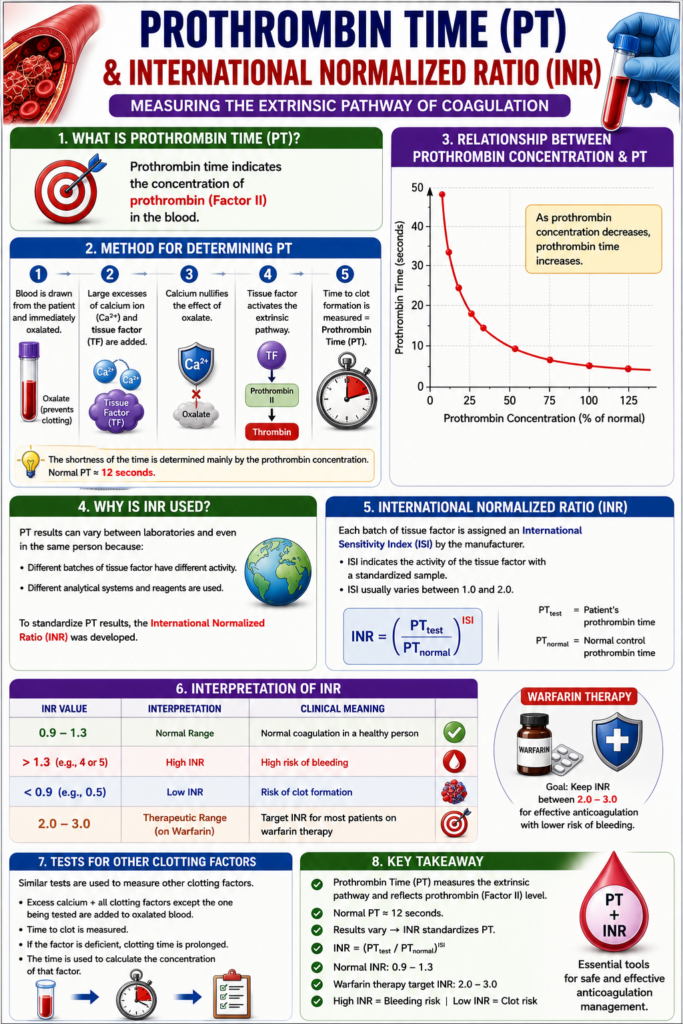
- Prothrombin time (PT) indicates the concentration of prothrombin in the blood.
- Fig. 37.8 shows the relationship between prothrombin concentration and prothrombin time.
- PT is measured using a specific laboratory method.
Method for Determining Prothrombin Time
- Blood is removed from the patient.
- The blood is immediately mixed with oxalate.
- Oxalate prevents prothrombin from changing into thrombin.
- Large excesses of calcium ions and tissue factor are then added.
- Excess calcium removes the effect of oxalate.
- Tissue factor activates the conversion of prothrombin to thrombin through the extrinsic clotting pathway.
- The time taken for blood to clot is called the prothrombin time (PT).
Normal Prothrombin Time
- The length of PT mainly depends on the concentration of prothrombin.
- Normal prothrombin time is about 12 seconds.
- Each laboratory prepares its own curve relating prothrombin concentration to PT.
- This curve is used to measure the amount of prothrombin in blood.
Variation in Prothrombin Time
- PT results may vary even in the same person.
- The variation depends on:
- The activity of the tissue factor.
- The analytical system used for the test.
- Tissue factor is obtained from human tissues, such as placental tissue.
- Different batches of tissue factor may have different activity.
International Normalized Ratio (INR)
- INR was developed to standardize PT measurements.
- Each tissue factor batch is assigned an International Sensitivity Index (ISI).
- ISI shows the activity of tissue factor compared with a standard sample.
- ISI usually ranges from 1.0 to 2.0.
INR Formula
INR=(PTnormalPTtest)ISI
Normal and Clinical INR Values
- Normal INR in a healthy person is 0.9–1.3.
- A high INR (4–5) indicates a high risk of bleeding.
- A low INR (0.5) suggests an increased chance of clot formation.
- Patients receiving warfarin therapy usually have an INR of 2.0–3.0.
Tests for Other Clotting Factors
- Similar tests are used to measure other blood clotting factors.
- Oxalated blood is used for these tests.
- Excess calcium ions and all clotting factors except the one being tested are added.
- The time required for coagulation is then measured.
- If the tested clotting factor is deficient, coagulation time is prolonged.
- The coagulation time is used to determine the concentration of that clotting factor.
Key Concept
- PT measures prothrombin activity, normal PT is about 12 seconds, INR standardizes PT using the ISI, normal INR is 0.9–1.3, warfarin therapy targets an INR of 2.0–3.0, and prolonged coagulation time indicates deficiency of the tested clotting factor.
The INR equation solve here INR=(PTnormalPTtest)ISI
Mathematical Rearrangement (Solve for PTtest)
Take both sides to the power of 1ISI\frac{1}{\text{ISI}}ISI1:INRISI1=PTnormalPTtest
Multiply both sides by PTnormal:PTtest=PTnormal×INRISI1
Example 1
Given:
- PTnormal = 12 seconds
- ISI = 1.0
- INR = 2.5
PTtest=12×2.51/1 =12×2.5=30 seconds
Answer: PTtest = 30 seconds
Example 2
Given:
- PTnormal = 12 seconds
- ISI = 1.5
- INR = 2.5
PTtest=12×2.51/1.5 =12×1.842 ≈22.1 seconds
Answer: PTtest ≈ 22.1 seconds
Final Formula to Remember
INR=(PTnormalPTtest)ISI PTtest=PTnormal×INRISI1
This graph is one of the most important MBBS physiology graphs from Guyton Physiology (Chapter 37). Many students memorize it without understanding it. Let’s understand every line, every point, and the physiological concept in the easiest way.
Figure 37.8: Relationship Between Prothrombin Concentration and Prothrombin Time
Step 1: What is this graph trying to tell us?
The graph answers one simple question:
If the amount of prothrombin in blood decreases, how much does the Prothrombin Time (PT) increase?
In simple words,
- Less Prothrombin → Blood clots more slowly → PT becomes longer.
Step 2: Understanding the X-axis
X-axis = Prothrombin Time (PT) in seconds
0 10 20 30 40 50 60This tells how many seconds blood takes to clot.
Moving toward the right means:
- Blood is taking longer to clot.
- Clotting ability is decreasing.
Think of it like this:
More seconds
=
Slower clotting
=
More bleeding risk
Step 3: Understanding the Y-axis
Y-axis = Prothrombin concentration (% of normal)
100%
50%
25%
12.5%
6.25%
0%
This tells how much prothrombin is present compared with a healthy person.
Example
| Prothrombin (%) | Meaning |
|---|---|
| 100% | Normal person |
| 50% | Half of normal |
| 25% | Only one-fourth left |
| 12.5% | Very low |
| 6.25% | Extremely low |
Moving downward means:
Less prothrombin
↓

Less thrombin formed
↓

Less fibrin formed
↓

Clot forms slowly
Step 4: Why is the line curved?
Notice the graph is not straight.
Instead it bends.
Why?
Because:
Initially, losing a little prothrombin doesn’t affect clotting much.
But once prothrombin becomes very low,
even a tiny further decrease causes a huge increase in PT.
This is called a non-linear (inverse) relationship.
Step 5: Understanding Every Part of the Curve
Part A (Top Left)
100%
 │
 │
 │
 │
 │
Here,
Prothrombin concentration is normal.
PT is around 12–15 seconds.
Everything is normal.
Think:
Enough prothrombin

↓

Enough thrombin

↓

Enough fibrin

↓

Normal clot
Part B (Very Steep Vertical Portion)
100%
 |
 |
 |
 |
50%
This is the most confusing part.
Notice the line falls almost straight down.
What does this mean?
It means
When PT is still near normal,
prothrombin concentration can decrease quite a lot,
yet PT changes only slightly.
For example
100%

↓

90%

↓

80%

↓

70%

↓

60%

↓

50%
PT hardly changes.
The liver makes enough clotting factors to maintain clotting.
The body has a large safety reserve.
This is why mild liver disease or early vitamin K deficiency may still show a nearly normal PT.art C (Middle Curved Portion)
50%

↓

25%

↓

12.5%
Now things begin to change rapidly.
The body is losing its safety reserve.
Small decreases in prothrombin now produce noticeable prolongation of PT.
Example
50%

↓

PT ≈18 seconds
Then
25%

↓

PT ≈25 seconds
See?
Only half the prothrombin was lost,
but PT increased a lot.
Part D (Lower Flat Portion)
12.5%

↓

6.25%
This represents severe deficiency.
Here,
very little prothrombin remains.
The liver cannot make enough clotting protein.
Now PT becomes extremely long.
Example
6%

↓

PT ≈60 seconds
Blood hardly clots.
Massive bleeding risk.
Step 6: Why does PT suddenly increase?
Think about making bricks.
Suppose you need 100 bricks to build a wall.
If you have
100 bricks

↓

Wall built.
Now suppose you lose 10 bricks.
90 bricks

↓

Still enough.
Lose another 20.
70 bricks

↓

Still okay.
Now only 20 bricks remain.
20 bricks

↓

Wall cannot be completed.
Exactly the same happens with prothrombin.
The body can compensate until a point.
After that,
clotting fails rapidly.
Step 7: Physiological Explanation
Prothrombin is converted into thrombin.
Prothrombin

↓

Thrombin

↓

Fibrinogen

↓

Fibrin clot
If prothrombin decreases,
less thrombin is formed.
Less thrombin means
- slower fibrin formation
- slower clot formation
Therefore
PT increases.Step 8: Why is PT used clinically?
Doctors measure PT because it tells whether the extrinsic and common clotting pathways are functioning properly.
PT becomes prolonged in:
- Vitamin K deficiency
- Warfarin therapy
- Liver disease
- Severe clotting factor deficiency
- Disseminated intravascular coagulation (DIC)
Step 9: Understanding the Numbers on the Graph
The percentages on the Y-axis
100

↓

50

↓

25

↓

12.5

↓

6.25
are halving each time.
This shows that as the prothrombin concentration is reduced by half repeatedly, the PT increases disproportionately, especially once the concentration falls below about 50%.
Step 10: One-Line Interpretation of the Curve
High prothrombin
↓

Normal PT
↓

Normal clotting
Moderately decreased prothrombin
↓
Slightly prolonged PT
↓
Clotting still occursVery low prothrombin
↓
Markedly prolonged PT
↓
Poor clot formation
↓
Bleeding tendencyStep 11: Memory Trick (Concept)
Imagine Prothrombin as workers building a bridge.
- 100 workers → Bridge built quickly (Normal PT)
- 80 workers → Still fast
- 60 workers → Slight delay
- 30 workers → Big delay
- 10 workers → Bridge almost never finished (Very long PT)
The body has a reserve capacity, so early losses have little effect. Once the number of workers falls below a critical level, the bridge (blood clot) takes much longer to complete.
High-Yield MBBS Exam Points
- X-axis: Prothrombin Time (seconds)
- Y-axis: Prothrombin concentration (% of normal)
- Relationship: Inverse (less prothrombin → longer PT)
- Normal PT: Approximately 11–15 seconds
- PT remains near normal until prothrombin falls significantly because of the body’s clotting reserve.
- Once prothrombin drops below about 50%, PT increases much more rapidly.
- Very low prothrombin results in a markedly prolonged PT and a high risk of bleeding.
- PT is used to monitor Warfarin therapy, assess Vitamin K deficiency, and evaluate liver function because the liver synthesizes prothrombin and other clotting factors.
Easy MBBS Concept to Remember
↓ Prothrombin
        ↓
↓ Thrombin
        ↓
↓ Fibrin formation
        ↓
Slower blood clot
        ↓
↑ Prothrombin Time (PT)
        ↓
↑ Bleeding risk
Golden Rule:
The lower the prothrombin concentration, the longer the prothrombin time—but the increase is not linear. The body compensates well at first, then PT rises sharply once prothrombin becomes critically low.
MADE BY SELF LEARNING CEO AND FOUNDER DR SHEEN
